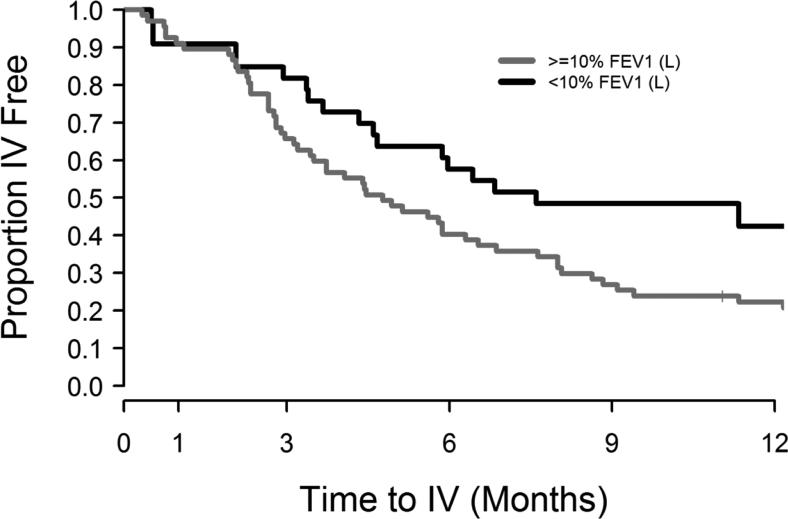
Figure 5. Kaplan-Meier survival curves for time to next IV antibiotic episode by immediate FEV1 response with treatment.
Proportion IV antibiotic free by time (after study PEx) in participants with <10% relative FEV1 (L) response during PEx treatment (black lines, n=35) and those with ≥10% relative FEV1 (L) response during treatment (gray lines, n=67).

