

Abstract
Objectives/Hypothesis
This paper discusses the effects of measurement uncertainties when calculating elastic moduli of laryngeal tissue.
Methods
Small dimensions coupled with highly nonlinear elastic properties exacerbate the uncertainties. The sensitivity of both tangent and secant Young’s Modulus was quantified in terms of the coefficient of variation, which depended on measurement of reference length and cross-sectional area.
Results
Uncertainties in the measurement of mass, used to calculate cross-sectional area of a small tissue sample, affected Young’s Modulus calculations when tissue absorption of the hydrating solution was not accounted for. Uncertainty in reference length had twice the effect on elasticity than other measures.
Conclusions
The implication of these measurement errors on predicted fundamental frequency of vocalization is discussed. Refinements on isolated muscle experimental protocols are proposed that pay greatest attention to measures of highest sensitivity.
Keywords: elasticity, fundamental frequency, larynx; sensitivity analysis
I. INTRODUCTION
Mathematical models of vocal fold posturing1, 2 and phonation3–6 are based on biomechanical description of laryngeal muscles7, 8and other tissues (i.e., the vocal ligament and mucosa). One biomechanical property is tissue elasticity, which is often quantified by Young’s Modulus, a ratio between longitudinal stress and strain. When calculating Young’s Modulus of small tissue samples, the uncertainties that stem from quantifying the tissue’s length and cross-sectional area can be significant, even if they would be inconsequential in larger muscle systems (e.g., the lower limbs9, 10). Although many studies of laryngeal tissue elasticity have been completed, the effects of these uncertainties on the results are not adequately discussed in the literature. Therefore, if the results of previous studies are to be fully understood and used in laryngeal models, it is important to quantify and identify which measurement errors might impact Young’s Modulus of laryngeal tissue the most.
In calculating Young’s Modulus, potential errors in length and cross-sectional area arise from defining the edges of a tissue sample. For example, in the vocal ligament, a precise length is difficult to measure because the ligament gradually thickens into the macula flava11 before it attaches to the cartilages. An exact endpoint is difficult to determine. Moreover, even when tissue boundaries are clear, establishing one representative length of a tissue sample can be problematic. As another example, for the thyroarytenoid (TA) muscle, fiber attachment to the thyroid cartilage is distributed along a curved cartilage, so that fiber length is not uniform (nearly a 12% variation). Thus, when the insertion and origin surfaces of a muscle are not parallel to each other, the fibers on one side of the sample are different in length from the ones on the other side (Figure 1). Because it is difficult to reconstruct this non-parallel boundary orientation precisely in a laboratory apparatus, the chance for measurement errors in effective length is increased.
Figure 1.
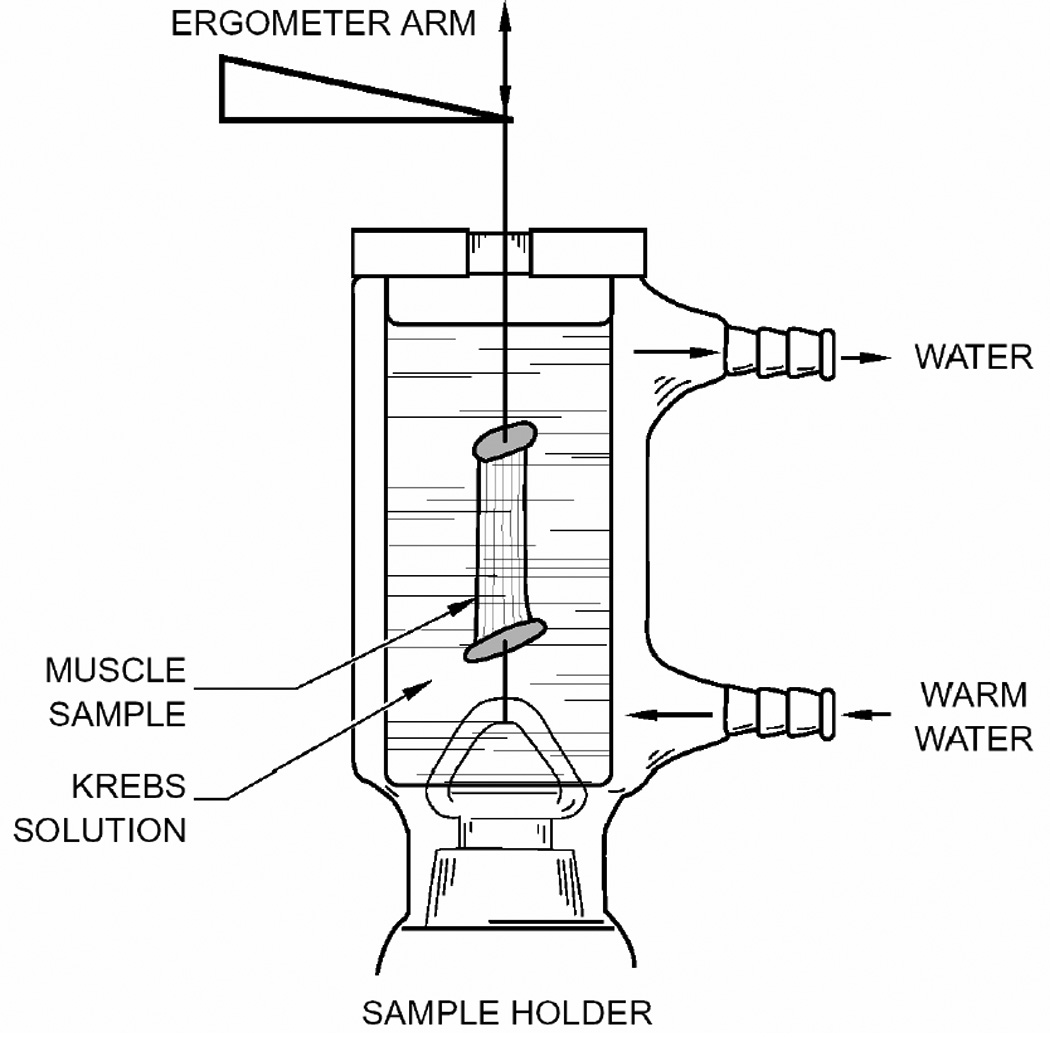
In Vitro laboratory apparatus for measuring muscle elasticity; note that the fibers are not the same length. (After Alipour et al.7)
In addition to uncertainties in the length of laryngeal tissues, other uncertainties originate from difficulties in defining cross-sectional area (because of non-uniformity from origin to insertion point and because of the small size). One method often used to reduce these uncertainties is to dissect smaller portions of tissue (fiber bundles) from larger samples, thus enhancing the uniformity of a given measurement sample. While the smaller sample can be more uniform in length, larger uncertainties in measuring its cross-sectional area arise. To circumvent this measurement difficulty, Perlman and Titze12, 13 advocated calculating the average area of a sample from the mass, density and length of the sample. However, this method simply changes the source of errors from a direct measurement of cross-sectional area to a measurement of mass and reference length. Because excised tissue is often bathed in solution before being weighed (to maintain its viability during experiments), the measurement of mass in many studies reflects the hydration condition of the tissue14. Exact in vivo hydration is impossible because experimental protocol requires bathing the tissue in medium.
Given these measurement uncertainties, the specific purpose of this study was to quantify the sensitivity of Young’s Modulus to their inevitable occurrence. Such an examination allowed us to more accurately interpret past studies, as well as improve future studies on tissue elasticity.
II. METHODS
Variance-based sensitivity analysis, focusing on as the measure of Young’s Modulus, was conducted. While this analysis was theoretical, some empirical stress-strain data from a laryngeal muscle was used to illustrate this sensitivity. Means and standard deviations from previously reported data were treated as known quantities in the sensitivity analysis. As in most previous studies of laryngeal muscles, L0 was defined to be the in vivo reference length of the muscle (it should be noted that this definition of reference length is different from the common muscle physiology definition, the optimal sarcomere length for maximum active contractile stress of a muscle).
A. Definitions
Conventional longitudinal stress σ, and strain ε are derived from an axial force F, the initial cross-sectional area A0, the reference length L0, and the experimental length L1. The change in length, ΔL, is defined as L1−L0. Thus,
| (1) |
| (2) |
The ratio of stress to strain is known as the Secant Young’s Modulus and the differential change of stress with respect to strain is known as the Tangent Young’s Modulus,
| (3) |
| (4) |
If ΔL (elongation) and the resultant F are known from a laboratory measurement, A0 and L0 are required to calculate stress and strain. In a small sample, L0 (between 8 and 22mm for laryngeal muscles) can be measured in a straightforward fashion with a caliper, although the experimenter may have to take an average length between the shortest and longest fibers in a sample because of the non-uniform ends of the sample. It is more difficult to measure A0 with a caliper because of the non-uniformity and small size of the diameter. Using the Perlman and Titze13 method, A0 of a tissue sample is therefore approximated in terms of three measured quantities, mass (m), density (ρ), and reference length (L0):
| (5) |
If the standard deviations of the three measured quantities are known, the empirical error of E could be calculated for each quantity.
Substituting Eq. 5 and Eq. 1 into Eq. 3, the dependence of ESEC on the three measured parameters, m, ρ, and L0 is known,
| (6) |
Since E is usually measured over several points or from a cyclic or continuous stretch, subscript n is used to represent an arbitrary single, discrete point along this stretch. Similarly to Eq. 6, substituting Eq. 5 and Eq. 1 into Eq. 4, the dependence of ETAN on the same parameters is known,
| (7) |
B. Theoretical Sensitivity to Measurement Errors
ESEC and ETAN (from the relations above) are affected linearly by errors in ρ and m, but to second power by errors in L0. Without discussing the errors numerically, L0 variations would have the largest effect on E. The effects can be empirically written in terms of the percentage of nominal E (%En) or a coefficient of variation, which is then dependent on the standard deviation of each quantity (stdm, stdρ, and stdLo):
| (8) |
| (9) |
| (10) |
The above equations represent the propagation of errors in the individual measures as if they occurred one at a time. While this technique is useful in exploring which individual measured quantity’s uncertainty would have the greatest effect on the outcome, it is also useful to explore the combined effect. Using techniques for investigating multiple errors simultaneously (essentially the sum of the variations above simplified using the binomial expansion15), the most extreme percent change in E would be:
| (11) |
Since the measures are independent, it is likely that an overestimation of one quantity would be accompanied by an underestimation of another; therefore, a realistic result of all errors together would be something between the nominal and the most extreme value. If the uncertainty of each measure were governed by a normal distribution, then the largest errors would govern the result, with the probable uncertainty or percent change in E written as
| (12) |
C. Sensitivity to Errors: A Laboratory Example
A canine cricothyroid (CT) muscle fiber bundle was prepared for use in an experimental setup as described in Alipour et al.7 (Figure 1). In summary, standard dissection equipment was used to dissect and prepare a CT muscle bundle sample. The fiber bundle mass (m=0.194 g) was measured with a Mettler electronic balance (model AE 100, ± 0.1 mg) immediately after dissection. The sample was attached to a force-displacement transducer (dual servo Aurora Scientific ergometer: ±0.05 g, ±0.02 mm), while hydration was maintained in a temperature-controlled hydration bath (Radnoti Glass Technologies). If cartilage anchors had been needed for suture rather than clamp attachment, mass measurements could not be made until the cartilage anchors had been removed. Digital and analog calipers were used to measure muscle length and approximate diameter. With the fiber bundle placed in the apparatus, ΔL (where L0=13.1 mm) and the resulting F data were obtained from a slow stretch (1mm/100sec) of the bundle (Fig. 2-top). These data were converted to stress-strain (Fig. 2-bottom left) and the Young’s modulus E was calculated (Fig. 2-bottom right).
Figure 2.
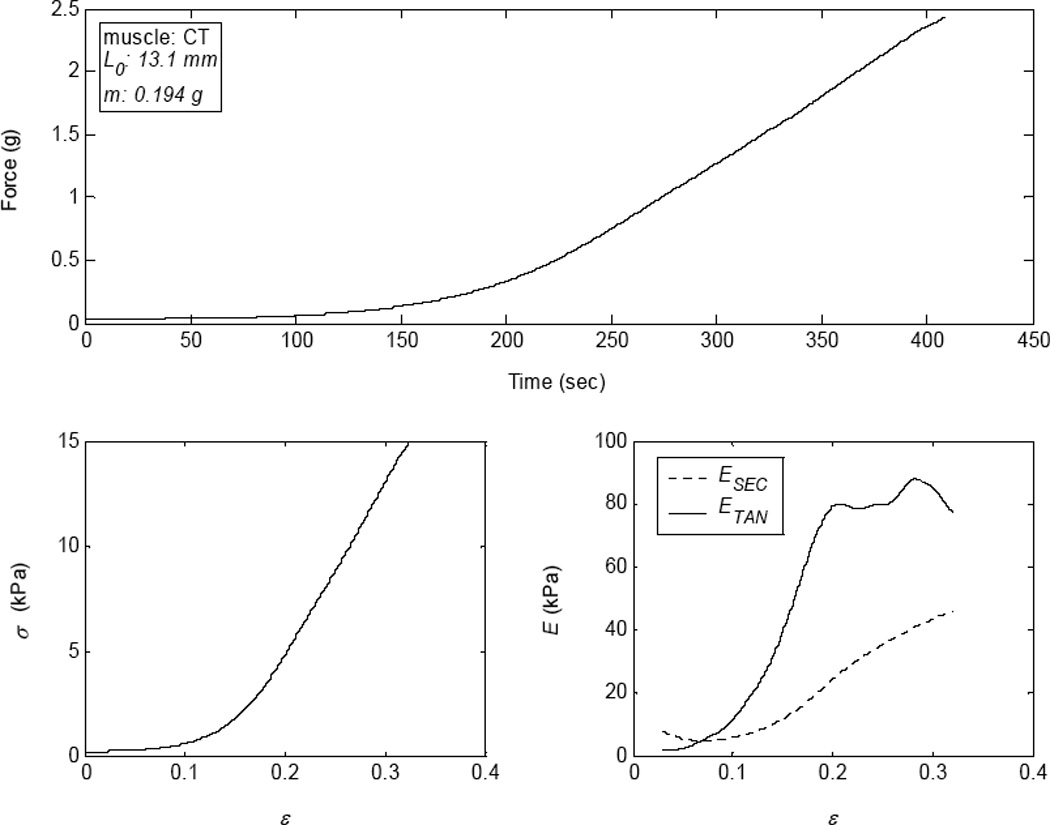
(top) Force during an elongation of a canine cricothyroid (CT) muscle. (bottom left) Stress-strain curve of the CT muscle, shown to 30% strain. (bottom right) The tangent Young’s Modulus of the CT muscle.
Sensitivity to Mass
Using a precision balance, there was negligible instrument uncertainty (±0.1 mg). Thus, the focus was on the potential errors introduced by bath hydration of excised tissue, where this increase in mass from hydration was used as the variation of mass. Eight laryngeal muscle samples (two fiber bundles from four of the five intrinsic laryngeal muscles) from a single laryngeal specimen were dissected. The L0 of each fiber bundle (after dissection) and the original m were measured. Each sample was then hydrated in a Krebs-Ringer solution for 1 minute and the mass was re-measured (wet m); next, the sample was dried by rolling it on a Kimwipe™ one full turn and re-measured (dried m). This process of measuring was repeated multiple times with one minute of hydration between each trial. As expected, the fiber bundle had a greater mass after each hydration, although the increase in mass was nearly level after three repetitions. The mass measures were normalized to the original mass, expressed as a percentage, and averaged over all samples (Fig. 3).
Figure 3.
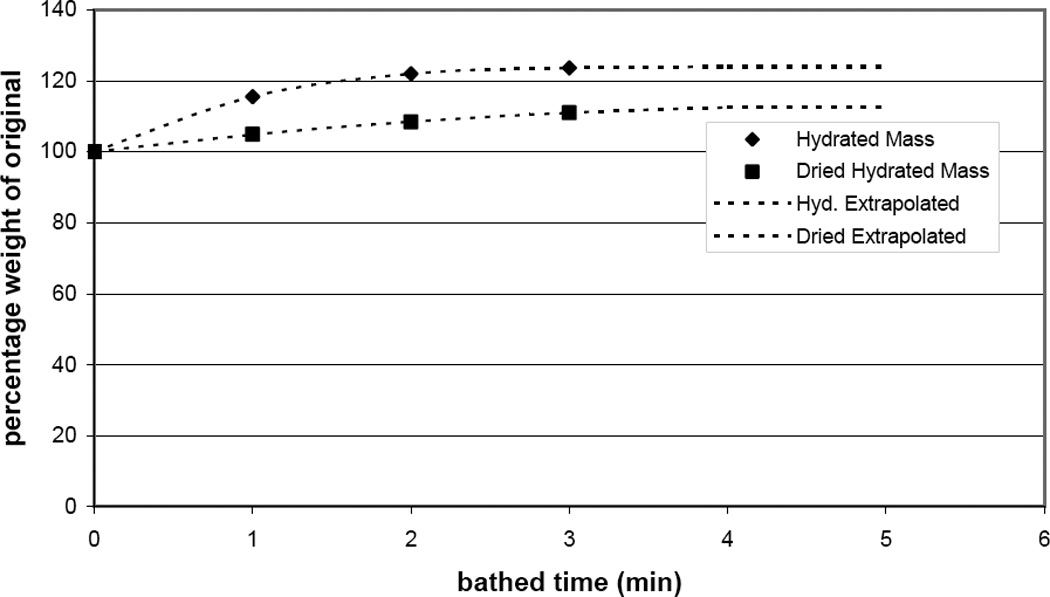
Change in mass of bathed excised muscle bundles (in percentage of the original weight) as the tissue absorbs the hydrating/nourishing solution.
The results showed that the final wet m was greater than the original m by 24±4.5%, while the dried m was greater by 13±2.8%. Because it is often necessary in an experimental protocol to leave cartilage, or other anatomical anchors, in place for attachment to the ergometer, the dissected sample is bathed before its mass is obtained; however, it is unlikely that a researcher would use the wet m without wiping off excess moisture. Therefore, the standard error of bathed muscle mass measurement was considered to be +13±2.8%. Equation 8 then becomes:
| (13) |
with %En decreasing on average 11.5% for a 13% increase in mass measurement (Fig. 4-top left).
Figure 4.
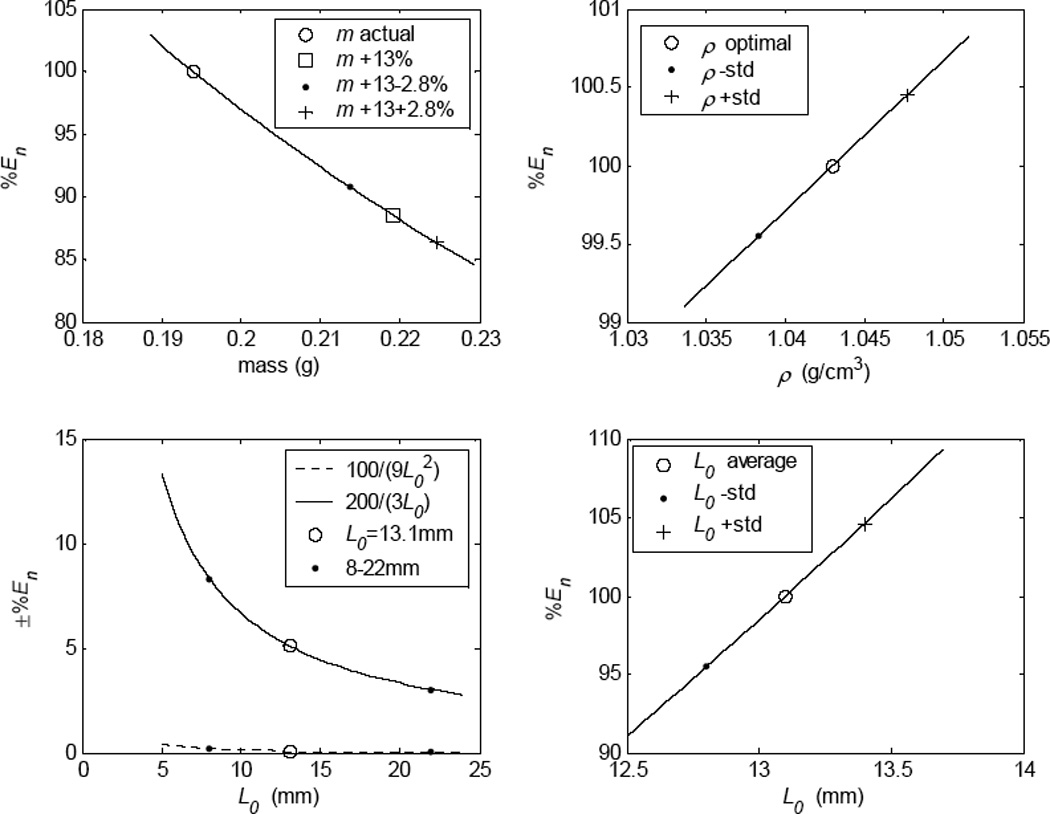
(top left) The potential percent change in Young’s Modulus (%En) calculation due to hydrating the muscle before measuring mass. (top right) The potential %En as dependent on the standard deviation of the tissue density. (bottom right) The potential %En as dependent on the standard deviation of length measurements (±1/3mm). (bottom left) The potential %En over the range of laryngeal muscle lengths.
Sensitivity to Density
Average density, ρ, of laryngeal tissue was reported12, 13 as 1.043 g/cm3 ±0.00047. Using the standard deviation as stdρ, %En was calculated from Eq. 9 to be ±0.45%. Thus, the small variation in tissue density of laryngeal muscle did not significantly affect the calculation of E in laryngeal muscles (Fig. 4-top right).
Sensitivity to Length
The CT sample had an average dissected length of 13.1 mm after ten repeated measures from three investigators, with a standard deviation of ±0.33mm (corresponding closely to ±0.25mm as measured by Cox et al.16 in a previous laryngeal muscle study). Rewriting Eq. 10 after substituting ±0.33 mm for stdLo resulted in:
| (14) |
The first term (100 × 1/9L02) added less than ±1.0% error to the value of E when L0 was 4 mm (the largest percent change) and about ±0.2% error when L0 was 8 mm, with Fig. 4-bottom left (dashed line) displaying intermediate values. Because laryngeal muscles are normally between 8–22 mm in length, this term could be neglected if simplification were desired. On the other hand, the last term (±100 × 2/3L0; plotted in Fig. 4-bottom left, solid line) added a significant percentage change to nominal E for laryngeal muscles, with 3% potential change for a 22 mm muscle length (e.g., TA) and approximately 8% change for an 8 mm muscle (e.g., interarytenoid muscle). The potential error in calculating E for the CT muscle used in this study (with an L0 = 13.1 mm) was just under ±5% of the nominal value.
The most extreme outcome for percent change in E, using Equation 11 and the numbers above, was calculated:
| (15) |
Since the mass increase due to hydration solution absorption was not a normal distribution but an increase of 13%, the most probable outcome could not be calculated using Equation 12. Nevertheless, if it were assumed that a mass adjustment for absorption had been made in an experiment, the most extreme outcome and the most probable uncertainty could be calculated. In that case, using the mass adjustment above, Eqs. 11 and 12 would result in:
| (16) |
| (17) |
On the other hand, if the mass were measured at the time of dissection, there would be little contribution from mass uncertainty and Eq. 11 and 12 would result in
| (18) |
| (19) |
where the uncertainty in length dominates these cases.
D. Sensitivity of Predicted Fundamental Voice Frequency to Measurement Error
While the above details specifically relate to laryngeal muscles, similar measurement uncertainties would exist for measurement of any laryngeal tissue. Of specific interest is the vocal ligament, which is approximately the same length as the laryngeal muscles. Its longitudinal stress is a primary contributor to vocal fundamental frequency17. Therefore, any uncertainty affecting the quantization of the ligament’s mechanical properties would affect the prediction of vocal fundamental frequency. A first order indication of the effect of vocal fold tissue on phonation fundamental frequency (F0) was proposed by Titze17 who used the ideal string model, Eq. 20:
| (20) |
To find the sensitivity of F0 to tissue measurement errors, Eq. 20 was rewritten in terms of the measurable quantities noted above:
| (21) |
In Eq. 21, F0 is not dependent on ρ.
Min et al18 studied 8 human vocal ligaments. From that study, a representative ligament would have an m of 0.107 g and an L0 of 13.6 mm. Using these numbers, the percentage of nominal F0 (%F0,n) was written as dependent on the standard deviation of mass (stdm) and the standard deviation of length (stdLo),
| (22) |
| (23) |
Unfortunately, no indication was given on how long the ligaments used by Min et al18 were bathed before weighing (only that they were bathed); additionally, no indication was made that the mass of the bathed samples was adjusted for hydration solution absorption. Using the mass of the average ligament above and assuming that the sample was hydrated and its mass should be adjusted (using the 13±2.8% value above), Eq. 22 would result in a range of 105.5–109.0%.
The sensitivity of F0 to reference length also includes a square root, which effectively reduces the overall sensitivity of F0 to errors in defining and measuring the reference length. Using the length of the ligament above and the standard deviation from the muscles above, the predicted F0 would vary by ±1.2%.
The most extreme case of error predicted for F0 occurs without a mass adjustment where the change in F0 would include 7.5% increase:
| (24) |
If Min et al. did adjust for a ligament mass increase from hydrating solution absorption, the extreme probable case for %F0,n would be:
| (25) |
In summary, if the mass increase were adjusted for, predicted F0 would not vary much with the errors of length measurements alone (±1.9%). However, if mass were not adjusted for, using the data from Min et al. to predict F0 would result in an overestimation of the nominal value by 4–9%.
III. DISCUSSION
Sensitivity of the Young’s Modulus (E) to measurement uncertainty in length and cross-sectional area was completed theoretically with a laboratory example. Empirically, the analysis used Perlman and Titze’s12, 13 method of calculating an averaged cross-sectional area from density (ρ), mass (m), and reference length (L0). While tangent E and secant E are not identical, they were shown to be identically sensitive to the same combined quantity of ρ, m, and L0 (ρ L02/m). In other words, because L0 was present in both stress and strain equations, both tangent and secant E were related to the square of the uncertainty in L0. Further, while the calculation of tangent and secant E was inversely related to uncertainty in m, it was directly related to uncertainty in ρ; nevertheless, uncertainty in ρ negligibly affected the accuracy of the average area calculation and, thus, Young’s Modulus.
The most significant error affecting the calculation of Young’s Modulus was the increase in mass from tissue hydration. While the best way to circumvent this error would be to weigh the sample immediately after dissection, this may not be feasible in all experimental protocols. Therefore, a mass compensation of −13% for laryngeal muscles previously hydrated in a tissue bath (the average increase in hydrated laryngeal muscle shown) would be appropriate. This compensation may be different for other tissue types, however (e.g., ligaments or tendons) and a high statistical power should be obtained.
A final important note relates to the utility of the Perlman and Titze method of approximating an average cross-sectional area of laryngeal tissuesfrom a mass measurement. For small tissue samples (like laryngeal tissues), calculating average cross-sectional area (adjusting for the mass increase from tissue hydration) was shown to be far superior to direct measurement of the cross-sectional area. Even if the cross-section were perfectly uniform, the caliper measurement of diameter (with the standard deviation above of 0.33 mm) would affect Young’s Modulus by about 15%).
The sensitivity of a simple model of vocal fundamental frequency (as modeled by an ideal string) to measurement uncertainties was shown to not include density, as it does not appear in the equations. However, predicted F0 is related to the square root of reference length and the inversely related to the square root of mass. In the case of the reported ligament data18, where there was no indication of mass adjustment from absorption of hydration solution, adjusting the mass would increase the estimated F0 by an average of 7.5% over the unadjusted mass value. Considering the human vocal F0 (about 80–500 Hz for male and 180–1050 Hz for female), the effect of this uncertainty on predicted F0 would be significant (~7–70 Hz over the entire F0 range). However, vocal ligaments may absorb a different amount of solution if bathed and could have a different mass adjustment affecting the final result.
CONCLUSIONS
A theoretical analysis of the sensitivity of Young’s Modulus to standard error in measurement of length and cross-sectional area was conducted with a laboratory example. Such a sensitivity analysis is of particular interest for small muscle systems, like the laryngeal system, where geometrical uncertainty can be significant. While the analysis was focused on the laryngeal system, results and conclusions would be applicable to any geometrically small muscle system.
From this sensitivity study, the following key recommendations for accurate elasticity measurements of tissue samples are made. First, a method like the one Perlman and Titze discussed should be used for calculating the cross-sectional area, replacing the problematic measurement of a small diameter with the more accurate measurements of length, mass, and density. Second, the mass of muscle bundles should be measured immediately upon dissection or, if not possible, a mass correction should be used to account for the muscle absorbing solution. Third, because the sensitivity of Young’s Modulus to length includes a square term, the longest fiber bundle possible should be used (when the choice is available) to reduce error. Fourth, it is essential to re-examine some of the definitions which have commonly been used in laryngeal studies to avoid errors. For example, uncertainties in the calculation of Young’s Modulus arise when the pre-strained nature of many tissues are accounted for in an experimental setup (i.e., tissue length reduces upon dissection12). One common way to avoid this error has been to define the reference length as the optimal sarcomere length. But this involves microscopy, which is not feasible in conjunction with in vitro biomechanics. Furthermore, connective tissues like the ligament cannot contract and therefore do not have an optimal length. Thus, although sarcomere length is commonly used in biomechanics studies, it is not ideal for the laryngeal system.
This study provided an important first step in quantifying the sensitivity of mechanical properties of laryngeal tissue to measurement errors resulting from small geometry. Because elastic properties are a major part of F0 prediction in phonation models, the Young’s modulus (obtained from the stress-strain) curve was the focus of this study. Muscle contractile properties are also sensitive to additional parameters such as the type of medium used, the pH concentration, and the elapsed time from extraction from the donor tissue. Future studies could also examine the effect of large strains, for which cross-sectional area would likely change significantly over the course of an elongation; the sensitivity of elastic moduli to true stress (using instantaneous cross-section) and true strain (for large elongations) may be of importance.
Acknowledgments
The authors would like to thank the research team at the National Center for Voice and Speech with many supporting roles in this work. Muscle data and previous analysis was collected with support from DC004347 (NIH/NIDCD) and with special thanks Sanyu Jaiswal and Megan Fuja for their help with the sample preparations. The analysis and modeling presented here were conducted as part of a research program entitled, “A Computational Tool for Simulation of Phonosurgical Proceedures”, also supported by the NIDCD (R03 DC006801). Thank you to Laura M. Hunter for the technical review.
MANUSCRIPT SUPPORTED BY: Muscle data was collected with support from DC004347 (NIH/NIDCD). The analysis and modeling presented here were conducted with support from DC006801 (NIH/NIDCD).
Reference List
- 1.Farley GR. A biomechanical laryngeal model of voice F-0 and glottal width control. J Acoust Soc Am. 1996 Dec;100(6):3794–3812. doi: 10.1121/1.417218. [DOI] [PubMed] [Google Scholar]
- 2.Hunter EJ, Titze IR, Alipour F. A three-dimensional model of vocal fold adduction/abduction. J Acoust Soc Am. 2004;115(4):1747–1759. doi: 10.1121/1.1652033. [DOI] [PMC free article] [PubMed] [Google Scholar]
- 3.Alipour F, Berry DA, Titze IR. A finite-element model of vocal-fold vibration. J Acoust Soc Am. 2000 Dec;108(6):3003–3012. doi: 10.1121/1.1324678. [DOI] [PubMed] [Google Scholar]
- 4.Berry DA, Titze IR. Normal modes in a continuum model of vocal fold tissues. J Acoust Soc Am. 1996 Nov;100(5):3345–3354. doi: 10.1121/1.416975. [DOI] [PubMed] [Google Scholar]
- 5.Dang J, Honda K. A physiologic model of a dynamic vocal tract for speech production. ATR Human Information Processing Research Laboratories. 1998 Technical report(43.70.Aj, 43.70.Bk) [Google Scholar]
- 6.Gunter HE. A mechanical model of vocal-fold collision with high spatial and temporal resolution. J Acoust Soc Am. 2003 Feb;113(2):994–1000. doi: 10.1121/1.1534100. [DOI] [PubMed] [Google Scholar]
- 7.Alipour F, Titze IR, Hunter EJ, Tayama N. Active and Passive Properties of Canine Abduction/Adduction Laryngeal Muscles. J Voice. 2005 doi: 10.1016/j.jvoice.2004.04.005. In press. [DOI] [PMC free article] [PubMed] [Google Scholar]
- 8.Alipour-Haghighi F, Titze IR. Elastic models of vocal fold tissues. J Acoust Soc Am. 1991 Sep;90(3):1326–1331. doi: 10.1121/1.401924. [DOI] [PubMed] [Google Scholar]
- 9.Heller MO, Bergmann G, Kassi JP, Claes L, Haas NP, Duda GN. Determination of muscle loading at the hip joint for use in pre-clinical testing. Journal of Biomechanics. 2005 May;38(5):1155–1163. doi: 10.1016/j.jbiomech.2004.05.022. [DOI] [PubMed] [Google Scholar]
- 10.Nagano A, Komura T, Fukashiro S, Himeno R. Force, work and power output of lower limb muscles during human maximal-effort countermovement jumping. Journal of Electromyography and Kinesiology. 2005 Aug;15(4):367–376. doi: 10.1016/j.jelekin.2004.12.006. [DOI] [PubMed] [Google Scholar]
- 11.Titze IR, Hunter EJ. Normal vibration frequencies of the vocal ligament. J Acoust Soc Am. 2004 May;115(5 Pt 1):2264–2269. doi: 10.1121/1.1698832. [DOI] [PMC free article] [PubMed] [Google Scholar]
- 12.Perlman AL. A technique for measuring the elastic properties of vocal fold tissue. University of Iowa; 1985. [DOI] [PubMed] [Google Scholar]
- 13.Perlman AL, Titze IR. Development of an in vitro technique for measuring elastic properties of vocal fold tissue. Journal of Speech and Hearing Research. 1988 Jun;31(2):288–298. doi: 10.1044/jshr.3102.288. [DOI] [PubMed] [Google Scholar]
- 14.Adeeb S, Ali A, Shrive N, Frank C, Smith D. Modelling the behaviour of ligaments: a technical note. Computer Methods in Biomechanics & Biomedical Engineering. 2004 Feb;7(1):33–42. doi: 10.1080/10255840310001637266. [DOI] [PubMed] [Google Scholar]
- 15.Taylor JR. An Introduction to Error Analysis: The Study of Uncertainties in Physical Measurements. 2. Sausalito: University Science Books; 1996. [Google Scholar]
- 16.Cox KA, Alipour F, Titze IR. Geometric structure of the human and canine cricothyroid and thyroarytenoid muscles for biomechanical applications. Ann Otol Rhinol Laryngol. 1999 Dec;108(12):1151–1158. doi: 10.1177/000348949910801210. [DOI] [PubMed] [Google Scholar]
- 17.Titze IR. On the Relation Between Subglottal Pressure and Fundamental-Frequency in Phonation. J Acoust Soc Am. 1989 Feb;85(2):901–906. doi: 10.1121/1.397562. [DOI] [PubMed] [Google Scholar]
- 18.Min YB, Titze IR, Alipour-Haghighi F. Stress-strain response of the human vocal ligament. Ann Otol Rhinol Laryngol. 1995 Jul;104(7):563–569. doi: 10.1177/000348949510400711. [DOI] [PubMed] [Google Scholar]