Supplemental Digital Content is available in the text
Abstract
The mutation status of cancer driver genes may correlate with different degrees of malignancy of cancers. The doubling time and multidrug resistance are 2 phenotypes that reflect the degree of malignancy of cancer cells. Because most of cancer driver genes are hard to target, identification of their synthetic lethal partners might be a viable approach to treatment of the cancers with the relevant mutations.
The genome-wide screening for synthetic lethal partners is costly and labor intensive. Thus, a computational approach facilitating identification of candidate genes for a focus synthetic lethal RNAi screening will accelerate novel anticancer drug discovery.
We used several publicly available cancer cell lines and tumor tissue genomic data in this study.
We compared the doubling time and multidrug resistance between the NCI-60 cell lines with mutations in some cancer driver genes and those without the mutations. We identified some candidate synthetic lethal genes to the cancer driver genes APC, KRAS, BRAF, PIK3CA, and TP53 by comparison of their gene phenotype values in cancer cell lines with the relevant mutations and wild-type background. Further, we experimentally validated some of the synthetic lethal relationships we predicted.
We reported that mutations in some cancer driver genes mutations in some cancer driver genes such as APC, KRAS, or PIK3CA might correlate with cancer proliferation or drug resistance. We identified 40, 21, 5, 43, and 18 potential synthetic lethal genes to APC, KRAS, BRAF, PIK3CA, and TP53, respectively. We found that some of the potential synthetic lethal genes show significantly higher expression in the cancers with mutations of their synthetic lethal partners and the wild-type counterparts. Further, our experiments confirmed several synthetic lethal relationships that are novel findings by our methods.
We experimentally validated a part of the synthetic lethal relationships we predicted. We plan to perform further experiments to validate the other synthetic lethal relationships predicted by this study.
Our computational methods achieve to identify candidate synthetic lethal partners to cancer driver genes for further experimental screening with multiple lines of evidences, and therefore contribute to development of anticancer drugs.
INTRODUCTION
Numerous studies have shown that gene mutations underlie the development of all types of cancers.1 Gene mutations occur in 2 ways: inherited from a parent (germline mutations) or acquired during a personal lifetime (somatic mutations). It was estimated that approximately 90% of cancer genes show somatic mutations and 20% show germline mutations.1 To investigate gene mutations in cancers and develop targeted anticancer drugs, human cancer cell lines are being widely used.2 For example, the National Cancer Institute's NCI-60 cell lines have been extensively characterized and frequently used as a screening tool for discovery of anticancer drugs.3 Based on the panel of NCI-60 cell lines, the frequently-mutant genes in cancers have been identified, such as APC, BRAF, CDKN2A, KRAS, PIK3CA, PTEN, TP53, etc.3,4 For the NCI-60 cell lines, the phenotypes such as doubling time (the period of time required for cell lines to double in size) and multidrug resistance (MDR) may indicate the degree of malignancy.5–8 With the gene mutation and cancer cell phenotypes information, an important question arises: to what degree the mutations of some genes correlate with high malignancy of cancers? In the present study, we initially investigate the correlation between gene mutations and cancers’ malignancy based on the gene mutation and malignancy phenotypes (doubling time and MDR) data for the NCI60 cell lines since so far such investigation is lacking.
RNAi screening is an approach that facilitates the systematic assessment of the effect of gene deregulation on cell phenotypes such as cell death.9 The RNAi screening technology can be used for identification of synthetic lethal partners. Two genes are synthetic lethal if dis-regulation of either alone does not result in cell death but dis-regulation of both leads to death of cells.10 Thus, abrogation of gene X that is synthetic lethal to gene Y should selectively kill Y-mutant cells and spare the cells without Y mutations. The synthetic lethality concept has been used for discovery of anticancer drugs, which may target some genes whose synthetic lethal partners are frequently mutated in cancers but are hardly druggable such as the tumor suppressor genes APC and TP53, or have severe drug resistance such as the oncogene KRAS and BRAF.11,12 The standard approach to systematical identification of synthetic lethal genes is based on genome-wide or kinome-wide RNAi screening.13 However, large-scale synthetic lethal RNAi screening strategy is laborious and time consuming. Its efficiency could be improved by first identifying differentially expressed genes between isogenically paired cell lines (hereafter refer to single gene mutant versus wild-type), and then performing a focused RNAi screening on the differentially expressed genes to examine their synthetic lethality to the mutant gene.7,8,12 Wang and Simon12 proposed a method to computationally prescreen synthetic lethal genes to p53 using gene expression profiles. They identified 98 kinase genes that are potential therapeutic targets for p53-mutant cancers. A limitation of that study is that the candidate synthetic lethal genes to p53 identified may harbor many false positives because their underlying presumption is not necessarily true that the gene expression difference is a result of altered gene mutation status.
RNAi screening uses a short interfering RNA (siRNA) to suppress expression of specific genes. The degree of suppression of the targeted gene is often highly variable due to on-target and off-target effects of siRNA.9 In (9) the authors proposed a computational method to quantify gene-specific suppression phenotype. They generate a per-gene value for each sample—gene phenotype value (GPV), quantifying the suppression effect for a specific gene in an individual cell line by siRNA reagents. Furthermore, the authors affirmed that the GPV reflects the degree of dependency of an individual cell line's viability on a specific gene, with a lower GPV representing high viability dependency of a cell line on the gene. If we perform the 2-class comparison between a group of cell lines with mutations of some gene and another group of cell lines without mutations of the gene, we could identify the genes with significantly lower GPVs in the mutant cell lines than in the wide-type cell lines. It means that the mutant cell lines have higher viability dependency on the identified genes than the wide-type cell lines. In the other words, the identified genes could be synthetic lethal to the mutant gene. On the basis of the approach, we identified the potential synthetic lethal genes to APC, KRAS, BRAF, PIK3CA, and TP53, respectively. Then we performed an examination of the literature to evaluate other evidence for the putative synthetic lethality relationships. Furthermore, we compared expression of the identified genes in between mutant cancer cells/tumor samples and wide type, and identified a portion of genes that show the significantly higher expression level in the mutant cancer cells/tumor samples. In addition, we examined the drug sensitivity differences between NCI-60 cell lines with gene mutations and NCI-60 cell lines without the mutations for the compounds that target the kinases encoded by the genes among the potential synthetic lethal genes identified. Finally, we performed experiments to validate some of the synthetic lethality relationships we computationally identified.
METHODS
Datesets
We obtained the NCI-60 cell lines’ phenotype data (doubling time and MDR) from the CellMiner database,6,14 and the gene mutation data of NCI-60 cancer cell lines from the publication4 (http://mct.aacrjournals.org/content/5/11/2606/T3.expansion.html). The GPVs for the 102 Achilles cancer cell lines are from the publication,9 whereas the gene mutation information for the 102 Achilles cancer cell lines is from the Cancer Cell Line Encyclopedia (CCLE) project.2 The microarray gene expression dataset for the 102 Achilles cancer cell lines is also from the CCLE project. The microarray gene expression dataset for the NCI-60 cell lines (Affymetrix U95A data from Novartis) is downloaded from the Developmental Therapeutics Program NCI/NIH website https://wiki.nci.nih.gov/display/NCIDTPdata/Molecular+Target+Data. We downloaded the RNA-Seq gene expression dataset for glioblastoma multiforme (GBM) and the microarray gene expression dataset for breast invasive carcinoma (BRCA) from the TCGA website https://tcga-data.nci.nih.gov/tcga/. All of the gene expression datasets were used for the gene differential expression analysis. Ethical approval was waived since we used only publicly available data and materials in this study.
Comparisons of Doubling Time and MDR Between Mutant and Wide-Type Cell Lines
We compared doubling time and MDR between the mutant NCI-60 cell lines and the wide-type NCI-60 cell lines using t-test statistics (1-sided, the hypothesis of less doubling time and stronger MDR in the mutant cell lines). We performed the class comparisons based on the mutant status of NCI-60 cell lines for genes APC, BRAF, CDKN2A, KRAS, PIK3CA, and PTEN, respectively. A detailed description of mutation status of these genes in each NCI-60 cell line is shown in the supplementary Table S1. The numbers of the mutant and wide-type NCI-60 cell lines used for the class comparisons are given in the supplementary Table S2.
Identification of Potential Synthetic Lethal Genes to APC, KRAS, BRAF, PIK3CA, and TP53
We first identified the genes with differential GPVs between the mutant cell lines and the wild-type cell lines among 102 Achilles cancer cell lines using the univariate t-test at a 2-sided significance level of 0.001. We also performed univariate permutation tests with 10,000 permutations of the class label (mutant or wide-type) to measure the significance of individual genes. The proportion of the permutations that gave a t-test P value as small as obtained with the true class labels was the univariate permutation P value for that gene. To adjust for multiple tests, we reported the false discovery rate (FDR) for each gene identified. The FDR was estimated using the method of Benjami and Hochberg.15 This procedure was implemented with the class comparison between groups of arrays tools in BRB-ArrayTools.16 We selected the genes that showed significantly lower relative GPVs in the mutant cell lines as the potential synthetic lethal genes to the mutant genes. This procedure was carried out for APC, KRAS, BRAF, PIK3CA, and TP53 mutation status in cell lines, respectively (we did not include CDKN2A and PTEN in the analysis because few cell lines have mutations of them in this dataset). A detailed description of mutation status of these genes in each Achilles cell line is shown in the supplementary Table S1. The numbers of the mutant and wide-type Achilles cancer cell lines used for the class comparisons are given in the supplementary Table S3.
Comparisons of Expression of the Potential Synthetic Lethal Genes in Mutant and Wide-Type Cancers
For the potential synthetic lethal genes identified, we compared their expression in between mutant and wide-type cell lines or tumors (Achilles cell lines, NCI-60 cell lines, and TCGA (the Cancer Genome Atlas) tumor samples, respectively) using t test. The numbers of samples in each class for Achilles cell lines and NCI-60 cell lines are shown in the supplementary Table S3 and Table S2, respectively. The numbers of samples in each class for the TCGA tumors are summarized in the supplementary Table S4. The significantly more highly expressed genes in mutant samples than in wide-type were identified (P value <0.05, fold change ≥1.2) and further analyzed.
Comparison of Drug Sensitivity Between 2 Groups of Cell Lines
We compared drug sensitivity (GI50) between the mutant NCI-60 cell lines and the wild-type NCI-60 cell lines using t-test statistics (1-sided, the hypothesis of higher sensitivity in the mutant cell lines). GI50 is the concentration required to inhibit growth of cancer cell lines by 50%. The lower GI50 value means higher drug sensitivity.
Cells and Reagents
Human cells from colorectal adenocarcinoma, LoVo, SW480, and SW620 were maintained in RPMI 1640 supplemented with 10% fetal bovine serum (FBS), 100 U/mL penicillin, and 0.1 mg/mL streptomycin. The human cells from glioblastoma, TP366, and LN229 cells, and hepatocellular carcinoma, HepG2, Hep3B, and Huh7 were maintained in DMEM with 10% FBS, 100 U/mL penicillin, and 0.1 mg/mL streptomycin. All the cells were kept in a humidified incubator at 37°C and a 5% CO2 atmosphere. The PD-0332991 and 68C091 were from Sigma (St. Louis, MD).
In Vitro Proliferation Assay
Experimental procedures for in vitro proliferation assay are as described in (5). Briefly, 3×10³ (for MTT assay) or 1 × 10³ (for CCK8 assay) cells were seeded in a 96-well plate in quadruplicate or in hepatuplicate. After 24 hours, different concentrations of drugs or vehicle were added with fresh medium. Cells were incubated at 37°C for 3 days followed by an MTT assay or as indicated time points followed by CCK8 assay. The experiments were repeated at least twice.
siRNA Knockdown
The scrambled siRNA and target-specific sequences synthesized by GenePharma (Shanghai, China) were as follows: siTDO2, 5’-AGU GAU AGG UAC AAG GUA UUU-3’; siCTNNB1#1, 5’-UUG UUA UCA GAG GAC UAA AUA-3’; siCTNNB1#2, 5’-UCU AAC CUC ACU UGC AAU AAU-3’; siCSNK1A1#1, 5’-GCA AGC UCU AUA AGA UUC UUC-3’; siCSNK1A#2, 5’-GCA GAA UUU GCG AUG UAC UUA-3’. Cells were transfected with siRNA using Lipofectamine 2000 (Invitrogen, Boston, MA) according to the manufacturer's instruction. After 36 hours, the transfected cells were split into 6-well plates for knockdown confirmation and 96-well plates for cell proliferation examination.
RNA Extraction and RT-PCR
Total RNA was isolated from various cell lines using the TRIzol reagent (Invitrogen, Boston, MA). Two micrograms of RNA was transcribed into complementary DNA by PrimeScript (TaKaRa) in 20 μL, and 0.2 μL was subjected to RT-PCR. The condition for PCR was 25 cycles (except 35 cycles for TDO2) of denaturation (94°C/15 s), annealing (55°C/15 s), and extension (72°C/30 s), and 1 cycle of final extension (72°C/5 min). Glyceraldehyde-3-phosphate dehydrogenase (GAPDH) was used as an internal control. The amplified PCR products were separated by electrophoresis on a 2.5% agar gel containing ethidium bromide. PCR primers (TDO2 forward, 5′-AAGGTTGTTTCTCGGATGCAC-3′; TDO2 reverse, 5′-TGTCATCGTCTCCAGAATGGAA-3′; CSNK1A1 forward, 5′-AGTGGCAGTGAAGCTAGAATCT-3′; CSNK1A1 reverse, 5′-CGCCCAATACCCATTAGGAAGTT-3′; CTNNB1 forward, 5′-CATCTACACAGTTTGATGCTGCT-3′; CTNNB1 reverse, 5′-GCAGTTTTGTCAGTTCAGGGA-3′; GAPDH forward, 5′-GAAGGTGAAGGTCGGAGTC-3′; GAPDH reverse, 5′-GAAGATGGTGATGGGATTTC-3′) were synthesized by Sangon (Shanghai, China).
RESULTS
Identification of the Cancer Driver Genes Whose Mutations May Correlate With Proliferation or Drug Resistance of Cancers
We compared doubling time and MDR between the mutant and wild-type NCI-60 cell lines and found that the mutant cell lines have less doubling time or stronger MDR than the wild-type cell lines in terms of several cancer driver genes’ mutations (Table 1). For example, the APC or KRAS mutant cell lines show less doubling time than the wild-type (P value <0.05), and the PIK3CA mutant cell lines show stronger MDR than the wild-type (P value = 0.034). Moreover, for mutations of APC, KRAS, and PIK3CA, the less doubling time may likely correlate with stronger MDR (Table 1). In fact, the correlation coefficient (Pearson) between doubling time and MDR is −0.09 for all the cell lines, but −0.27, −0.27, and −0.25 for APC, KRAS, and PIK3CA mutant cell lines, respectively.
TABLE 1.
Comparisons of Doubling Time and MDR Between Mutant and Wide-Type Cell Lines
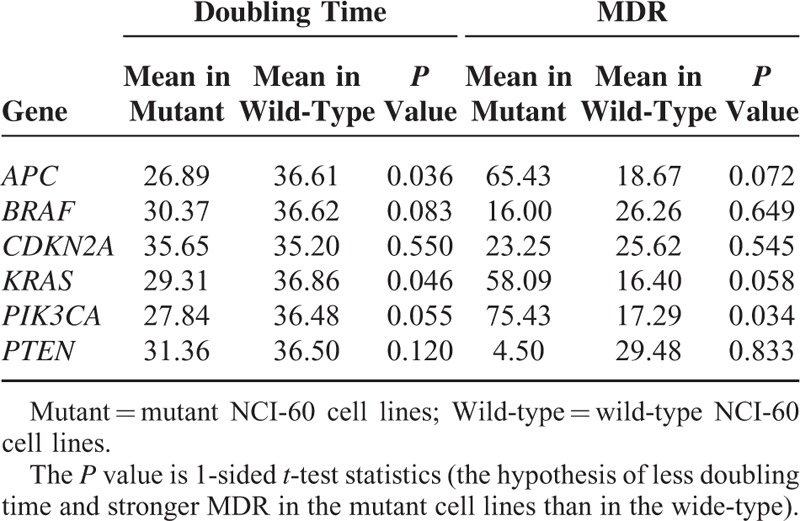
As less doubling time implies faster proliferation rate, the mutation of APC or KRAS may lead to enhanced malignancy of cancers. On the other hand, as stronger MDR implies severer drug resistance of cancer cell lines, the mutation of PIK3CA may confer stronger drug resistance. This is in line with a recent study that revealed that PIK3CA mutations may confer resistance in Her2-positive breast cancer.17
Identification of Potential Synthetic Lethal Genes to APC, KRAS, BRAF, PIK3CA, and TP53
To develop rational novel drugs targeting the cancers with mutations of the cancer diver genes, we applied the computational approach to identify 40, 21, 5, 43, and 18 potential synthetic lethal genes to APC, KRAS, BRAF, PIK3CA, and TP53, respectively. Table 2 lists all of these genes. The results of statistical tests including parametric P value, FDR, and permutation P value for each gene identified are shown in the supplementary Table S5.
TABLE 2.
Potential Synthetic Lethal Genes Identified
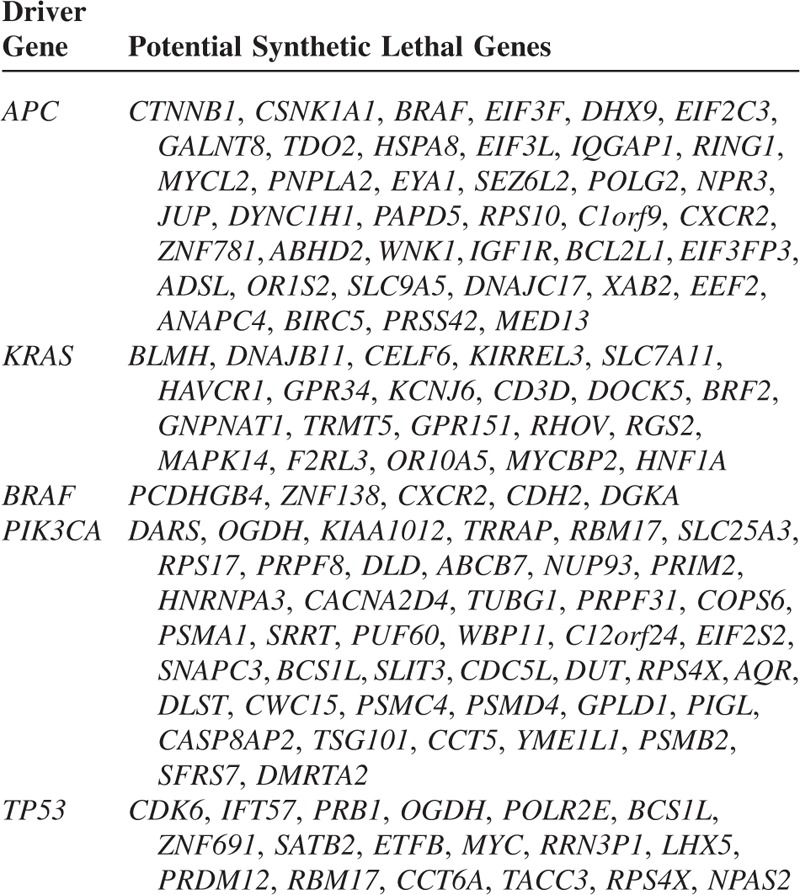
Interestingly, our results include many synthetic lethal interactions that have been proved by previous studies. For example, JUP18 and IGF1R19 have been experimentally proved to interact with APC. IGF1R has been shown to interact with APC indirectly via regulation of the E-cadherin/b-catenin complex.19DOCK5, RGS2, and F2RL3 have been verified to be synthetic lethal to KRAS by Lou et al through a genome-wide RNAi screening.20KCNJ6 is another synthetic lethal gene to KRAS as identified in21.
Among the potential synthetic lethal genes to TP53 we identified (Table 2), TACC3 was found to be synthetic lethal to TP53 by Krastev et al's standard RNAi screening.22 Another important candidate of synthetic lethal genes to TP53 we identified is the oncogene MYC. MYC codes for a transcription factor that regulates the expression of many genes. Its mutations have been found in many cancers.23 Many studies have shown that p53 can repress MYC's expression and TP53 mutant cancers may depend on upregulation of MYC.24,25 These evidences support our inference that there may exist a synthetic lethality relationship between TP53 and MYC.
Identification of Highly Expressed Genes in Mutant Cancer Cell Lines Among the Potential Synthetic Lethal Genes
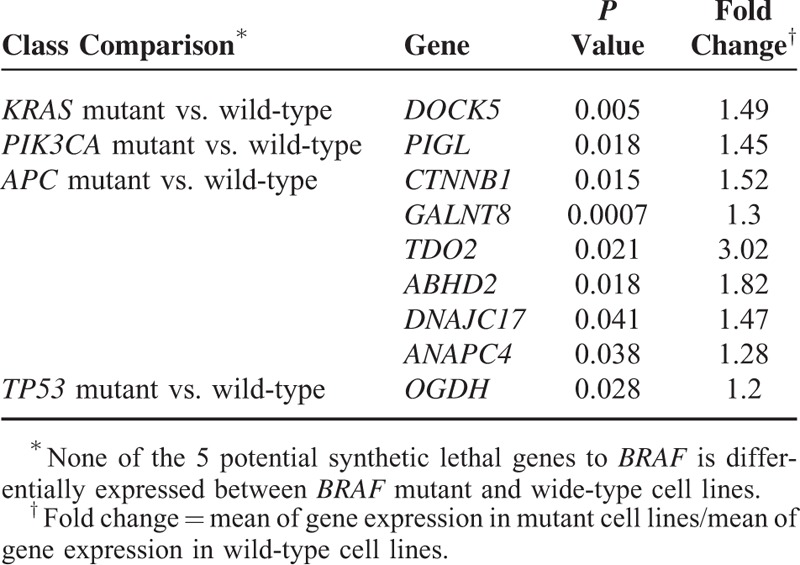
It would be not unexpected that the viability of cancer cells likely depends on hyperactivation of oncogenes. Thus, we speculate that the highly expressed genes in cancer cells with gene mutations could be synthetic lethal to the mutant genes. There are a portion of potential synthetic lethal genes identified showing significantly higher expression in the mutant Achilles cell lines than in the wide-type (P value <0.05). These genes include DOCK5, PIGL, CTNNB1, GALNT8, TDO2, ABHD2, DNAJC17, ANAPC4, and OGDH (Table 3), which might be potential therapeutic targets for the cancers with related mutations. For example, the gene CTNNB1 has more than 1.5-fold higher expression in the APC mutant cell lines than in the APC wide-type cell lines, raising the possibility that the viability of APC mutant cancer cells might depend on CTNNB1's expression. However, together with further experimental validation, we may conclude that anticancer drugs that inhibit the expression of CTNNB1 might be useful in treating APC mutant cancers. Strikingly, TDO2 has more than 3-fold higher expression in the APC mutant cell lines than in the APC wide-type cell lines, indicative of the possibility of high dependence of APC mutant cancer cells on its expression.
TABLE 3.
Highly Activated Genes in Mutant Achilles Cell Lines
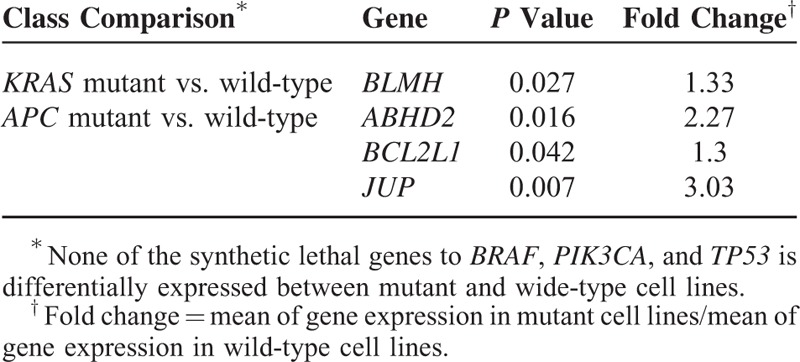
We also identified several genes that show significantly higher expression in the mutant NCI-60 cell lines than in the wide-type (P value <0.05). These genes include BLMH, ABHD2, BCL2L1, and JUP (Table 4). These genes encode proteins that are involved in oncogenesis or have unknown function.26,27 Among them, ABHD2 is also highly expressed in the APC mutant Achilles cell lines. This gene encodes a protein containing a catalytic domain found in a wide range of enzymes. The function of this protein has not been determined. Our results suggest that this gene could be synthetic lethal to APC since it has lower GPVs, and is highly expressed in the APC mutant cancer cell lines. JUP encodes a cytoplasmic protein that belongs to the catenin family whose members actively interact with APC.28BLMH encodes a cytoplasmic cysteine peptidase that metabolically inactivates the glycopeptide bleomycin, an essential component of combination chemotherapy regimens for cancer.29 Our results suggest that this gene could be synthetic lethal to KRAS and is a potential therapeutic target for KRAS mutant cancers.
TABLE 4.
Highly Activated Genes in Mutant NCI-60 Cell Lines
Identification of Highly Expressed Genes in Mutant Tumors Among the Potential Synthetic Lethal Genes
We also compared the expression of the synthetic lethal genes identified in between mutant and wide-type tumor samples from TCGA. Due to a small proportion of samples with KRAS, BRAF, PIK3CA, and APC mutations annotated in the GBM dataset, we only compared the gene expression difference between TP53 mutant and wide-type GBMs. Similarly, due to a small proportion of samples with KRAS, BRAF, and APC mutations annotated in the BRCA dataset, we compared the gene expression difference between TP53 mutant and wide-type BRCAs, and between PIK3CA mutant and wide-type BRCAs. Table 5 presents the significantly more highly expressed genes in the mutant tumors than in the wide-type (P value <0.05).
TABLE 5.
Highly Activated Genes in Mutant Tumors
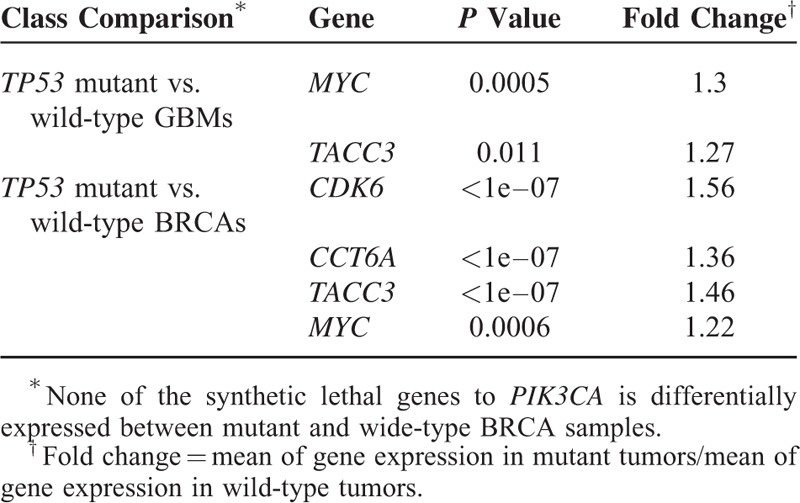
Table 5 shows that TACC3 and MYC are much more highly expressed in TP53 mutant GBMs and TP53 mutant BRCAs compared with respective wide-types. This result indicates that TP53 mutant cancer cells could rely on the high expression of TACC3 or MYC for survival, predicting the synthetic lethality relationship between TACC3 and TP53, and between MYC and TP53. The other highly expressed genes in TP53 mutant BRCAs include CDK6 and CCT6A which are likely to be synthetic lethal to TP53 (Table 5). Among them, CDK6 encodes a member of the cyclin-dependent protein kinase (CDK) family. This gene has been found to be upregulated in several types of cancers.30,31
Identification of the Potential Synthetic Lethal Genes That Encode Kinases
Discovery of cancer-related kinases and development of kinase inhibitors have been an active research field of cancer biology. Currently, kinase inhibitors are among the key class of anticancer drugs.32 Among the potential synthetic lethal genes we identified, some encode kinases as shown in Table 6. Some clinically approved or experimentally active compounds that can inhibit these kinases are also presented in Table 6. These compounds may be effective in treating the cancers with mutations in synthetic lethal partners of the kinase genes.
TABLE 6.
Potential Synthetic Lethal Kinase-Encoding Genes Identified
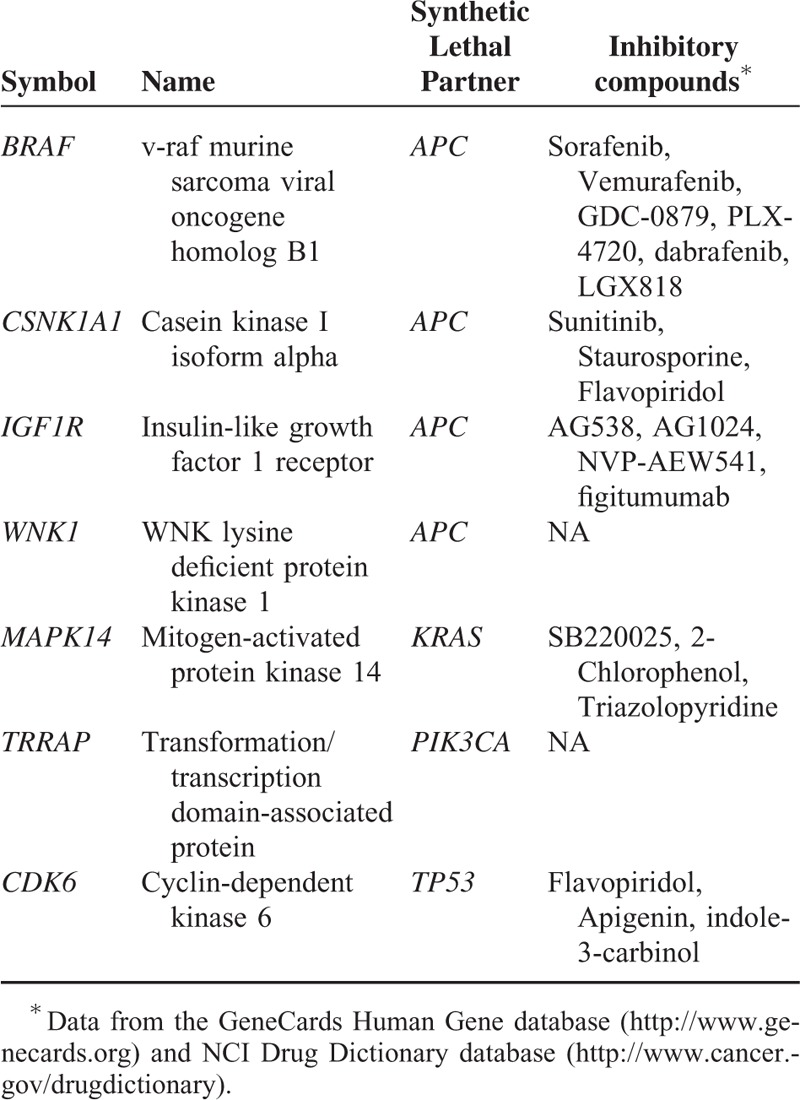
For some of the compounds whose GI50 values against NCI-60 cell lines are available in the National Cancer Institute's developmental therapeutics program (DTP) database website http://dtp.nci.nih.gov/dtpstandard/dwindex/index.jsp, we compared their drug sensitivity (GI50) between the cell lines with mutations in their synthetic lethal partners and the cell lines without such mutations using t-test statistics (1-sided, the hypothesis of higher sensitivity in the mutant cell lines). Although few of the drug sensitivity differences were statistically significant (the statistical power of the comparison was limited by the number of cell lines with mutations and compounds collected), the compound sunitinib targeting the kinase CSNK1A1 shows higher sensitivity in the APC mutant cell lines than in the APC wide-type cell lines (P value = 0.0028), indicating that there exists a synthetic lethality relationship between CSNK1A1 and APC.
CDK4/6 Inhibitor PD-0332991 Selectively Inhibited Proliferation of TP53 Mutant Cells
In addition to several aforementioned computational evidences, to validate the synthetic lethal interaction between TP53 and CDK4/6, we treated the TP53 wild-type cells TP366, as well as TP53 mutant cells LN229, with the inhibitor of CDK4/6 PD-0332991. We found that PD-0332991 had less effect on the proliferation of TP366 cells with wild-type TP53, but induced greater proliferation reduction in LN229 cells with mutant TP53 (Figure 1A and B). This indicates that synthetic lethal effects may exist between TP53 and CDK4/6. Furthermore, we also checked hepatocellular carcinoma cell lines with or without TP53 mutation with different concentrations of PD-0332991. PD-0332991 had stronger antiproliferation effects at Hep3B (TP53 deficient) and Huh7 (TP53 mutant) cells, compared with HepG2 with wild-type TP53 (Figure 1C and D). In these experiments, we observed significant synthetic lethality between TP53 and CDK4/6.
FIGURE 1.
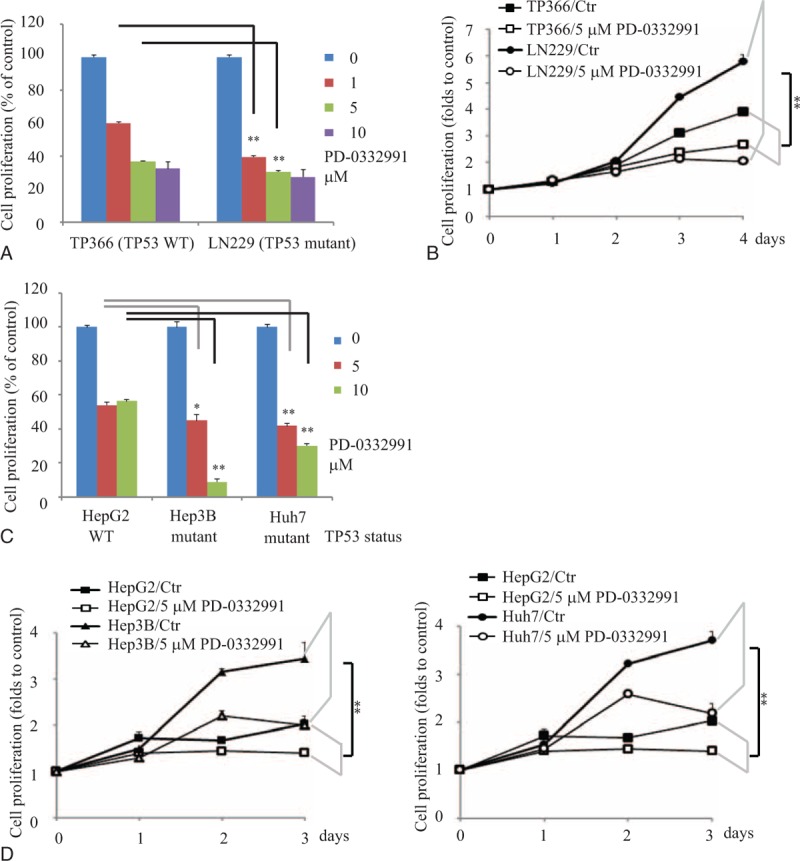
PD-0332991 selectively inhibited proliferation of TP53 mutant cells. A, Glioblastoma TP366 and LN229 cells were treated with different concentrations of PD-033991 for 3 days followed by MTT assay. B, Glioblastoma TP366 and LN229 cells were treated with 5 μM PD-033991 for indicated time points followed by CCK8 assay. C, Hepatocellular carcinoma HepG2, Hep3B, and Huh7 cells were treated with indicated concentrations of PD-033991 for 3 days followed by MTT assay. D, Hepatocellular carcinoma HepG2, Hep3B, and Huh7 cells were treated with 5 μM PD-033991 for indicated time points followed by CCK8 assay. Data were expressed as mean ± S.E. ∗, P < 0.05; ∗∗, P < 0.01 (n = 4 or 6, the experiments were repeated at least twice).
Synthetic Lethal Interactions Between TDO2, CTNNB1, CSNK1A1, and APC
To validate the predicted synthetic lethal partners of APC, including TDO2, CTNNB1, and CSNK1A1 in Table 2, we applied siRNA to knock down each of them at both APC wild-type cell SW480 and APC mutant cell SW620. Compared with the scrambled siRNA, 2 of the CTNNB1, CSNK1A1, and 1 of the TDO2 siRNAs had significant enhanced inhibition on the proliferation of SW620 cells compared with SW480 cells (Figure 2A). We also monitored the growth curves of SW480 and SW620 after knocking down TDO2, CTNNB1, and CSNK1A1, respectively and observed that the TDO2, CTNNB1, and CSNK1A1 siRNA strongly inhibit the growth of SW620 cells and slightly inhibit the growth of SW480 (Figure 2B). The siRNA knockdown efficiency was validated by RT-PCR (Figure 2C). To further check if there is a synthetic lethal interaction between APC and TDO2, APC wild-type cells SW480 and mutant cells SW620 and LoVo were treated with TDO2 inhibitor 680C91. We observed that high concentrations of 680C91 (25–50 μM) led to significant decrease of cell proliferation for APC mutant cells SW620 and LoVo compared with APC wild-type cells SW480 (Figure 2D and E). These results suggest that there are synthetic lethal effects between TDO2, CTNNB1, CSNK1A1, and APC, respectively.
FIGURE 2.
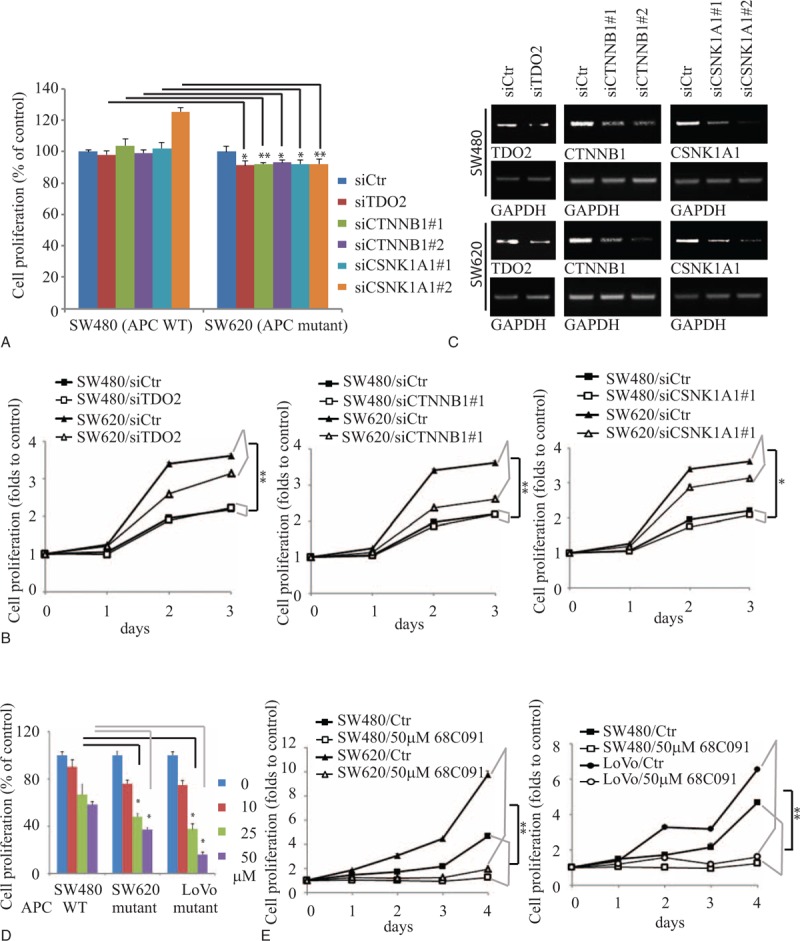
TDO2, CTNNB1, and CSNK1A1 were validated as synthetic lethal to APC. A, B, Knockdown of TDO2, CTNNB1, or CSNK1A1 inhibited the proliferation of APC mutant cells SW620, not APC wild-type cells SW480. SW480, and SW620 cells were transiently transfected with control siRNA or siTDO2, siCTNNB1, and siCSNK1A1 for 3 days or indicated time points followed by MTT assay or CCK8 assay. C, The siRNA knockdown effects were confirmed by RT-PCR. D, E, 680C91 selectively inhibited proliferation of APC mutant cells. Colorectal adenocarcinoma SW480, SW620, and LoVo cells were treated with indicated concentrations of 680C91 for 3 days followed by MTT assay (D) or treated with 50 μM 680C91 for indicated time points followed by CCK8 assay (E). Data were expressed as mean ± S.E. ∗, P < 0.05; ∗∗, P < 0.01 (n≥4, the experiments were repeated at least twice).
DISCUSSION
In this study, we explored malignancy of cancers and synthetic lethal interactions relevant to the cancer driver genes based on publicly available gene mutation information in cancer cell lines and tumors with the computational approach. By comparisons of doubling time and MDR between the mutant and wild-type NCI-60 cell lines, we revealed that mutations of APC, KRAS, and PIK3CA might correlate with enhanced malignancy of cancer cells.
Ideally, anticancer drugs can selectively kill cancer cells but spare normal cells. Discovery of such drug targets is essential to develop effective anticancer drugs. Such targets are defined as cancer-specific vulnerabilities or as synthetic lethal interactions with cancer-related genetic mutations.33 The search for synthetic lethal partners for the genes that are frequently mutated in cancers but dodge drug inhibition has become a focus in cancer biology.
Based on the GPV concept, we identified a list of potential synthetic lethal genes to APC, KRAS, BRAF, PIK3CA, and TP53 which are frequently mutated in cancers and are hardly druggable. Literature survey shows that some of the synthetic lethal relationships we predicted such as TP53 and TACC3, DOCK5 and KRAS, RGS2 and KRAS, and F2RL3 and KRAS have been experimentally verified to be authentic, indicating a certain rationality of our methods.
Our results show that the mean of CTNNB1's GPVs in the APC mutant cell lines is 20% of that in the APC wild-type cell lines (P value <10–7), and CTNNB1 has significantly higher level of expression in APC mutant cancer cell lines than in wide-type cell lines (P value = 0.015, fold-change = 1.52). These computational results strongly indicate that the APC mutant cell lines might depend on the CTNNB1 gene for survival much more than the APC wild-type cell lines and therefore there may exist a synthetic lethal relationship between CTNNB1 and APC. Indeed, our experiments verified the synthetic lethal relationship between them. CTNNB1 has been shown to play an important role in regulation of cell adhesion and gene transcription, and its deregulation has been associated with many cancers.34 Thus, CTNNB1 inhibitors are useful in treatment of many cancers including APC mutant cancers. Another gene TDO2 has significant lower GPVs in the APC mutant cell lines than in wide-type cell lines (P value <10–4), and significantly higher level of expression in APC mutant cancer cell lines than in wide-type cell lines (P value = 0.021, fold-change = 3.02). Our experiments also verified the synthetic lethal relationship between TDO2 and APC to be true. TDO2 encodes a protein that may play a role in cancer through the suppression of antitumor immune responses.35 Thus, the associations of APC, TDO2 and antitumor immune responses are worthy to be further investigated since cancer immunotherapy could be a fundamental breakthrough in cancer treatment.36CDK6 has significant lower GPVs in the TP53 mutant cell lines than in wide-type cell lines (P value <10–4), and significantly higher level of expression in TP53 mutant cancer cell lines than in wide-type cell lines (P value <10–7, fold-change = 1.56). Again, our experiments confirmed the synthetic lethal relationship between CDK6 and TP53.
In this study, we found that only a small portion of the potential synthetic lethal genes we computationally identified showed significantly higher expression in the mutant cell lines or tumors. There are several reasons to explain this result: first, sample sizes of the cell lines and the GBM tumors are relatively small; second, only 2 types of tumors were examined (if we examine many other tumor types, we may find much more of the potential synthetic lethal genes with higher expression in mutant than in wild-type tumors); third, the synthetic lethal interaction does not necessarily mean the expression difference between mutant and wild-type tumors. Here, we present the highly expressed genes in mutant cell lines or tumors to show that these genes are more likely to have synthetic lethal interactions with the cancer driver genes. However, we cannot exclude the synthetic lethal relationships for the genes which do not show significantly higher expression in the mutant cell lines or tumors relative to the wild-type counterparts. The synthetic lethal relationships need to be validated by experiments finally.
Furthermore, we selected some pairs of the synthetic lethal genes we computationally identified to perform experimental validation. Our experiments verified 4 genes to be truly synthetic lethal to the cancer driver genes including CDK6 (with TP53), TDO2, CTNNB1, and CSNK1A1 (with APC). Interestingly, 3 of them (CDK6, TDO2, and CTNNB1) show significantly higher expression in the tumors or cell lines with mutations of their synthetic lethal partners than in those without such mutations. In addition, 2 of them (CDK6 and CSNK1A1) encode kinases for which small molecule inhibitors may be utilized to treat tumors with mutations of their synthetic lethal partners (TP53 or APC).
The concept of RNAi synthetic lethality screening can be extended to drug synthetic lethality screening. It is known that single-agent targeted therapy is often in-efficacious or prune to relapse due to drug resistance caused by other genes’ mutations and bypassing the cell signaling pathway targeted by such single-agent at a system level. If we can find drug combinations that target these synthetic lethal partners simultaneously, we could repropose some drugs on personal precise medicine to obtain therapeutic solution to drug resistance.
Supplementary Material
Footnotes
Abbreviations: BRCA = breast invasive carcinoma, CCLE = Cancer Cell Line Encyclopedia, CDK = cyclin-dependent protein kinase, DTP = developmental therapeutics program, FBS = fetal bovine serum, FDR = false discovery rate, GAPDH = glyceraldehyde-3-phosphate dehydrogenase, GBM = glioblastoma multiforme, GPV = gene phenotype value, MDR = multidrug resistance, PI3Ks = phosphoinositide 3-kinases, siRNA = short interfering RNA, TCGA = the Cancer Genome Atlas.
All authors read and approved the final manuscript.
XW and YZ are equal contributors. This work was supported by the startup funds to XW from the China Pharmaceutical University, and National Natural Science Foundation of China to K-YH (81402950) and Z-GH (81472621) and Shanghai Pujiang Program (14PJ1404700) to K-YH.
The authors have no conflicts of interest to disclose.
REFERENCES
- 1.Futreal PA, Coin L, Marshall M, et al. A census of human cancer genes. Nat Rev Cancer 2004; 4:177–183. [DOI] [PMC free article] [PubMed] [Google Scholar]
- 2.Barretina J, Caponigro G, Stransky N, et al. The cancer cell line encyclopedia enables predictive modelling of anticancer drug sensitivity. Nature 2012; 483:603–607. [DOI] [PMC free article] [PubMed] [Google Scholar]
- 3.Abaan OD, Polley EC, Davis SR, et al. The exomes of the NCI-60 panel: a genomic resource for cancer biology and systems pharmacology. Cancer Res 2013; 73:4372–4382. [DOI] [PMC free article] [PubMed] [Google Scholar]
- 4.Ikediobi ON, Davies H, Bignell G, et al. Mutation analysis of 24 known cancer genes in the NCI-60 cell line set. Mol Cancer Ther 2006; 5:2606–2612. [DOI] [PMC free article] [PubMed] [Google Scholar]
- 5.Revel MP. Avoiding overdiagnosis in lung cancer screening: the volume doubling time strategy. Eur Respir J 2013; 42:1459–1463. [DOI] [PubMed] [Google Scholar]
- 6.Mohamed Hoesein FAA, de Jong PA, Mets OM. Optimizing lung cancer screening: nodule size, volume doubling time, morphology and evaluation of other diseases. Ann Transl Med 2015; 3:19. [DOI] [PMC free article] [PubMed] [Google Scholar]
- 7.Lee JS, Paull K, Alvarez M, et al. Rhodamine efflux patterns predict P-glycoprotein substrates in the National Cancer Institute drug screen. Mol Pharmacol 1994; 46:627–638. [PubMed] [Google Scholar]
- 8.Moitra K. Overcoming multidrug resistance in cancer stem cells. BioMed Res Int 2015; 2015:635745. [DOI] [PMC free article] [PubMed] [Google Scholar]
- 9.Shao DD, Tsherniak A, Gopal S, et al. ATARiS: computational quantification of gene suppression phenotypes from multisample RNAi screens. Genome Res 2013; 23:665–678. [DOI] [PMC free article] [PubMed] [Google Scholar]
- 10.Kaelin WG., Jr The concept of synthetic lethality in the context of anticancer therapy. Nat Rev Cancer 2005; 5:689–698. [DOI] [PubMed] [Google Scholar]
- 11.McLornan DP, List A, Mufti GJ. Applying synthetic lethality for the selective targeting of cancer. N Engl J Med 2014; 371:1725–1735. [DOI] [PubMed] [Google Scholar]
- 12.Wang X, Simon R. Identification of potential synthetic lethal genes to p53 using a computational biology approach. BMC Med Genomics 2013; 6:30. [DOI] [PMC free article] [PubMed] [Google Scholar]
- 13.Canaani D. Methodological approaches in application of synthetic lethality screening towards anticancer therapy. Br J Cancer 2009; 100:1213–1218. [DOI] [PMC free article] [PubMed] [Google Scholar]
- 14.Reinhold WC, Sunshine M, Liu H, et al. CellMiner: a web-based suite of genomic and pharmacologic tools to explore transcript and drug patterns in the NCI-60 cell line set. Cancer Res 2012; 72:3499–3511. [DOI] [PMC free article] [PubMed] [Google Scholar]
- 15.Benjami Y, Hochberg Y. Controlling the false discovery rate: a practical and powerful approach to multiple testing. J Roy Statist Soc B 1995; 57:289–300. [Google Scholar]
- 16.Simon R, Lam A, Li M-C, et al. Analysis of gene expression data using BRB-array tools. Cancer Inform 2007; 3:11–17. [PMC free article] [PubMed] [Google Scholar]
- 17.Guarneri V, Dieci MV, Frassoldati A, et al. Prospective biomarker analysis of the randomized CHER-LOB study evaluating the dual anti-HER2 treatment with trastuzumab and lapatinib plus chemotherapy as neoadjuvant therapy for HER2-positive breast cancer. Oncologist 2015; 20:1001–1010. [DOI] [PMC free article] [PubMed] [Google Scholar]
- 18.Shibata T, Gotoh M, Ochiai A, et al. Association of plakoglobin with APC, a tumor suppressor gene product, and its regulation by tyrosine phosphorylation. Biochem Biophys Res Commun 1994; 203:519–522. [DOI] [PubMed] [Google Scholar]
- 19.Playford MP, Bicknell D, Bodmer WF, et al. Insulin-like growth factor 1 regulates the location, stability, and transcriptional activity of beta-catenin. Proc Natl Acad Sci U S A 2000; 97:12103–12108. [DOI] [PMC free article] [PubMed] [Google Scholar]
- 20.Luo J, Emanuele MJ, Li D, et al. A genome-wide RNAi screen identifies multiple synthetic lethal interactions with the Ras oncogene. Cell 2009; 137:835–848. [DOI] [PMC free article] [PubMed] [Google Scholar]
- 21.Steckel M, Molina-Arcas M, Weigelt B, et al. Determination of synthetic lethal interactions in KRAS oncogene-dependent cancer cells reveals novel therapeutic targeting strategies. Cell Res 2012; 22:1227–1245. [DOI] [PMC free article] [PubMed] [Google Scholar]
- 22.Krastev DB, Slabicki M, Paszkowski-Rogacz M, et al. A systematic RNAi synthetic interaction screen reveals a link between p53 and snoRNP assembly. Nat Cell Biol 2011; 13:809–818. [DOI] [PubMed] [Google Scholar]
- 23.Dang CV. MYC on the path to cancer. Cell 2012; 149:22–35. [DOI] [PMC free article] [PubMed] [Google Scholar]
- 24.Ho JS, Ma W, Mao DY, et al. p53-Dependent transcriptional repression of c-myc is required for G1 cell cycle arrest. Mol Cell Biol 2005; 25:7423–7431. [DOI] [PMC free article] [PubMed] [Google Scholar]
- 25.Aguda BD, Kim Y, Kim HS, et al. Qualitative network modeling of the Myc-p53 control system of cell proliferation and differentiation. Biophys J 2011; 101:2082–2091. [DOI] [PMC free article] [PubMed] [Google Scholar]
- 26.Xie M, Park D, You S, et al. Bcl2 inhibits recruitment of Mre11 complex to DNA double-strand breaks in response to high-linear energy transfer radiation. Nucleic Acids Res 2015; 43:960–972. [DOI] [PMC free article] [PubMed] [Google Scholar]
- 27.Xie M, Doetsch PW, Deng X. Bcl2 inhibition of mitochondrial DNA repair. BMC Cancer 2015; 15:586. [DOI] [PMC free article] [PubMed] [Google Scholar]
- 28.Su LK, Vogelstein B, Kinzler KW. Association of the APC tumor suppressor protein with catenins. Science 1993; 262:1734–1737. [DOI] [PubMed] [Google Scholar]
- 29.de Haas EC, Zwart N, Meijer C, et al. Variation in bleomycin hydrolase gene is associated with reduced survival after chemotherapy for testicular germ cell cancer. J Clin Oncol 2008; 26:1817–1823. [DOI] [PubMed] [Google Scholar]
- 30.Tsai JW, Li CF, Kao YC, et al. Recurrent amplification at 7q21.2 Targets CDK6 gene in primary myxofibrosarcomas and identifies CDK6 overexpression as an independent adverse prognosticator. Ann Surg Oncol 2012; 19:2716–2725. [DOI] [PubMed] [Google Scholar]
- 31.Giessrigl B, Schmidt WM, Kalipciyan M, et al. Fulvestrant induces resistance by modulating GPER and CDK6 expression: implication of methyltransferases, deacetylases and the hSWI/SNF chromatin remodelling complex. Br J Cancer 2013; 109:2751–2762. [DOI] [PMC free article] [PubMed] [Google Scholar]
- 32.McDermott U, Sharma SV, Dowell L, et al. Identification of genotype-correlated sensitivity to selective kinase inhibitors by using high-throughput tumor cell line profiling. Proc Natl Acad Sci U S A 2007; 104:19936–19941. [DOI] [PMC free article] [PubMed] [Google Scholar]
- 33.Kuiken HJ, Beijersbergen RL. Exploration of synthetic lethal interactions as cancer drug targets. Future Oncol 2010; 6:1789–1802. [DOI] [PubMed] [Google Scholar]
- 34.Morin PJ. Beta-catenin signaling and cancer. Bioessays 1999; 21:1021–1030. [DOI] [PubMed] [Google Scholar]
- 35.Pilotte L, Larrieu P, Stroobant V, et al. Reversal of tumoral immune resistance by inhibition of tryptophan 2,3-dioxygenase. Proc Natl Acad Sci U S A 2012; 109:2497–2502. [DOI] [PMC free article] [PubMed] [Google Scholar]
- 36.Miller JF, Sadelain M. The journey from discoveries in fundamental immunology to cancer immunotherapy. Cancer Cell 2015; 27:439–449. [DOI] [PubMed] [Google Scholar]
Associated Data
This section collects any data citations, data availability statements, or supplementary materials included in this article.


