

Abstract
BACKGROUND
Recent canines studies have shown that iron deposition within chronic myocardial infarction (CMI) influences the electrical behavior of the heart. To date, the link between the iron deposition and malignant ventricular arrhythmias (mVA) in humans with CMI is unknown.
METHODS AND RESULTS
CMI patients (n=94) who underwent late-gadolinium-enhanced CMR prior to ICD implantation for primary and secondary prevention were retrospectively analyzed. The predictive values of hypointense cores (HIC) in balanced steady-state free precession (bSSFP) images and conventional CMR and ECG mVA parameters for the prediction of primary combined outcome (appropriate ICD therapy, survived cardiac arrest or sudden cardiac death) were studied. The use of HIC within CMI on bSSFP as a marker of iron deposition was validated in a canine MI model (n=18). Nineteen patients met the study criteria with events occurring at a median of 249 (interquartile range (IQR) of 540) days after ICD placement. Of the 19 patients meeting the primary endpoint, 18 were classified as HIC+, while only 1 was HIC−. Among the cohort in whom the primary endpoint was not met, there were 28 HIC+ and 47 HIC− patients. ROC analysis demonstrated an additive predictive value of HIC for mVAs with an increased AUC to 0.87 when added to LVEF (LVEF alone 0.68). Both CMR and histological validation studies performed in canines demonstrated that HIC regions in bSSFP images within CMI likely result from iron depositions.
CONCLUSIONS
Hypointense cores within CMI on bSSFP CMR can be used as a marker of iron deposition and yields incremental information toward improved prediction of mVA.
Keywords: cardiac magnetic resonance imaging, implanted cardioverter defibrillator, myocardial infarction, ventricular tachycardia, ventricular fibrillation
Sudden cardiac arrest (SCA) is a major public health problem in the United States accounting for 50% of all deaths due to cardiovascular conditions1-5. Approximately 80% of patients dying of SCA have underlying coronary heart disease and chronic myocardial infarction (CMI) is present in >50%6. In the majority of cases, SCA in patients with CMI patients is triggered by the onset of malignant ventricular arrhythmias (mVA)7, 8. The implantable cardioverter-defibrillator (ICD) has been instrumental in the primary prevention of SCD 9-11, however, the accurate identification of patients at greatest risk for SCA remains challenging. 12-14
Current guidelines for the primary prevention of SCD recommend the prescription of ICDs for patients with severely reduced left ventricular ejection fraction (LVEF<35%)15. However, only 20-30% of these patients have been shown to benefit from this therapy; the remaining 70-80% not experiencing mVA16, 17. Moreover, of those experiencing SCA, at least 65% were not eligible for primary prevention ICD, as they did not have a conventional risk predictor (LVEF<35%)18, 19. Hence there is a critical need to develop and validate novel approaches for ventricular arrhythmia risk prediction incremental to the assessment of left ventricular function. To date, a number of risk predictors have been explored; including, infarct size, type of infarction, infarct transmurality, gray-/border-zone signal, surviving bundles, and surface ECG parameters. While these have demonstrated value for the prediction of mVA over conventional LVEF-based stratification, it is also apparent that arrhythmia substrate is complex and is not adequately characterized by the markers explored to date.
There is growing evidence in the literature that post-infarction iron deposition in the myocardium may be arrhythmogenic. Even though it has been long known that abnormal accumulation of iron in the heart has been associated with cardiac conduction abnormalities20-23, only recently has its relevance come to light in the post MI setting. Eitel et al24 showed that patients with hemorrhagic infarction have an increased risk for experiencing major adverse cardiac events, including death. Mather et al25 showed that patients with hemorrhagic infarction have prolonged filtered QRS duration, which they associated with increased late-arrhythmogenic risk. Recent canine studies have also confirmed that hemorrhagic infarctions can lead to chronic iron deposition26 and that post infarction iron can preferentially alter electrophysiology indices within the infarcted heart27. Moreover, forensic studies utilizing clinical cardiac magnetic resonance imaging (CMR) have shown that SCD victims with chronic MI consistently have hypointense zones in the scarred myocardium in T2-weighted CMR28, 29, which is consistent with iron accumulation. To date however, there has been no direct evidence for an association between post-infarction iron accumulation and mVAs.
We hypothesized that hypointense cores (HIC) can be identified within CMI using balanced steady-state free-precession (bSSFP) CMR at 3.0T, and when used in conjunction with LVEF can markedly improve the prediction of SCA or appropriate ICD therapy. We examined our hypothesis through a retrospective analysis of a CMI patient population undergoing CMR prior to ICD implantation. Guided by previous theoretical and experimental observations 30, 31, we used hypointense territories within CMI on bSSFP CMR at 3.0T as a marker of iron deposition and validated our findings in a canine model of CMI. Specifically, we examined the incremental prognostic value of HIC in bSSFP images, LVEF, scar size, QTc and gray-zone on SCD risk using univariable and multivariable analyses.
METHODS
Patient Studies
Patient Population
This retrospective cohort study was conducted at a large, tertiary care referral center (London Health Sciences Centre, London, Ontario, Canada), between October 2008 and May 2012. The study population consisted of only those patients (n=94) in whom CMR protocol was prescribed and were subsequently instrumented with ICD. CMR imaging was performed in all consenting patients, with the LVEF provided to assist in clinical decision-making. Inclusion criteria for the ICD placement were LVEF≤35% estimated by echocardiography, history of prior MI and appropriate heart failure therapy for ≥3 months. Patients with standard contraindications to LGE-CMR, inclusive of eGFR≤30 mL/min/1.73m2, were excluded. Both verbal and written informed consent was obtained from patients prior to being studied according to the protocols approved by the Health Sciences Research Ethics Board (REB) at the University of Western Ontario. The obtained Research Ethics Board approval also allowed for retrospective analysis of the patient data.
CMR Protocol
Prior to ICD implantation all patients underwent CMR in a 3.0 T MRI system (MAGNETOM Trio, Siemens Healthcare, Erlangen, Germany) equipped with a cardiac surface receive coil. Cine steady-state free precession images (slice thickness=6 mm, no slice gap, TE=3.0/1.5 ms, flip angle=40°, in-plane resolution=1.8 ×1.8 mm2 to 2.0 × 2.0 mm2, bandwidth=930 Hz/pixel, and temporal resolution 28 to 38 ms) were acquired in sequential short-axis views covering the entire LV. LGE imaging was performed 10 to 15 minutes following infusion of gadolinium contrast (0.15–0.2 mmol/kg (IV), Gadovist, Bayer Inc; Toronto, Canada) with segmented IR-FLASH sequence matched to the cine imaging slices triggered at mid diastole (slice thickness=10 mm, no slice gap, TR/TE=2.8ms/1.2 ms, flip angle=20°, in-plane resolution=1.5×1.5 mm2 – 1.8 × 1.8mm2, bandwidth=1500 Hz/pixel). The inversion time was selected empirically by step-wise increase for nulling the remote myocardium.
Image Analysis
All quantitative image analyses were performed using the cmr42 (Circle Cardiovascular Imaging Inc., Calgary, Canada). All qualitative image analysis, including contouring the myocardium, was performed in consensus by two blinded reviewers with >3 years experience in reading CMR images on Osirix (v4.1.2, Pixmeo, Geneva, Switzerland)32. Remote myocardium was defined as the region showing no hyperintensity on LGE images. A reference region of interest (ROI) was drawn in remote myocardium on LGE images. Infarcted myocardium was defined using the mean+5 standard deviations (SD) relative to the reference ROI33. Infarct gray-zone was defined as areas with signal intensity between mean+2SD and mean+3SD cut-offs relative to the reference ROI34. LV mass, end-diastolic volume (EDV), end-systolic volume (ESV) and ejection fraction (EF) were calculated from the cine images and normalized to the body surface area. LV mass was computed from cine images triggered at the same time as LGE images. Infarct volume (%LV) was calculated by normalizing total infarct volume by the total LV myocardial volume.
The presence of infarcted myocardial regions with hypointense cores in bSSFP images (HIC+) were identified qualitatively using a binary scoring scheme (present or absent). All of the HIC determinations were blinded to the clinical outcomes. Additional segmental analysis was performed (also in consensus) to determine the fraction of myocardial segments that were HIC+ relative the scarred segments and its association with ICD events. The image analysis for the identification of patients with HIC+ involved (a) displaying the cine bSSFP and LGE images side–by-side in bi-panel views in Osirix; (b) identifying the infarct territory on LGE image and visually mapping it to bSSFP images; and (c) manually windowing when necessary to discriminate the presence of hypointense core within the LGE positive territory on bSSFP images. HIC+ subjects were identified as those with eight or more contiguous nearest-neighbor hypointense pixels in the infarct territory that are present in every frame of a given short-axis set of cine bSSFP images. All other subjects that did not have hypointense regions or those that did not conform to the identification criterion (i.e. those resembling ‘india-ink’ artifacts35, bSSFP banding artifacts36 and hyperintense regions enclosed by fine hypointense lines35) were identified as HIC−. The 8-pixel approach adapted here is similar to that used in previous publications to visually guide the detection of a desired image contrast37,38.
ICD Implantation and Clinical Follow-Up
ICDs were implanted by the local clinical electrophysiology service in a standard fashion within a median of 29 (IQR of 69) days of the date of CMR. ICD devices were programmed to detect ventricular fibrillation (VF) if 18 of 24 R-R intervals were ≤240 ms. Fast ventricular tachyarrhythmias (VT) was defined as 18 of 24 consecutive R-R intervals ≤320 ms and slow VT as 16 consecutive R-R intervals ≤400 ms. In patients receiving primary prevention, ICDs were routinely programmed to deliver antitachycardia pacing (ATP) or shock therapy for VF or fast VT, and to monitor (not deliver therapy) for slow VT. For patients receiving secondary prevention, ICD programming was altered to treat slow VT using both ATP and shock therapies.
Clinical follow-up and device interrogations at 1, 3, 6 months, and every 6 months thereafter were initiated from the time of CMR imaging. The primary composite endpoint was defined as the occurrence of appropriate ICD therapy, survived cardiac arrest (SCA), or sudden cardiac death (SCD). In patients having ≥2 registered clinical events during follow-up, the time to first clinical event was used for analysis of event-free survival.
At study closure, all device interrogations were de-identified and adjudicated by 2 local electrophysiologists blinded to CMR image analysis. ICD therapy was classified as appropriate when ATP or shock for fast VT (R-R<320 ms) or VF was delivered. ICD therapy was defined as inappropriate when delivered for non-target arrhythmias (e.g., sinus or supraventricular tachycardia), T-wave oversensing, or for any device system malfunction (e.g, lead conductor wire fracture).
All study subjects were evaluated for the incidence of SCA or SCD at 12-month intervals and at study closure during a median of 698.5 (IQR of 689.5) days. This was performed by telephone interview and a review of all medical records. SCD was defined as death occurring within 1 hour of symptom onset.
Validation of Imaging Findings in Canines
Animal preparation and CMR Protocol
To ascertain the tissue composition of the MI territories that appear as HIC+, CMR studies were performed in a canine model of chronic reperfused MI. Canines (n=18, 20-25kg) were enrolled and studied according to the protocols approved by the Institutional Animal Care and Use Committee. Left lateral thoracotomies were performed in canines, and MI was induced by occluding the left anterior descending (LAD) artery for 3 hours followed by reperfusion. Following the surgeries, the canines were allowed to recover for 12 weeks prior to CMR studies.
CMR Studies in Canines
All canine CMR studies were performed on a clinical 3.0T MRI system (MAGNETOM Verio, Siemens Medical Solutions, Erlangen, Germany). Multiple cardiac-gated, breath-held, 2D images of contiguous short-axis sections covering the entire left-ventricle (LV) and the three long-axis views (2,3 and 4 chambers) were acquired using cine-bSSFP (TR/TE=3.1/1.6ms, flip angle=40°, 20-25 cardiac phases, BW=930 Hz/pixel), T2*-weighted imaging (mGRE sequence, TR=12ms, 6 TEs =2.0ms–9.5ms with ΔTE=1.5ms, flip angle=10° and BW=930Hz/pixel), and LGE imaging (IR-FLASH acquired 10-15 minutes following intravenous gadolinium infusion (Magnevist, Bayer Healthcare Pharmaceuticals Inc., Wayne, NJ), optimal TI to null remote myocardium, TR/TE=3.0/1.5 ms, flip angle=25° and BW=586 Hz/pixel). To minimize off-resonance artifacts, volume-selective shim covering the entire heart was performed prior to start of data acquisition. Commonly used imaging parameters for all the scans were in-plane resolution=1.5×1.5mm2, slice thickness=8 mm with no slice gap.
Image Analysis
CMR data from canines were analyzed in cmr42. Infarcted, remote and gray-zone myocardial territories were identified on LGE images as previously described for both patients33 and animals39. Similarly, HIC+ and HIC− short-axis slices were visually identified on bSSFP images as described earlier for patients. First, remote regions identified on LGE images were copied on T2* maps, and T2* of remote myocardium was measured. Next, HIC+ and HIC− territories visually identified on bSSFP images that were positive for LGE were manually traced and copied onto T2* images (matched to slice positions and trigger time) to allow T2* values of both territories to be quantified. T2* values of the remote, HIC+ and HIC− regions were averaged across all animals. Infarct volume and gray-zone volume were measured from the LGE images using Mean+5SD33 and Mean+2-3SD39 criteria respectively relative to a reference ROI placed in the remote myocardium. Iron volume was measured from the T2*-weighted image acquired at TE=6.5ms using the Mean-2SD criterion relative to the reference ROI40, 41. For a given canine, T2* value of the iron deposition detected within each slice of T2*-weighted image was measured, and whole-heart mean T2* value was obtained by averaging across all the slices. Index of iron burden for each canine was subsequently measured as the ratio of iron volume to the corresponding whole-heart mean T2* value (units of ml/s).
Animal Sacrifice and Histology
Animals were euthanized immediately after the CMR studies and their hearts were excised. Each heart was manually sliced into 5 mm thick slices along the LV short-axis, and ex-vivo triphenyl tetrazolium chloride (TTC) staining was performed. The ex-vivo slices were carefully matched to the in-vivo CMR images based on the location of the papillary muscles and infarct morphology, and categorized as HIC+ and HIC−. Three ex-vivo slices each from the HIC+ and HIC− categories were embedded in a paraffin block, sliced into 5 µm contiguous sections and stained with Elastin-modified Masson’s Trichrome (for collagen deposition) and Perl’s stains (for iron depositions) using standard techniques. The sections were mounted on glass slides and scanned at 100-fold magnification using an ACIS II technology based ChromaVision digital slide scanner (Clarient Inc., Aliso Viejo, CA).
Statistical Analysis
All statistical analyses were performed on R statistical software (version 2.15). Categorical variables are expressed as number (and percentage) of patients. Normality of continuous data was evaluated using Shapiro-Wilk test and quantile-quantile plots. Continuous variables with normal distribution are expressed as Mean±SD, while those with non-normal distribution are expressed as median with interquartile range. Depending on the normality of the data, analysis of variance or Kruskal-Wallis test was performed along with appropriate (Tukey (normal) or Wilcoxon Signed Rank Test (non-normal)) post-hoc analysis to evaluate the differences in LVEF, scar size, gray-zone size, QRS interval, and QTC duration among three different groups: 1) HIC+/ICD+, 2) HIC+/ICD−, and 3) HIC−/ICD−. Bonferroni corrections were used to adjust the p value for multiple comparisons. Fisher’s exact test was used to compare groups for categorical variables. Additionally, trend analysis (chi-squared test for trend) was performed to observe any trends in the association of infarct size and gray-zone size with primary outcome. To do this, patients were grouped based on the infarct size and gray-zone size, and the relative frequency of primary outcome was measured across the different groups. Univariable logistic regression was used to identify the significant predictors of appropriate ICD therapy. Multivariable logistic regression was performed using only the significant univariable predictors. Odds ratios were computed for the different predictors from the univariable and multivariable regression. ROC analysis was performed to determine the predictive capability of significant univariable and multivariable predictors. Statistical significance was set at p<0.05 for all analyses.
Statistical tools used to assess findings in canines were similar to that used to examine patients data. To account for multiple measurements from the same canine, mixed-model ANOVA was used to compare the T2* values among remote myocardium, HIC+ scarred myocardium, and HIC− scarred myocardium. Gray zone volume measured from the HIC+ and HIC− canines were also compared using Student’s t-test or Wilcoxon-signed rank test depending on the normality of the data. Linear regression analyses were performed to investigate the relationship between gray-zone volume and iron volume, gray-zone volume and T2* of iron, and gray-zone volume and index of iron burden. Statistical significance was set at p<0.05.
RESULTS
Patient Studies
Baseline characteristics
The present retrospective cohort study enrolled 94 patients with prior MI, where every patient was positive for LGE CMR. Their baseline characteristics are shown in Table 1. Basic risk factors and medical therapies at baseline, except median NYHA functional class, did not differ between patients who did or did not have the HIC present in bSSFP images (Table 1). The baseline CMR values of the study population were as follows: mean LV mass index=93.0±23.2 g/m2; LV end-diastolic volume index=118.9±35.3 ml/m2; LV end-systolic volume index=83.3±33.6 ml/m2; mean LVEF=31.7±11% and mean gray-zone (GZ)=8.0±3.0%. LGE was observed in all patients included in the study with a mean scar volume (%LV) of 23.3±15.9. There was no difference in LVEF, LV end-diastolic volume, LV end-systolic volume, scar size and gray-zone between the two study groups.
Table 1.
Baseline Patient Characteristics (Based on presence of HIC on bSSFP)
| All Patients | HIC − | HIC + | ||
|---|---|---|---|---|
| Characteristic | (n=94) | (n=48) | (n=46) | P Value |
| Age, y (mean ± SD) | 62.6 ± 10.5 | 63.0 ± 11.6 | 62.2 ± 9.2 | 0.71 |
| Male sex (%) | 90 (96) | 46 (96) | 44 (96) | 0.94 |
| Clinical history | ||||
| Hypertension (%) | 62 (66) | 33 (69) | 29 (63) | 0.52 |
| Diabetes (%) | 38 (40) | 21 (44) | 17 (37) | 0.29 |
| Hyperlipidemia (%) | 79 (84) | 41 (85) | 38 (82) | 0.87 |
| Smoking (%) | 55 (59) | 25 (52) | 30 (65) | 0.22 |
| History of revascularization (%) | 49 (52) | 24 (50) | 25 (54) | 0.67 |
| NYHA functional class (median, IQR) | 2 (1) | 3 (1) | 2 (1) | 0.01* |
| Systolic BP (mm Hg) | 124.1 ± 19.5 | 122.6 ± 21.3 | 125.7 ± 17.4 | 0.49 |
| Diastolic BP (mm Hg) | 72.7 ± 11.3 | 71.5 ± 11.9 | 73.9 ± 10.7 | 0.35 |
| History of ventricular arrhythmias (%) | 13 (14) | 6 (12) | 7 (15) | 0.71 |
| Medications | ||||
| ACE inhibitor (%) | 67 (71) | 33 (69) | 34 (74) | 0.92 |
| Amiodarone (%) | 7 (7) | 3 (6) | 4 (9) | 0.73 |
| ARB (%) | 24 (25) | 12 (25) | 12 (16) | 0.30 |
| ASA (%) | 64 (68) | 34 (71) | 30 (65) | 0.81 |
| Beta blocker (%) | 75 (80) | 37 (77) | 38 (83) | 0.39 |
| Digoxin (%) | 22 (23) | 10 (21) | 12 (26) | 0.84 |
| Diuretic (%) | 55 (59) | 23 (48) | 32 (70) | 0.89 |
| Plavix (%) | 10 (11) | 4 (8) | 6 (13) | 0.43 |
| Statin (%) | 50 (53) | 23 (48) | 27 (59) | 0.51 |
| Electrocardiogram | ||||
| Heart Rate (bpm) (mean ± SD) | 70.5 ± 13.7 | 68.7 ± 11.7 | 72.5 ± 15.5 | 0.20 |
| QRS (msec) (mean ± SD) | 129.8 ± 29.6 | 131.4 ± 30.9 | 127.6 ± 28.5 | 0.53 |
| QTc (msec) (mean ± SD) | 456.4 ± 39.9 | 459.1 ± 41.7 | 453.8 ± 38.9 | 0.52 |
| LBBB (%) | 32 (34) | 14 (27) | 18 (39) | 0.31 |
| CMR Parameters | ||||
| LV mass index, g/m2 (mean ± SD) | 93.0 ± 23.2 | 92.6 ± 23.2 | 93.5 ± 23.7 | 0.85 |
| LV EDV index, ml/m2 (mean ± SD) | 118.9 ± 35.3 | 116.0 ± 33.1 | 121.0 ± 37.3 | 0.47 |
| LV ESV index, ml/m2 (mean ± SD) | 83.3 ± 33.6 | 79.9 ± 28.9 | 85.9 ± 37.7 | 0.37 |
| LVEF, % (mean ± SD) | 31.7 ± 11 | 32.3 ± 10.1 | 31.2 ± 11.8 | 0.59 |
| Scar volume, %LV (mean ± SD) | 23.3 ± 15.9 | 22.0 ± 16.6 | 24.2 ± 14.9 | 0.47 |
| Gray-zone (2-3SD), % (mean ± SD) | 8.0 ± 3.0 | 7.9 ± 3.1 | 8.0 ± 2.9 | 0.88 |
NYHA, New York Heart Association; IQR, interquartile range; BP, blood pressure; ACE, angiotensin-converting enzyme; ARB, angiotensin receptor blocker; ASA, acetylsalicylic acid; LBBB, left bundle-branch block; ICD, implantable cardiac defibrillator; LV, left ventricle; EDV, end-diastolic volume; ESV, end-systolic volume; EF, ejection fraction.
Significant (p<0.05)
Clinical Follow-Up
All patients were followed for occurrence of primary endpoint for a median of 698.5 (IQR of 689.5) days. Device interrogations occurred on months 1, 3, 6, and every 6 months thereafter from the day of CMR imaging. Endpoint criteria (appropriate ICD therapy, SCA, SCD) were met in 19 patients with events occurring at a median of 249 (IQR of 540) days after ICD placement. Of these, 11 patients received an appropriate shock, 3 patients received appropriate antitachycardia pacing for sustained VT (1 out of 3 with advanced heart failure), and 5 patients died due to SCD (1 out of 5 with advanced heart failure). In addition, 3 patients suffered a non-sudden cardiac death due to progressive heart failure and 4 patients with progressive heart failure died of non-cardiac cause.
Hypointense MI Territories on bSSFP Images Versus Primary Endpoint
Analysis of the CMR data showed that of the 19 patients having a primary endpoint 18 were classified as HIC+, while only 1 subject was classified as HIC− (Table 2). Fig. 1 shows representative CMR findings in a patient with HIC+ experiencing the primary endpoint and a patient who was HIC− and did not experience the primary endpoint. In the group of patients in whom the primary endpoint was not met, there were 28 HIC+ and 47 HIC− patients.
Table 2.
Hypointense Core (HIC) Versus Frequency of Primary Outcome
| All Patients (n= 94) | ||||||
|---|---|---|---|---|---|---|
| Variable | With Primary Outcome (n=19) |
Without Primary Outcome (n=75) |
Univariable Odds Ratio (95% CI) |
Multivariable Odds Ratio (95% CI) |
||
| HIC | HIC + (n=18) |
HIC − (n=1) |
HIC + (n=28) |
HIC − (n=47) |
30.21 (3.82, 238.77) p=0.001* |
33.29 (4.16, 265.6) p=0.001* |
| LVEF, % (mean±SD) Range (min, max) |
27.4 ± 10.8 (15.1 to 49.3) |
21.3 | 33.0 ± 10.8 (18.9 to 53.1) |
32.4 ± 10.4 (13.0 to 54.6) |
0.95 (0.98, 1.01) p=0.048 |
0.95 (0.89, 1.004) p=0.067 |
| Scar Volume (%LV, mean±SD) Range (min, max) |
25.7 ± 14.8 (1.9 to 53.9) |
22.0 | 26.3 ± 14.7 (0.4 to 52.8) |
22.9 ± 16.9 (0.2 to 59.9) |
1.01 (0.89, 1.0001) p=0.728 |
- |
| GZ (2-3 SD) (%,mean±SD) Range (min, max) |
7.9 ± 2.8 (2.6 to 11.1) |
12.1 | 8.0 ± 3.1 (3.5 to 19.7) |
7.8 ± 3.0 (2.5 to 17.3) |
1.03 (0.87, 1.21) p=0.74 |
- |
| QRS (msec) (mean±SD) |
126.9 ± 28.7 | 156.0 | 130.6 ± 29.8 | 132.0 ± 31.4 | 1.00 (0.98, 1.01) p=0.695 |
- |
| QTc (msec) (mean ± SD) |
455.1 ± 33.9 | 422.0 | 450.7 ± 42.9 | 459.3 ± 42.4 | OR=1.00 (0.95, 1.21) p=0.790 |
- |
HIC+: hypointense core present; HIC−: hypointense core absent; GZ: gray-zone; OR: odds ratio; LV: left ventricle.
Significant (p<0.05)
Figure 1. Presence of HIC within MI territories on bSSFP images.

Representative bSSFP and LGE images from two patients receiving ICD therapy; one who met the primary endpoint (Event+) and one who did not meet the primary endpoint (Event−). For the Event+ patient, blue arrows denote the MI region on Late Gadolinium Enhancement (LGE) imaging and the Hypo-Intense Core (HIC) region on bSSFP imaging. In the Event− patient, no HIC were observed by bSSFP within the MI region, indicated by the red arrow on LGE imaging.
Univariable regression analysis showed that only LVEF (β= −0.06; Odds ratio (OR)=0.95; 95% Confidence Interval (CI)=0.98,1.01; p=0.048) and the presence of HIC (β=3.41; OR=30.21; 95% CI=3.82, 238.77; p=0.001) were significant predictors of primary endpoint (Table 2). Multivariable regression analysis showed that both LVEF (β= −0.06; OR=0.95; 95% CI=0.89, 1.004; p=0.067) and the presence of HIC (β=3.50; OR=33.29; 95% CI=4.16, 265.6; p=0.001) were independent predictors of primary endpoint (Table 2). ROC analysis showed that the addition of scar size to LVEF did not change the AUC, but the addition of HIC to LVEF and scar size increased the AUC from 0.68 to 0.87, demonstrating an additive prognostic value of HIC (Figure 2). In addition, there was no statistically significant difference between the ICD+/HIC+ and ICD−/HIC+ groups with respect to %HIC (53.3±13.9% vs. 51.4±20.5%, p=0.80).
Figure 2. Predictive value of HIC on bSSFP images for primary endpoint.

Corresponding ROC curves for LVEF, LVEF+Scar Volume, and LVEF+Scar Volume+HIC for the prediction of the primary endpoint. While the addition of Total Scar Volume alone did not improve the predictive accuracy over LVEF, the addition of HIC improved the AUC from 0.69 to 0.87, suggesting additional prognostic value of HIC.
Trend analysis showed a trend for increasing frequency of primary outcomes with the increase in infarct size (Fig. 3A) and size of gray-zones (Fig. 3B), which is consistent with previous observations by others34, 42, 43, 44. While there were no significant differences in the relative frequencies of primary outcomes among patient groups based on the infarct size (p=0.28), the relative frequencies of primary outcomes were significantly different among patient groups based on the gray-zone size (p<0.001).
Figure 3. Relationship of frequency of primary outcomes with infarct and gray-zone sizes.
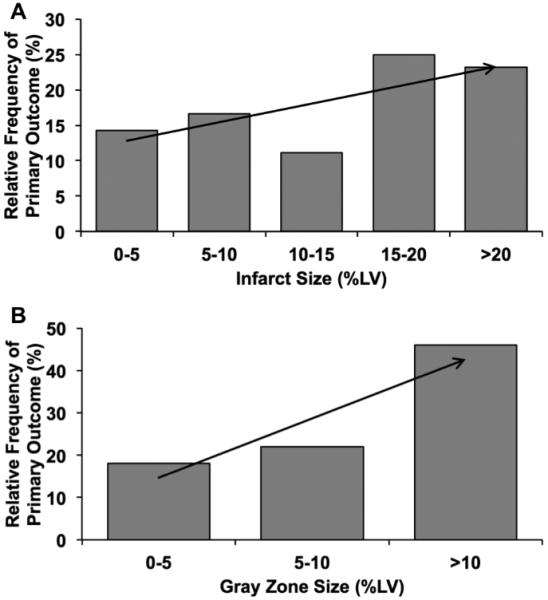
Relative frequency of primary outcomes among patients grouped on the basis of infarct size (A) and gray-zone sizes (B) are shown. There was a trend (indicated by the arrows) toward higher frequency of primary outcomes with increase in infarct size and size of gray zone.
Canine Studies
CMR Findings
Out of 18 animals studied, all animals demonstrated visual LGE evidence for myocardial infarction and 9 were scored as HIC+ and the remainder were scored as HIC−. For each animal, 10-14 spatially matched cine, T2* and LGE image slices were available for analysis. A total of 94 slices (out of 232) were positive for myocardial infarction on the basis of LGE imaging. Of these, 32 were classified as HIC+ and 62 as HIC− on bSSFP images. T2* mapping confirmed the visual presence of distinct hypo-intense regions on all HIC+ slices while HIC− slices failed to show this finding.
Representative LGE, bSSFP and T2* weighted images acquired 12 weeks post MI are shown from HIC+ and HIC− canines are shown in Figure 4 (A-C) and 5 (A-C), respectively. Panels 4A and 4B together show visually evident HIC+ regions within the region of MI. Spatial concordance of HIC+ in bSSFP images (Fig. 4B) with T2*-weighted images (Fig. 4C), a validated approach for detecting iron deposits, was visually evident, suggesting that the HIC+ regions in bSSFP images are likely from iron. In contrast, note that in Fig. 5, while an MI is evident (Fig. 5A) there are no hypointense regions within the corresponding MI territories in bSSFP (Fig. 5B) and T2* (Fig. 5C) images.
Figure 4. Histological canine validation of HIC on bSSFP images as regions with focal iron deposition.

Representative in-vivo LGE (A), bSSFP (B), and T2*-weighted (C) images acquired 12 weeks post myocardial infarction from a canine at classified as Hypo-Intense Core (HIC)+. Hypointense cores could be observed on both bSSFP and T2*-weighted images (arrows) within the corresponding infarct regions shown on LGE images. Ex-vivo slice-matched TTC image (D), EMT staining (E: MI territories; G: remote territories), and Perl’s staining (F: MI territories; H: remote territories) from the same canine are also shown. Scale bars in EMT and Perl’s stained images are 100 microns. EMT staining of MI territories showed extensive collagen deposition (deep blue staining), while Perl’s staining showed significant chronic iron depositions (blue deposits pointed at by arrows).
Figure 5. Histological canine validation of the absence of focal iron deposition in HIC− regions.

Representative in-vivo LGE (A), bSSFP (B), and T2*-weighted (C) images acquired 12 weeks post myocardial infarction from a canine at classified as Hypo-Intense Core (HIC)− are shown. No hypointense cores could be observed on either bSSFP or T2*-weighted images (arrows) within the corresponding infarct regions shown by LGE images. Ex-vivo slice-matched TTC image (D), EMT staining (E: MI territories; G: remote territories), and Perl’s staining (F: MI territories; H: remote territories) from the same canine are also shown. Scale bars in EMT and Perl’s stained images are 100 microns. EMT staining of MI territories showed extensive collagen deposition (deep blue staining), but Perl’s staining did not show any chronic iron deposition.
Individual and mean cohort T2* values for remote, HIC+, and HIC− tissue are shown in Figure 6. The mean T2* of HIC+ territories (21±5ms) were significantly lower than those of remote myocardium (32±3ms, p<0.001) and HIC− territories (30±4ms, p<0.001). The mild difference in T2* (~2ms) observed between remote tissue and HIC− territories was found to be statistically significant (p=0.04).
Figure 6. In-vivo T2* measures from Remote, scarred myocardium with (HIC)+ and without (HIC−) hypointense segments within the scarred canine myocardium.

Mean T2* values measured across all animals from Remote myocardial territories was 32.3±−3.1 ms; from HIC+ territories was 21.6.3±5.0 ms; and from HIC− territories was 30.1±−3.8 ms. Mean T2* of HIC+ territories was significantly lower than for Remote territories (*, p<0.01) and HIC− territories (**, p<0.05).
Mean gray zone volume measured from HIC+ canines was significantly higher than that of the HIC− canines (0.94 ± 0.58 vs. 0.49 ± 0.14; p=0.02). Significant linear relationships were found between gray-zone volume and iron volume (R2=0.41, p<0.001, Fig. 7A), gray-zone volume and T2* of iron (R2=0.18, p<0.001, Fig. 7B), and gray-zone volume and index of iron burden (R2=0.39, p<0.001, Fig. 7C).
Figure 7. Relationship between chronic iron deposition and gray zones.
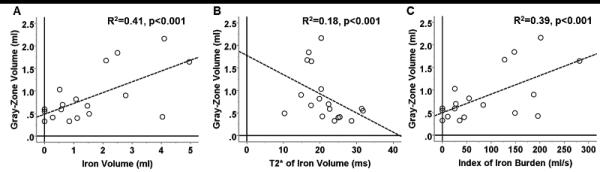
Linear regression analyses examining the relationship between gray-zone volume and extent of chronic iron deposition within chronic infarction territories are shown. Significant linear relationships were found between gray-zone volume and iron volume (A), gray-zone volume and T2* of iron (B), and gray-zone volume and index of iron burden, quantified as a quotient of iron volume normalized by its corresponding T2* (C).
Histological Findings
Ex-vivo TTC staining confirmed the presence of myocardial infarction in both HIC+ (Figure 4D) and HIC− (Figure 5D) canines. A brown discoloration consistent with chronic iron deposition was observed within the core of MI territories among HIC+ canines, but not HIC− canines. EMT staining showed extensive collagen deposition within the MI territories in both HIC+ (Figure 4E) and HIC− slices (Figure 5E). Perl’s staining confirmed significant chronic iron deposition was only present within the infarcted territories of HIC+ slices (Figure 4F), and not of HIC− slices (Figure 5F). EMT and Perl’s staining of remote myocardium showed no abnormal pathologies in either canine group (Figures 4G-H and 5G-H).
DISCUSSION
SCA, typically culminating from malignant ventricular arrhythmias (mVA), is the leading cause of death in the United States. More than 40% of patients dying of SCA have chronic myocardial infarctions (CMI). While the ICD is a highly effective tool for the primary prevention of SCA, current guideline recommendations (LVEF< 35%) inadequately identify those patients at greatest risk, resulting in an undesirably high number needed to treat in order to save 1 life12,13,15-19. Accordingly, improved methods for the prediction of mVAs are in critical need.
Multiple studies examining mechanisms of arrhythmogenesis in CMI over the past decade have identified fibrosis as the primary structural substrate associated with mVA45. It is believed that the presence of collagen fibers acts as a barrier against electrophysiological propagation, facilitating a re-entry circuit. However, not all patients with CMI develop mVA despite the presence of intramyocardial collagen. While scar size has emerged as an important parameter associated with mVA, the exact association of scar size and mVA remains unclear. Klem et al showed that while there is a sharp increase in SCD incidence (from 10% to 45%) as scar volume increases from 0-5% to 5-10%, the incidence does not appear to be influenced by scar volume beyond this range42. In contrast, Kwon et al showed that scar size > 30% is a key risk factor for events43 and Yan et al showed that every 10% increase in scar size increases the risk of developing SCD by 50%34. These observations suggest that other factors in addition to scar size, such as tissue composition, may play an important role. To data however, only a few studies have examined tissue composition of CMI beyond that of fibrosis.
A number of mechanisms by which heart function may decline and predispose patients to mVA in acute and chronic post-MI settings have been investigated. Among these, it has long been suspected that iron composites within the acute MI region is proarrhythmic and has the potential to promote early adverse remodeling and mVAs. This notion inspired the use of chelation therapies to decrease oxidative stress from iron within AMI territories with the goal of decreasing acute injury and marginalizing electrical anomalies46; however results have been mixed. Notably, all studies to date examining this therapy were confined to the acute setting (i.e. not more than 1-2 days following an event) and/or did not randomize subjects (animals or patients) to chelation therapy on the basis of imaging evidence for iron deposition. Indeed, until recently the presence of iron, its influence on adverse remodeling, and any electrical implications during the chronic phase of MI (i.e., weeks to months following an event) had not been explored26, 27.
CMR has been instrumental in demonstrating that intra-myocardial hemorrhage is frequently present in reperfused acute MI. However, until recently the fate of extravasated red blood cells within the infarct territory was not known. Recent CMR studies have shown that hemorrhagic infarction can lead to chronic iron deposition with a characteristic subendocardial location identified using T2* CMR26, 27. In addition to demonstrating its actual presence in the chronic setting, it was also shown that such infarcts with iron deposition are disposed to worse remodeling, are subjected to prolonged iron-driven inflammation, and exhibit altered electrophysiological parameters (QTc, presence of isolated late potentials, etc.) compared to infarcts without iron deposition26, 27. Most notably in situ forensic pathology studies have consistently noted, visually evident, hypointense T2-weighted CMR signals, consistent with iron deposition among SCA victims with chronic myocardial infarction28, 29. These findings suggest that hemorrhagic acute MI may have a significant influence on the development of mVA in the chronic setting.
We performed a retrospective observational study of CMI patients undergoing ICD therapy to assess the incremental predictive value of HIC, a marker of iron deposition using an iron-sensitive CMR sequence (bSSFP), over previously explored indices (LVEF, scar volume, gray-zone, QTc and QRS). In univariable analysis using logistic regression, we found only LVEF and HIC to be significant predictors, while all other parameters did not reach statistical significance. Using multi-variable logistic regression analysis, only LVEF and HIC reached statistical significance. In particular, ROC analysis showed that when HIC was added to LVEF, there was a marked increase in the area under the curve compared to LVEF alone, demonstrating improved predictive accuracy. Moreover, using an established canine model of chronic reperfused MI, we confirmed theoretical predictions that iron deposition will appear hypo-intense on bSSFP-based imaging and that these HIC+ regions have a marked decrease in T2* by quantitative mapping (a CMR approach validated for myocardial iron deposition). In addition, our histological observations confirmed that HIC+ regions within MI territories are indeed related to local iron deposition.
In this study we also examined the predictive utility of previously explored indices on the primary outcome. Among these, only LVEF was predictive. Total scar volume, expressed as a continuous variable, showed a trend towards greater volume in those with events, but this was not significant. However, the incidence of primary endpoint was nearly 7 fold higher in patients with a scar volume > 10% compared to those with scar volume <5%. This is consistent with the previous observations that the risk of developing mVA appears to be low in patients with small infarcts, and significantly elevated among those with large infarcts. Based on our canine studies, we speculate that the source of HIC+ in our patient population was due to iron deposition related to a prior hemorrhagic acute MI. It is reasonable to expect that HIC+ infarcts are less likely to occur in the setting of small infarcts, and may provide a rational explanation for an observed “threshold phenomenon” relating infarct size to future arrhythmic risk.
While we showed that the hypointense regions in CMI are likely related to iron deposition, several other sources can mimic hypointensities on bSSFP imaging of the myocardium. First, the well known banding artifacts36 can be a source of these artifacts. However, such bands tend to be continuous across adjacent organs and are also known to impart flow artifacts. When such banding artifacts were identified to be present in this study, data from those imaging slices were not included in our analysis. Another source of hypointensity in bSSFP images is motion artifact, which is typically observed only in imaging frames when the cardiac motion is severe. Since our analysis conditioned that the hypointense regions be present throughout the cardiac cycle (i.e. in all frames), we were able to limit motion artifacts from being incorrectly identified as HIC+. Third, although it is possible that calcification may also contribute to hypointensity within the infarct core, iron deposits are more readily visible as hypointense regions since the magnetic susceptibility shift arising from calcium deposits is at least two orders of magnitude weaker than with iron47. However, the evidence in the literature for arrhythmogenic potential of calcium deposits within MI appears negative48. Finally, the presence of fat may also appear as hypointense lines (‘india-ink’ artifact) or hypointense lines enclosing hyperintense territories in bSSFP images35. Based on our definition that HIC+ regions need to have at least eight contiguous nearest neighbor pixels, we believe that we were able to minimize fatty infarcts from being counted as HIC+. These efforts enabled us to ensure that potential confounders of HIC+ were kept to a minimum but further studies are needed to fully elucidate the substrate in patients.
Study Limitations
This study has several limitations. First, we conducted a retrospective observational study from a single-center with a limited sample size. Thus, the findings from this study need to be confirmed in a larger, multicenter setting with adequate power to examine all relevant indices on the primary outcome. Second, we examined the presence of HIC using bSSFP imaging in a clinical cohort and performed ex-vivo validation in a canine model of chronic reperfused MI. The latter was used to demonstrate that it is iron deposition being identified using HIC scoring criteria. The inherent limitation of this design is that validation is based upon an independent, albeit well established animal model of chronic MI. Histologic confirmation of iron deposition was not available in the patient cohort due to its retrospective study design and inability to obtain post-mortem tissue for iron-sensitive staining. Further, while every effort was made to remove potential confounders in the image analysis, the scoring of hypointense cores (HIC) in clinical cohorts may be improved using T2* mapping sequences. Given the retrospective nature of this study, T2* acquisitions were not routinely performed as part of the CMR examination, and were therefore not available for analysis. However, the ability to categorize HIC using routine bSSFP imaging offers greater generalizability to routine clinical practice. Third, we recruited only MI patients who were considered eligible for ICD therapy (i.e. LVEF<35%). Of great interest is the prognostic utility of this technique among those currently not meeting eligibility criteria for ICD therapy. Accordingly, further studies are needed to examine the relation between post MI iron and mVA in patients with LVEF>35%. Fourth, the scan parameters used for LGE and bSSFP imaging in patients differed slightly from those used in canines due to practical limitations (e.g. heart-rate variations, imaging field of view, size of hearts, etc.). Nonetheless, since LGE and bSSFP acquisition parameters between patient and canines studies were relatively similar, we do not expect to see any differences in scar size or marked differences in HIC visualization that would confound the interpretations of the study. Fifth, inter and intra-observer variability were not evaluated for detecting HICs on bSSFP images, as the images were evaluated in consensus by two blinded reviewers similar to other early investigations32. Further, this study was not designed to assess the long-term changes in imaging biomarkers since CMR was confined to a single time point prior to ICD implantation. It would be of interest for the design of future studies to consider incorporating multiple imaging time points to assess the temporal changes in the imaging biomarkers of interest. Finally, we recognize that our findings are associative and do not provide a causal relationship between iron deposition and arrhythmia formation. Given that inflammation has been associated with frequent cause of life-threatening ventricular arrhythmias and sudden cardiac death49, we conjecture that a possible mechanism by which iron deposits could influence the arrhythmogenesis is via prolonged iron-driven inflammation in the chronic phase of myocardial infarction26. Additional studies are required to elucidate the proarrhythmic effects of cytokines and inflammatory mediators within iron-laden chronic infarctions.
CONCLUSIONS
This is a hypothesis generating study, which provides sentinel evidence that hypointense cores (HIC) on iron-sensitive CMR may be a powerful predictor of mVA in patients with chronic myocardial infarction. Further prospective studies sufficiently powered to evaluate the incremental utility of HIC versus contemporary risk prediction markers are warranted.
Supplementary Material
Footnotes
Disclosures
None.
REFERENCES
- 1.Zipes DP, Camm AJ, Borggrefe M, Buxton AE, Chaitman B, Fromer M, Gregoratos G, Klein G, Moss AJ, Myerburg RJ, Priori SG, Quinones MA, Roden DM, Silka MJ, Tracy C, Smith SC, Jr., Jacobs AK, Adams CD, Antman EM, Anderson JL, Hunt SA, Halperin JL, Nishimura R, Ornato JP, Page RL, Riegel B, Blanc JJ, Budaj A, Dean V, Deckers JW, Despres C, Dickstein K, Lekakis J, McGregor K, Metra M, Morais J, Osterspey A, Tamargo JL, Zamorano JL. Acc/aha/esc 2006 guidelines for management of patients with ventricular arrhythmias and the prevention of sudden cardiac death: A report of the american college of cardiology/american heart association task force and the european society of cardiology committee for practice guidelines (writing committee to develop guidelines for management of patients with ventricular arrhythmias and the prevention of sudden cardiac death): Developed in collaboration with the european heart rhythm association and the heart rhythm society. Circulation. 2006;114:e385–484. doi: 10.1161/CIRCULATIONAHA.106.178233. [DOI] [PubMed] [Google Scholar]
- 2.Rea TD, Page RL. Community approaches to improve resuscitation after out-of-hospital sudden cardiac arrest. Circulation. 2010;121:1134–1140. doi: 10.1161/CIRCULATIONAHA.109.899799. [DOI] [PubMed] [Google Scholar]
- 3.Adabag AS, Luepker RV, Roger VL, Gersh BJ. Sudden cardiac death: Epidemiology and risk factors. Nat Rev Cardiol. 2010;7:216–225. doi: 10.1038/nrcardio.2010.3. [DOI] [PMC free article] [PubMed] [Google Scholar]
- 4.Myerburg RJ, Reddy V, Castellanos A. Indications for implantable cardioverter-defibrillators based on evidence and judgment. J Am Coll Cardiol. 2009;54:747–763. doi: 10.1016/j.jacc.2009.03.078. [DOI] [PubMed] [Google Scholar]
- 5.Kong MH, Fonarow GC, Peterson ED, Curtis AB, Hernandez AF, Sanders GD, Thomas KL, Hayes DL, Al-Khatib SM. Systematic review of the incidence of sudden cardiac death in the united states. J Am Coll Cardiol. 2011;57:794–801. doi: 10.1016/j.jacc.2010.09.064. [DOI] [PMC free article] [PubMed] [Google Scholar]
- 6.Zipes DP, Wellens HJ. Sudden cardiac death. Circulation. 1998;98:2334–2351. doi: 10.1161/01.cir.98.21.2334. [DOI] [PubMed] [Google Scholar]
- 7.Breithardt G, Borggrefe M, Martinez-Rubio A, Budde T. Pathophysiological mechanisms of ventricular tachyarrhythmias. Eur Heart J. 1989;10(Suppl E):9–18. doi: 10.1093/eurheartj/10.suppl_e.9. [DOI] [PubMed] [Google Scholar]
- 8.Huikuri HV, Castellanos A, Myerburg RJ. Sudden death due to cardiac arrhythmias. N Engl J Med. 2001;345:1473–1482. doi: 10.1056/NEJMra000650. [DOI] [PubMed] [Google Scholar]
- 9.A comparison of antiarrhythmic-drug therapy with implantable defibrillators in patients resuscitated from near-fatal ventricular arrhythmias. The antiarrhythmics versus implantable defibrillators (avid) investigators. N Engl J Med. 1997;337:1576–1583. doi: 10.1056/NEJM199711273372202. [DOI] [PubMed] [Google Scholar]
- 10.Bardy GH, Lee KL, Mark DB, Poole JE, Packer DL, Boineau R, Domanski M, Troutman C, Anderson J, Johnson G, McNulty SE, Clapp-Channing N, Davidson-Ray LD, Fraulo ES, Fishbein DP, Luceri RM, Ip JH, Investigators S-H Amiodarone or an implantable cardioverter-defibrillator for congestive heart failure. New Engl J Med. 2005;352:225–237. doi: 10.1056/NEJMoa043399. [DOI] [PubMed] [Google Scholar]
- 11.Moss AJ, Zareba W, Hall WJ, Klein H, Wilber DJ, Cannom DS, Daubert JP, Higgins SL, Brown MW, Andrews ML. Prophylactic implantation of a defibrillator in patients with myocardial infarction and reduced ejection fraction. N Engl J Med. 2002;346:877–883. doi: 10.1056/NEJMoa013474. [DOI] [PubMed] [Google Scholar]
- 12.Fishman GI, Chugh SS, Dimarco JP, Albert CM, Anderson ME, Bonow RO, Buxton AE, Chen PS, Estes M, Jouven X, Kwong R, Lathrop DA, Mascette AM, Nerbonne JM, O'Rourke B, Page RL, Roden DM, Rosenbaum DS, Sotoodehnia N, Trayanova NA, Zheng ZJ. Sudden cardiac death prediction and prevention: Report from a national heart, lung, and blood institute and heart rhythm society workshop. Circulation. 2010;122:2335–2348. doi: 10.1161/CIRCULATIONAHA.110.976092. [DOI] [PMC free article] [PubMed] [Google Scholar]
- 13.Buxton AE, Lee KL, Hafley GE, Pires LA, Fisher JD, Gold MR, Josephson ME, Lehmann MH, Prystowsky EN, Investigators M. Limitations of ejection fraction for prediction of sudden death risk in patients with coronary artery disease: Lessons from the mustt study. J Am Coll Cardiol. 2007;50:1150–1157. doi: 10.1016/j.jacc.2007.04.095. [DOI] [PubMed] [Google Scholar]
- 14.Chugh SS, Uy-Evanado A, Teodorescu C, Reinier K, Mariani R, Gunson K, Jui J. Women have a lower prevalence of structural heart disease as a precursor to sudden cardiac arrest the ore-suds (oregon sudden unexpected death study) Journal of the American College of Cardiology. 2009;54:2006–2011. doi: 10.1016/j.jacc.2009.07.038. [DOI] [PMC free article] [PubMed] [Google Scholar]
- 15.Hunt SA, Abraham WT, Chin MH, Feldman AM, Francis GS, Ganiats TG, Jessup M, Konstam MA, Mancini DM, Michl K, Oates JA, Rahko PS, Silver MA, Stevenson LW, Yancy CW, Antman EM, Smith SC, Jr., Adams CD, Anderson JL, Faxon DP, Fuster V, Halperin JL, Hiratzka LF, Jacobs AK, Nishimura R, Ornato JP, Page RL, Riegel B, American College of C, American Heart Association Task Force on Practice G, American College of Chest P, International Society for H, Lung T, Heart Rhythm S Acc/aha 2005 guideline update for the diagnosis and management of chronic heart failure in the adult: A report of the american college of cardiology/american heart association task force on practice guidelines (writing committee to update the 2001 guidelines for the evaluation and management of heart failure): Developed in collaboration with the american college of chest physicians and the international society for heart and lung transplantation: Endorsed by the heart rhythm society. Circulation. 2005;112:e154–235. doi: 10.1161/CIRCULATIONAHA.105.167586. [DOI] [PubMed] [Google Scholar]
- 16.Lloyd-Jones D, Adams R, Carnethon M, De Simone. Ferguson TB, Flegal K, Ford E, Furie K, Go A, Greenlund K, Haase N, Hailpern S, Ho M, Howard V, Kissela B, Kittner S, Lackland D, Lisabeth L, Marelli A, McDermott M, Meigs J, Mozaffarian D, Nichol G, O'Donnell C, Roger V, Rosamond W, Sacco R, Sorlie P, Stafford R, Steinberger J, Thom T, Wasserthiel-Smoller S, Wong N, Wylie-Rosett J, Hong Y. Heart disease and stroke statistics--2009 update: A report from the american heart association statistics committee and stroke statistics subcommittee. Circulation. 2009;119:480–486. doi: 10.1161/CIRCULATIONAHA.108.191259. [DOI] [PubMed] [Google Scholar]
- 17.Turakhia MP. Sudden cardiac death and implantable cardioverter-defibrillators. Am Fam Physician. 2010;82:1357–1366. [PubMed] [Google Scholar]
- 18.de Vreede-Swagemakers. Gorgels AP, Dubois-Arbouw WI, Dalstra J, Daemen MJ, van Ree. Stijns RE, Wellens HJ. Circumstances and causes of out-of-hospital cardiac arrest in sudden death survivors. Heart. 1998;79:356–361. doi: 10.1136/hrt.79.4.356. [DOI] [PMC free article] [PubMed] [Google Scholar]
- 19.Stecker EC, Vickers C, Waltz J, Socoteanu C, John BT, Mariani R, McAnulty JH, Gunson K, Jui J, Chugh SS. Population-based analysis of sudden cardiac death with and without left ventricular systolic dysfunction - two-year findings from the oregon sudden unexpected death study. Journal of the American College of Cardiology. 2006;47:1161–1166. doi: 10.1016/j.jacc.2005.11.045. [DOI] [PubMed] [Google Scholar]
- 20.Kaye SB, Owen M. Cardiac arrhythmias in thalassaemia major: Evaluation of chelation treatment using ambulatory monitoring. Br Med J. 1978;1:342. doi: 10.1136/bmj.1.6109.342. [DOI] [PMC free article] [PubMed] [Google Scholar]
- 21.Schwartz KA, Li Z, Schwartz DE, Cooper TG, Braselton WE. Earliest cardiac toxicity induced by iron overload selectively inhibits electrical conduction. J Appl Physiol. 2002;93:746–751. doi: 10.1152/japplphysiol.01144.2001. [DOI] [PubMed] [Google Scholar]
- 22.Kirk P, Roughton M, Porter JB, Walker JM, Tanner MA, Patel J, Wu D, Taylor J, Westwood MA, Anderson LJ, Pennell DJ. Cardiac t2* magnetic resonance for prediction of cardiac complications in thalassemia major. Circulation. 2009;120:1961–1968. doi: 10.1161/CIRCULATIONAHA.109.874487. [DOI] [PMC free article] [PubMed] [Google Scholar]
- 23.Isma'eel H, Shamseddeen W, Taher A, Gharzuddine W, Dimassi A, Alam S, Masri L, Khoury M. Ventricular late potentials among thalassemia patients. Int J Cardiol. 2009;132:453–455. doi: 10.1016/j.ijcard.2007.08.103. [DOI] [PubMed] [Google Scholar]
- 24.Eitel I, Kubusch K, Strohm O, Desch S, Mikami Y, de Waha S, Gutberlet M, Schuler G, Friedrich MG, Thiele H. Prognostic value and determinants of a hypointense infarct core in t2-weighted cardiac magnetic resonance in acute reperfused st-elevation-myocardial infarction. Circ Cardiovasc Imaging. 2011;4:354–362. doi: 10.1161/CIRCIMAGING.110.960500. [DOI] [PubMed] [Google Scholar]
- 25.Mather AN, Fairbairn TA, Ball SG, Greenwood JP, Plein S. Reperfusion haemorrhage as determined by cardiovascular mri is a predictor of adverse left ventricular remodelling and markers of late arrhythmic risk. Heart. 2011;97:453–459. doi: 10.1136/hrt.2010.202028. [DOI] [PubMed] [Google Scholar]
- 26.Kali A, Kumar A, Cokic I, Tang RL, Tsaftaris SA, Friedrich MG, Dharmakumar R. Chronic manifestation of postreperfusion intramyocardial hemorrhage as regional iron deposition: A cardiovascular magnetic resonance study with ex vivo validation. Circ Cardiovasc Imaging. 2013;6:218–228. doi: 10.1161/CIRCIMAGING.112.000133. [DOI] [PubMed] [Google Scholar]
- 27.Cokic I, Kali A, Wang X, Yang HJ, Tang RL, Thajudeen A, Shehata M, Amorn AM, Liu E, Stewart B, Bennett N, Harlev D, Tsaftaris SA, Jackman WM, Chugh SS, Dharmakumar R. Iron deposition following chronic myocardial infarction as a substrate for cardiac electrical anomalies: Initial findings in a canine model. PLoS One. 2013;8:e73193. doi: 10.1371/journal.pone.0073193. [DOI] [PMC free article] [PubMed] [Google Scholar]
- 28.Jackowski C, Christe A, Sonnenschein M, Aghayev E, Thali MJ. Postmortem unenhanced magnetic resonance imaging of myocardial infarction in correlation to histological infarction age characterization. Eur Heart J. 2006;27:2459–2467. doi: 10.1093/eurheartj/ehl255. [DOI] [PubMed] [Google Scholar]
- 29.Jackowski C, Schwendener N, Grabherr S, Persson A. Postmortem cardiac 3t magnetic resonance imaging: Visualizing the sudden cardiac death? J Am Coll Cardiol. 2013;62:617–29. doi: 10.1016/j.jacc.2013.01.089. [DOI] [PubMed] [Google Scholar]
- 30.Dharmakumar R, Koktzoglou I, Li D. Factors influencing fast low angle positive contrast steady-state free precession (flaps) magnetic resonance imaging. Phys Med Biol. 2007;52:3261–3273. doi: 10.1088/0031-9155/52/11/021. [DOI] [PubMed] [Google Scholar]
- 31.Bieri O, Patil S, Quick HH, Scheffler K. Morphing steady-state free precession. Magn Reson Med. 2007;58:1242–1248. doi: 10.1002/mrm.21421. [DOI] [PubMed] [Google Scholar]
- 32.Bankier AA, Levine D, Halpern EF, Kressel HY. Consensus interpretation in imaging research: Is there a better way? Radiology. 2010;257:14–17. doi: 10.1148/radiol.10100252. [DOI] [PubMed] [Google Scholar]
- 33.Bondarenko O, Beek AM, Hofman MB, Kuhl HP, Twisk JW, van Dockum WG, Visser CA, van Rossum AC. Standardizing the definition of hyperenhancement in the quantitative assessment of infarct size and myocardial viability using delayed contrast-enhanced cmr. J Cardiovasc Magn Reson. 2005;7:481–485. doi: 10.1081/jcmr-200053623. [DOI] [PubMed] [Google Scholar]
- 34.Yan AT, Shayne AJ, Brown KA, Gupta SN, Chan CW, Luu TM, Di Carli MF, Reynolds HG, Stevenson WG, Kwong RY. Characterization of the peri-infarct zone by contrast-enhanced cardiac magnetic resonance imaging is a powerful predictor of post-myocardial infarction mortality. Circulation. 2006;114:32–39. doi: 10.1161/CIRCULATIONAHA.106.613414. [DOI] [PubMed] [Google Scholar]
- 35.Aquaro GD, Nucifora G, Pederzoli L, Strata E, De Marchi D, Todiere G, Andrea B, Pingitore A, Lombardi M. Fat in left ventricular myocardium assessed by steady-state free precession pulse sequences. Int J Cardiovasc Imaging. 2012;28:813–821. doi: 10.1007/s10554-011-9886-2. [DOI] [PubMed] [Google Scholar]
- 36.Sekihara K. Steady-state magnetizations in rapid nmr imaging using small flip angles and short repetition intervals. IEEE Trans Med Imaging. 1987;6:157–164. doi: 10.1109/TMI.1987.4307816. [DOI] [PubMed] [Google Scholar]
- 37.Friedrich MG, Abdel-Aty H, Taylor A, Schulz-Menger J, Messroghli D, Dietz R. The salvaged area at risk in reperfused acute myocardial infarction as visualized by cardiovascular magnetic resonance. Journal of the American College of Cardiology. 2008;51:1581–1587. doi: 10.1016/j.jacc.2008.01.019. [DOI] [PubMed] [Google Scholar]
- 38.Matsumoto H, Matsuda T, Miyamoto K, Shimada T, Mikuri M, Hiraoka Y. Peri-infarct zone on early contrast-enhanced cmr imaging in patients with acute myocardial infarction. Jacc-Cardiovasc Imag. 2011;4:610–618. doi: 10.1016/j.jcmg.2011.03.015. [DOI] [PubMed] [Google Scholar]
- 39.Amado LC, Gerber BL, Gupta SN, Szarf G, Schock R, Nasir K, Kraitchman DL, Lima JAC. Accurate and objective infarct sizing by contrast-enhanced magnetic resonance imaging in a canine myocardial infarction model. Journal of the American College of Cardiology. 2004;44:2383–2389. doi: 10.1016/j.jacc.2004.09.020. [DOI] [PubMed] [Google Scholar]
- 40.Kali A, Tang RL, Kumar A, Min JK, Dharmakumar R. Detection of acute reperfusion myocardial hemorrhage with cardiac mr imaging: T2 versus t2. Radiology. 2013;269:387–395. doi: 10.1148/radiol.13122397. [DOI] [PMC free article] [PubMed] [Google Scholar]
- 41.Kumar A, Green JD, Sykes JM, Ephrat P, Carson JJ, Mitchell AJ, Wisenberg G, Friedrich MG. Detection and quantification of myocardial reperfusion hemorrhage using t2*-weighted cmr. JACC Cardiovasc Imaging. 2011;4:1274–1283. doi: 10.1016/j.jcmg.2011.08.016. [DOI] [PubMed] [Google Scholar]
- 42.Klem I, Weinsaft JW, Bahnson TD, Hegland D, Kim HW, Hayes B, Parker MA, Judd RM, Kim RJ. Assessment of myocardial scarring improves risk stratification in patients evaluated for cardiac defibrillator implantation. J Am Coll Cardiol. 2012;60:408–420. doi: 10.1016/j.jacc.2012.02.070. [DOI] [PMC free article] [PubMed] [Google Scholar]
- 43.Kwon DH, Smedira NG, Rodriguez ER, Tan C, Setser R, Thamilarasan M, Lytle BW, Lever HM, Desai MY. Cardiac magnetic resonance detection of myocardial scarring in hypertrophic cardiomyopathy: Correlation with histopathology and prevalence of ventricular tachycardia. J Am Coll Cardiol. 2009;54:242–249. doi: 10.1016/j.jacc.2009.04.026. [DOI] [PubMed] [Google Scholar]
- 44.Schmidt A, Azevedo CF, Cheng A, Gupta SN, Bluemke DA, Foo TK, Gerstenblith G, Weiss RG, Marban E, Tomaselli GF, Lima JA, Wu KC. Infarct tissue heterogeneity by magnetic resonance imaging identifies enhanced cardiac arrhythmia susceptibility in patients with left ventricular dysfunction. Circulation. 2007;115:2006–2014. doi: 10.1161/CIRCULATIONAHA.106.653568. [DOI] [PMC free article] [PubMed] [Google Scholar]
- 45.Debakker JMT, Vancapelle FJL, Janse MJ, Wilde AAM, Coronel R, Becker AE, Dingemans KP, Vanhemel NM, Hauer RNW. Reentry as a cause of ventricular-tachycardia in patients with chronic ischemic heart-disease - electrophysiologic and anatomic correlation. Circulation. 1988;77:589–606. doi: 10.1161/01.cir.77.3.589. [DOI] [PubMed] [Google Scholar]
- 46.Bernier M, Hearse DJ, Manning AS. Reperfusion-induced arrhythmias and oxygen-derived free radicals. Studies with "anti-free radical" interventions and a free radical-generating system in the isolated perfused rat heart. Circ Res. 1986;58:331–340. doi: 10.1161/01.res.58.3.331. [DOI] [PubMed] [Google Scholar]
- 47.Schenck JF. The role of magnetic susceptibility in magnetic resonance imaging: Mri magnetic compatibility of the first and second kinds. Med Phys. 1996;23:815–850. doi: 10.1118/1.597854. [DOI] [PubMed] [Google Scholar]
- 48.Cameron CS, Roberts WC. Clinical and necropsy findings in patients with calcified myocardial infarcts. Proc (Bayl Univ Med Cent) 2004;17:420–424. doi: 10.1080/08998280.2004.11928007. [DOI] [PMC free article] [PubMed] [Google Scholar]
- 49.Pieroni M, Smaldone C, Bellocci F. Cihakova D, editor. Myocarditis presenting with ventricular arrhythmias: Role of electroanatomical mapping-guided endomyocardial biopsy in differential diagnosis. Myocarditis. InTech. 2011 [Google Scholar]
Associated Data
This section collects any data citations, data availability statements, or supplementary materials included in this article.