Abstract
We present a method that quantifies point-wise changes in surface morphology of the bones of the human wrist. The proposed method, referred to as Registration-based Bone Morphometry (RBM), consists of two steps: an atlas selection step and an atlas warping step. The atlas for individual wrist bones was selected based on the shortest l2 distance to the ensemble of wrist bones from a database of a healthy population of subjects. The selected atlas was then warped to the corresponding bones of individuals in the population using a non-linear registration method based on regularized l2 distance minimization. The displacement field thus calculated showed local differences in bone shape that then were used for the analysis of group differences. Our results indicate that RBM has potential to provide a standardized approach to shape analysis of bones of the human wrist. We demonstrate the performance of RBM for examining group differences in wrist bone shapes based on sex and between those of the right and left wrists in healthy individuals. We also present data to show the application of RBM for tracking bone erosion status in rheumatoid arthritis.
Introduction
The human wrist consists of eight carpal bones, the distal aspects of the bones of the forearm (radius and ulna), and the proximal aspects of the five metacarpal bones. The skeletal maturation process involves changes in wrist bone morphometry [1], [2], and may influence bone fragility in adulthood [3]. The shape of specific carpal bones, such as those of the trapeziometacarpal joint of the thumb (the trapezium and the first metacarpal) and the scapholunate joint (scaphoid and lunate), may lead to altered biomechanics, and predispose to debilitating conditions such as wrist instability, or osteoarthritis of those joints [4]–[7]. There is therefore medical rationale to better understand the implications of bone shape and its variation in disease. Further, there are numerous factors such as age [8], [9], sex [10], [11], metabolic status [12], and genetic and environmental factors [13], [14] that may influence bone shape and there is interest in documenting the influence of these factors individually and collectively. Information regarding bone shape is important in surgical repair [15], as well as in the design and choice of implants or prosthetics [16], [17]. In Rheumatoid Arthritis (RA), carpal bone erosion is a common pathology and erosive changes must be tracked over time to monitor disease progression [18], [19] or to assess response to therapy [20]. In paleoanthropology, carpal bone morphology is considered an excellent indicator of phylogenetic relationships among mammals, and there is interest in being able to quantify changes in bone shapes due to evolution [21]. In summary there is demand for developing standardized quantitative methods that have a high sensitivity to changes in bone shape and enable the aforementioned analyses in a reproducible manner. The development of such a method is the goal of this work.
A body of literature on methods for 3D segmentation of the individual carpal bones from anatomical images such as X-ray computed tomography (CT) or Magnetic Resonance Imaging (MRI) already exists [22]–[25]. Using segmentations of the individual wrist bones from anatomical images of the different poses of the hand, research groups have generated kinematic data with or without the use of intra-subject registration [26]– [31]. In the context of shape analysis of the carpal bones, van de Giessen et al. used statistical shape models (SSM) to describe the morphometric variation of the scaphoid and lunate bones and their statistical distribution [29], [32] from an empirically derived mean bone shape and principal component analysis. This method was further extended by using local variations instead of using the principal components of the variation [6]. A limitation of this approach is that its accuracy was dependent on the quality and size of the training dataset and there was no guarantee that the derived mean bone shapes represented the heterogeneity in a given population. Further, these approaches were not tested for enabling quantitative comparisons based on carpal bone shape between populations. We proposed an approach for shape analysis of the individual carpal bones based on the global point signature (GPS) metric [33]. In this method an individual carpal bone shape was parameterized based on the eigen system of the Laplace-Beltrami operator. GPS coordinates were calculated for each bone and were compared across populations. The advantages of this method are that the GPS metric is highly sensitive to global bone shape and has desirable properties for shape comparisons such as the isometric invariance to Euclidean transformations. The limitation is that it provides a metric associated with global bone shape alone and it is non-trivial to derive a robust metric for local shape that may be needed for biomechanical analysis. Recently polar histograms of curvature were used to quantify the shapes of the bones of the trapeziometacarpal joint [34]. This method enabled the comparison of the magnitude of the principal curvatures of the bones, but not the direction, which may be necessary in the analysis of arthritic joints. Chen et al. proposed a framework for the automated generation of statistical pose of the bones of the human wrist and demonstrated the performance of the method of wrist bone segmentation [35]. This method however focused heavily on bone pose estimation in the context of dissociation, but was not used for the analysis of shape differences between the wrist bones across the population. There is also no guarantee that the resulting statistical pose model is biomechanically stable, as it does not belong to a single, healthy, functioning individual.
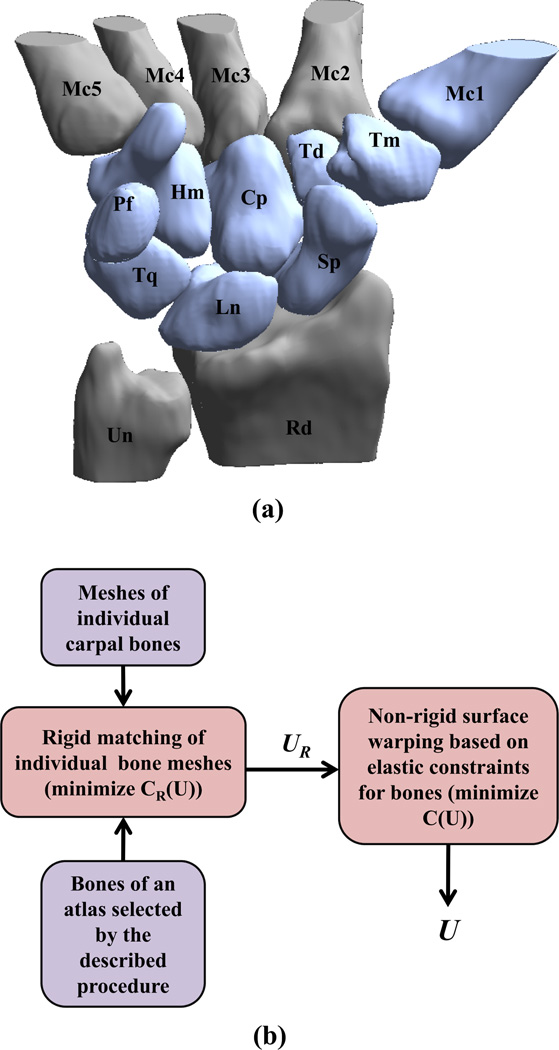
Registration-based morphometry refers to a technique of performing analysis of changes in the form of objects using image registration with a standardized model such as an atlas of normal healthy anatomy or a reference such as images of a single subject from the population to be studied. In this paper we describe a method termed Registration-based Bone Morphometry (RBM), for performing point-wise change analysis for the eight carpal and first metacarpal bones of the human wrist. The method uses co-registration of the template (a preselected atlas) to the target (bone surface for individuals from the population) to generate a quantitative map of morphometric change for individual bones. A method for the selection of the atlas (an individual subject whose wrist bones may collectively represent those in the population) is presented. A method using surface-based l2 distance minimization for performing rigid and non-rigid registration between a specific bone in the atlas and a target bone of a subject in the population is proposed. The application of the method is demonstrated for measuring differences in the shapes of the carpal bones based on sex and those of the right and left wrists from data obtained from a publicly-available database of healthy carpal bone shapes [36] (figure 1 (a)). The utility of RBM is also demonstrated in the context of tracking bone erosion status in RA.
Figure 1.
Carpal bone anatomy and method for calculating shape differences; (a) a 3D rendering showing the bones of the right wrist in a representative healthy female, namely the scaphoid (Sp), lunate (Ln), triquetrum (Tq), radius (Rd), trapezium (Tm), trapezoid (Td), capitate (Cp), pisiform (Pf), ulna (Un), hamate (Hm), and the adjoining metacarpals (Mc1-5), obtained from the carpal database. The bones shown in blue were analyzed in this paper; and (b) flowchart showing the atlas warping procedure to calculate shape differences.
II. Materials and Methods
A. Carpal bone data
The bone surfaces used for analysis were obtained for the right and left wrist for healthy women (n=15, average age: 24.4 years, range: 21–28 years) and healthy men (n=14, average age: 25 years, range: 22–28 years) from a publicly-available database [36]. All eight carpal bones and the first metacarpal bone (corresponding to that of the thumb) were chosen for our analysis. Data for each bone was in the form of the mesh connectivity list and vertex locations for surface tessellation elements, with triangles as prototiles. The bone surfaces from the database possessed dense triangulation for the X-ray computed tomography slices used to create the surfaces, while the sampling was sparse between slices. For generating an improved and more uniform sampling that is conducive to image registration and shape analysis [37], we used the qslim tool (version 2.1, http://mgarland.org/software/qslim21.html) [38] for resampling the bone surfaces such that the individual bone surfaces were represented by approximately 5000 nodes and 3000 triangles (a factor of over three lower than the raw surface data). We analyzed the impact of choosing a denser sampling than that described here on our results, and our outcomes are detailed in section III-A. Preference was given to the qslim method because it is capable of producing a surface mesh that is reasonably uniform with respect to the geometry of the surface, as opposed to the reducepatch method available in MATLAB®, which resamples only from the existing nodes of the input surface mesh.
B. Atlas selection
Our atlas used a single subject from the population whose wrist bones were closest in terms of the distance metric defined in (1) to the rest of the population. We adopted this approach because it has the potential for providing a stable template for biomechanical studies, where the individual wrist bones must be anatomically and motionally consistent [39], [40]. For the purpose of defining a distance between the same carpal bone across two individuals, we first normalized each bone by its surface area by dividing the X, Y, and Z coordinates of its triangular mesh by the square root of the bone surface area. This normalization leads to unit surface area in the normalized coordinates. We define an l2 distance metric between any two closed surfaces ∂A and ∂B as follows:
| (1) |
where p and e are points on the surfaces ∂A and ∂B respectively and the Area is the sum of the areas of individual triangles of the mesh. This metric finds corresponding closest pairs of points on the two surfaces and measures the distance between them to define distance between the two bone surfaces, i.e., for each location on the surface ∂B we find the closest point on the surface ∂A in the l2 sense and vice versa. For atlas selection, the following steps were undertaken:
1) Pairwise rigid-registration
This was performed for each specific bone for all S = 29 subjects (both women and men) based on the iterative closest point (ICP) method [37]. The iterations were terminated when the mismatch l2 distance decrease was below an empirically chosen threshold of 10−3 mm for the whole surface. This method iteratively estimated the transformations (translation, rotation) needed to minimize the distance between the nodes representing the meshes of the two surfaces. Let represent the surface nodes of the ith subject for the bone type indexed as α. Then, we performed rigid registration of bones of one subject with all others, individually for each of the bones, by computing the rigid displacement field defined at each vertex.
2) Pairwise distance calculation
Let , indicate the distance between a bone of the subject i and that of the rigidly warped subject j. is the deformation vector field defined at all the vertices. The mean distance between subject i and rest of the subjects for all B = 9 bones was calculated as
| (2) |
3) Atlas selection
The individual for whom the minimum mean distance mi from the rest of the bones was obtained was selected as the atlas, i.e. m = arg min{mi}. If a single bone must be analyzed for shape comparison, Eq. 2 can be employed with B = 1.
C. Atlas warping
Our template was the surface of a wrist bone from an atlas selected based on the procedure described in II-B. The target surfaces were the corresponding carpal bones for the remaining subjects (13 men and 15 women, since a 26-year old male was chosen as the atlas by the procedure described in section II-B) that were available from the database. Our atlas warping method consisted of two steps: rigid registration of the atlas bone to that of an individual subject (target), and non-rigid surface registration between the rigidly registered atlas and target to localize regional changes in surface topography. We provide a detailed description of these steps here.
1) Pairwise rigid registration of the bone surfaces
Rigid registration of individual carpal bone surfaces from the atlas to those of the individual subjects was conducted to account for differences in the pose of the wrist. This used the ICP algorithm described in II-B. The computed transformation at each iteration was applied to the atlas. The algorithm was terminated when the number of iterations reached an empirically chosen value of 100.
2) Surface registration
We designated the surface of the atlas to be registered after the rigid transformation as ∂ΩR, and the target as ∂ΩT. Our objective, then, was to deform ∂ΩR such that the la2 distance metric defined in (1) is minimized. Additionally, we wanted the resulting displacement field for this operation U to be smooth, such that the deformed surface ∂ΩR + U remained smooth. This was achieved by using the Laplace-Beltrami regularizer on the surface displacement field [41]-[43]. For this purpose, we performed iterative minimization for estimation of the deformation field U and updated the atlas surfaces by iteratively applying it to the atlas surface. The cost function C was defined as:
where Δ denotes the discrete Laplace-Beltrami operator. We used a finite element method (FEM) described in [43] for the discretization of the Laplace-Beltrami operator on the surface meshes with linear elements. The parameter β determines the tradeoff between smoothness of the deformation field and the exactness of matching. Empirically, this parameter was chosen to be 0.1. The minimization of the cost function was performed by gradient descent as described in [41], and resulted in a displacement vector field Û. The search algorithm was based on the Qhull algorithm [44] and was implemented in MATLAB®. The displacement field Û thus obtained was then applied to ∂ΩR at each iteration to get the surface ∂ΩR + Û that matched the target surface ∂ΩT.
D. Sensitivity of ICP to rigid motion of the bones
We evaluated the sensitivity of the ICP method used for rigid alignment by varying poses of the individual wrist bones. Typically static wrist scans obtained by tomographic imaging techniques require the wrist and hand to be placed in a standardized posture, therefore translation or angular rotation differences are expected to be relatively small [35]. For all bones we applied a 10 mm translation in all three directions (total displacement of mm). We then applied rotations about the x-axis simulating extreme ulnar-radial deviation and z-axis simulating extreme flexion-extension maneuver, ranging from −90 to 90 degrees in 100 steps for each bone. The rotation range typically traversed by the carpal bones is much smaller than this range (~±10 degrees) [45]. The transformed bones were then coregistered to ones in the original pose using ICP algorithm and root-mean-squared (RMS) distance between their nodes was analyzed as a function of the angle of rotation.
E. Carpal bone shape analysis
Analysis was conducted to demonstrate the application of RBM for the comparison of representative carpal bones based on sex, and for the comparison of carpal bones of the left and right wrists for individuals, as described in the subsections below.
1) Shape analysis based on sex
An atlas was selected using the method described in section II-B, and was warped to the individual bones for each subject as described in section II-C. After warping, a set of vector fields corresponding to the computed deformation fields, one per subject, at every node on the mesh of each atlas bone was obtained. The mean magnitude and variance maps for the computed vector fields at each node of the atlas within each group (men and women, separately) were estimated. To perform bone shape comparisons based on sex, our null hypothesis was that there are no significant shape differences between the wrist bones of men and women, without and with normalization for area (scaling) differences. We used multivariate analysis of variance (MANOVA) of the x, y and z components of the deformation field vector at each surface point. This resulted in p-values for each surface point which were corrected for multiple comparisons based on the Benjamini-Hochberg false discovery rate (FDR) with α = 0.01 [46]. This procedure was repeated for each bone, hence finding a suitable FDR-threshold for that bone. Surface maps indicating the FDR-corrected p-value distribution reveal areas on the bone surfaces where significant shape differences based on sex existed for the analyzed group. We repeated this analysis after dividing the surface coordinates of each bone surface by the square root of the surface area of that bone, to account for surface area differences, that is, the normalized target and atlas surface coordinates were . Dividing the coordinates by square root of the surface area leads to unit area bone surface as explained in section II-B.
2) Shape comparison between the bones of the left and right wrist
In order to compare the bones of the left and right wrists for each individual, independent of sex, we employed reflected bones of the left wrist already available in the database. We co-registered a specific wrist bone of the left wrist to the corresponding bone of the right wrist for all subjects using the warping method described in II-C. The resulting deformation was transferred from the left bone of the individual subject to the atlas by another co-registration This process yielded at every point on the atlas bone, a 3D deformation vector corresponding to each of the subjects. The test statistic in this case was the difference between deformation vectors (transferred to the atlas) for left and right wrist bones. At every surface node, we tested if the mean of this test statistic was the zero vector using the Hoteling T2 test. The resulting p-values for each surface node were corrected for multiple comparisons using the Benjamini-Hochberg FDR with α =0.01 [46].
F. Alternate atlas selections
In order to study the effect of atlas selection on shape comparison, we evaluated three possible alternative atlases: (1) carpal bone shapes of a male subject randomly selected from the set that excluded the subject chosen as the atlas using the method in section II-B, (2) carpal bone shapes of a randomly selected female subject, and (3) an atlas obtained as a spatial average of the individual bones. For generating this latter atlas, we averaged the displacement field that warps the atlas bones from section II-B to the corresponding bones of all the subjects. This average displacement field was then applied to each atlas bone to generate a new atlas, called the averaged bone atlas. Since the average atlas bone surfaces were generated by population averaging, they tended to be spatially smoother than those of the bones of individual subjects. We repeated the shape analysis based on sex using these atlases. Comparing effect size for each of these atlases relative to that described in section II-C provides a measure of relative sensitivity of each atlas to shape differences. The reason for adopting this approach is that an atlas that better represents the population should result in a better sensitivity in such a comparison resulting in a larger effect size.
G. Detection and follow-up of erosive changes to carpal bones
In Rheumatoid Arthritis (RA), the joints of the wrist provide an early picture of disease [47], [48]. The most common anatomical consequence of RA is bone erosion [49], [50]. The carpal bones most commonly affected are the capitate, triquetrum, lunate and scaphoid. Change in carpal bone erosion status correlates well with clinical response to RA therapy [51]–[53]. A range of therapies that directly influence bone erosion are now available [50]. Detection and quantification of erosive changes taking place for the carpal bone over time is therefore of high clinical interest.
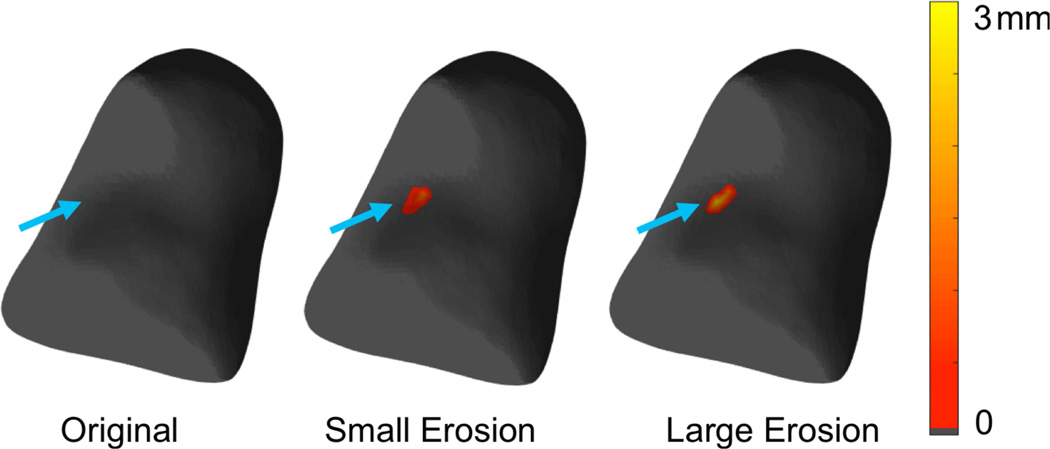
We simulated two realistic clinical situations where the ground truth is known. The first is where an RA patient presents with an existing bone erosion in the clinic and the clinical task if the detection of changes in erosive status after starting therapy to determine whether the patient is a responder or non-responder. The second situation corresponds to an RA patient who is a non-responder to therapy and develops a new erosion. A realistic erosion (volume 3.43 mm3, maximum depth≈1.5 mm) was simulated on the volar aspect of the capitate representing a bone of a patient with RA [25], [54]. For this purpose, a binary mask was created for the bone and was eroded manually at an anatomically relevant location [55] using BrainSuite [56]. The same erosion was expanded further (volume 6.94 mm3, maximum depth ≈ 2.5 mm) to simulate progressive disease [55]. To study the sensitivity of RBM, we warped the capitate from our atlas to the bone surface from baseline, as well as to the eroded surfaces using the method described in section II-C. The difference in the displacement maps was denoted as a pseudo-colored erosion map. The comparison of baseline status (no erosion) with the one with a new erosion emulates the second clinical scenario of developing a new erosion. The monitoring of disease with a pre-existing erosion emulates the first clinical situation.
We then performed an initial evaluation of RBM on clinical data. Five patients with established RA (average baseline Disease Activity Score28 or DAS28 of 3.65) who were candidates for receiving the tumor necrosis factor-α blocker etanercept underwent extremity wrist CT scanning at baseline (a mean of 10 days before initiation of therapy) and 45 ± 17 days after starting treatment. Written informed consent was obtained based on the guidelines of the UC Davis Institutional Review Board. The scanning details are reported elsewhere [57], [58]. The CT voxel size was 0.32 × 0.32 × 0.26 mm. We chose a single, most affected bone from each subject’s CT to demonstrate the feasibility and utility of our method. These bones were the scaphoid (patient 1), capitate (patient 2), lunate (patient 3) and the triquetrum (patients 4 and 5). Bone segmentation was carried out in a semi-automated manner using the BrainSuite software (http://brainsuite.org) [56]. This procedure involved a single step of intensity thresholding, followed by choosing the connected component associated with each the selected bone. Dilation and erosion operations were then performed to delineate the bone. The details of this procedure are reported in [59]. The segmentation procedure was repeated for the follow-up scan. The bone outlines were verified by a fellowship-trained, board-certified musculoskeletal radiologist with over 15 years of experience. The procedure described in Sec. II-C was applied to warp the corresponding atlas bone to the bone surfaces from baseline and follow-up and deformation fields were computed. The difference between these two deformation field was then computed as a measure of change in the baseline surface. The direction of the change vector was compared to the surface normal to determine the sign of the change at each point. Clinical response was measured by changes to the DAS 28 at 12 weeks after initiation of therapy.
III. Results
A. Impact of surface sampling based on qslim
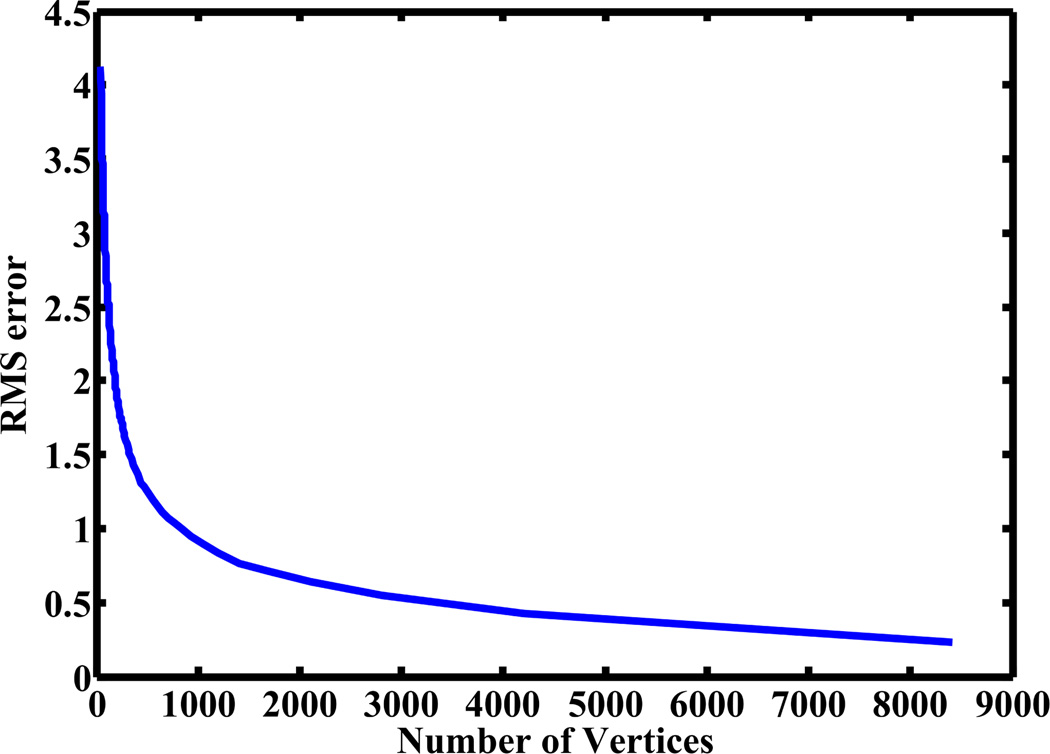
In figure 2 we show the impact of re-sampling on the accuracy of a representative bone surface from the database using qslim. Based on these results we chose a sampling density that resulted in a l2 distance (1) with the original surface of < 0.5 mm.
Figure 2.
Root-mean-squared error in mm (l2 distance) between a representative bone surface from the database and that obtained from qslim as a function of the total number of nodes.
B. Atlas selection
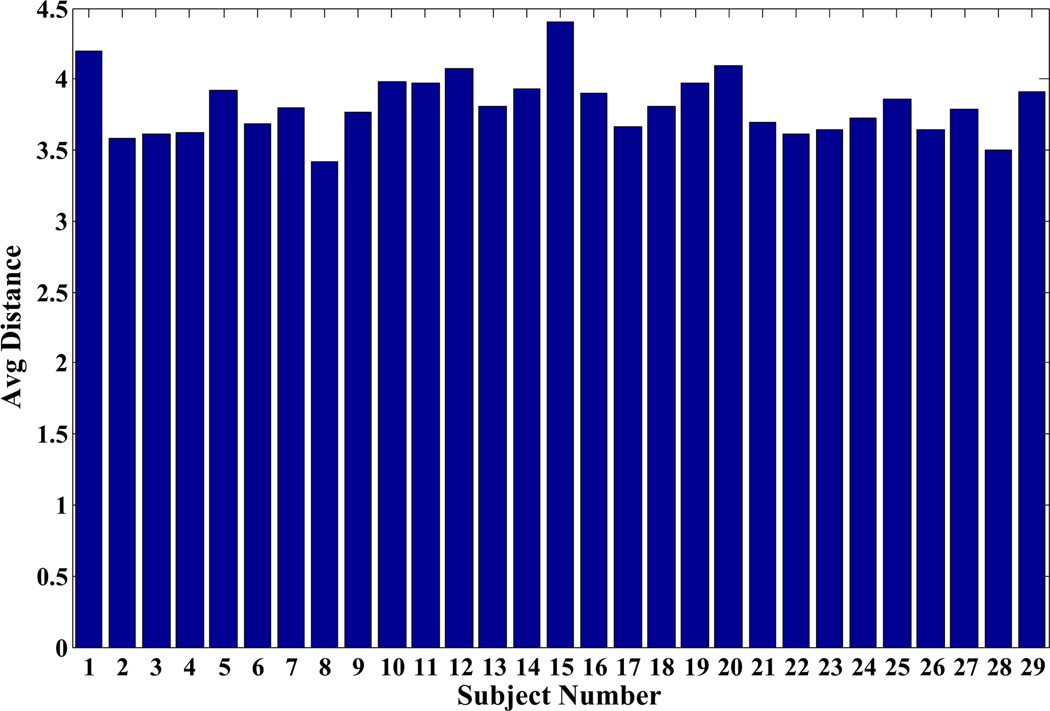
In figure 3 we show the average distance calculated between all the wrist bones of each subject and those of other subjects in the group for the left wrist. The results for the right wrist were similar. Based on the results for both left and right wrists, we selected a single subject as an atlas from the database as described in section II-B. This subject was a 26-year old male (subject #8 in the dataset). For this subject the distance from the rest of the population was m = 3.4 mm, while it was an average of 4.1 mm from women and 2.9 mm from men respectively. We used bones of both left and right wrist from the atlas subject separately as a reference. The atlas selection procedure in our case took a total of 3 hrs. The atlas selection procedure involves ICP algorithm and computation of l2 distance for every pair of subjects but did not involve non-linear warping.
Figure 3.
Average l2 distance (mm) as defined in (1) between the bones of one subject and the remaining subjects. Subjects 1–14 are men and 15–29 are women.
C. Atlas warping
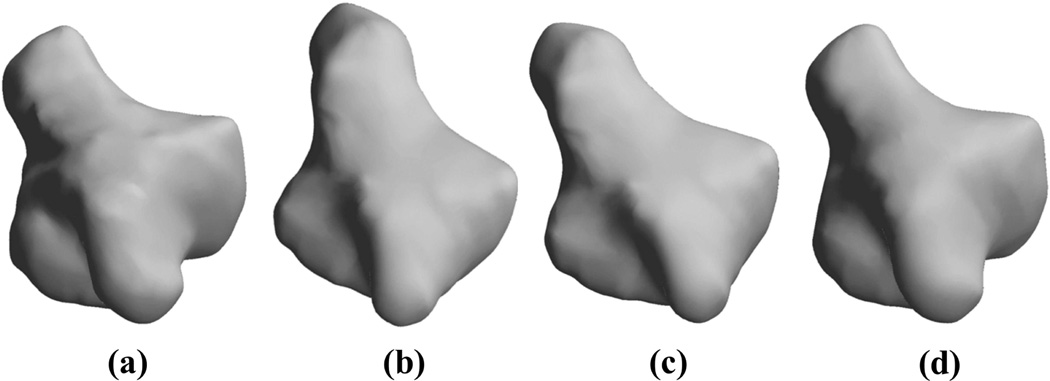
We registered the atlas to the bones of individual subjects using the procedure described in sections II-B and II-C. The computation of the 3D deformation field in MATLAB took an average of 15 min on a computer with Intel i7 CPU and 8GB memory for all the wrist bones analyzed. As a representative example, in one case the rigid warping using ICP reduced the root-mean squared error between the template and target by 65% (from 9.1 mm to 4.1 mm per vertex) and the nonrigid warping reduced the outstanding error by 93% (from 4.1 mm to < 0.3 mm). Figure 4 also shows the warping of the atlas (template) to the bone of an individual from the cohort (target).
Figure 4.
Atlas warping for the trapezium; (a) the target, (b) the atlas, (c) rigidly-registered atlas after the application of the ICP-based transform, (d) warped atlas after application of the atlas warping procedure. Our results showed that 100 iterations of the atlas warping procedure provided excellent registration with an error of <0.5 mm.
In Table I we show the the root-mean-squared error between the bone surfaces for the atlas and those of all subjects before RBM, after rigid registration by ICP, and after the completion of RBM. A low RMS error (<0.25 mm) results, for all bones but the first metacarpal, after the application of RBM indicating accurate warping. In the database used, the distal aspect of the first metacarpal is truncated due to the limited field of view of the scanner used. For this bone, our method resulted in a high error between the warped atlas and all subjects overall but this error was localized to the distal (truncated) aspect of the first metacarpal bone.
Table I.
The mean(STD DEV) of the RMS error (in MM) between the bone surfaces of the atlas and subjects in the database before RBM, after ICP and after RBM.
| Bone Name | Before RBM | After ICP | After RBM |
|---|---|---|---|
| Scaphoid | 30.29(23.03) | 0.98(0.35) | 0.21(0.02) |
| Lunate | 30.77(23.61) | 0.89(0.27) | 0.18(0.04) |
| Triquetrum | 32.00(23.97) | 0.74(0.20) | 0.18(0.07) |
| Trapezium | 30.59(22.47) | 0.88(0.29) | 0.19(0.03) |
| Trapezoid | 31.86(23.68) | 0.80(0.26) | 0.21(0.10) |
| Capitate | 30.65(22.98) | 1.01(0.34) | 0.23(0.03) |
| Pisiform | 32.26(22.83) | 0.66(0.18) | 0.13(0.02) |
| Hamate | 30.64(21.97) | 0.99(0.26) | 0.21(0.04) |
| Metacarpal 1 | 32.61(21.71) | 3.53(1.33) | 1.52(2.12) |
D. Sensitivity of ICP to rigid motion of the bones
The RMS distance between bone surfaces registered by ICP and the original bone surfaces as a function of angle of rotations was analyzed. For a wide range of angles (<±50 degrees) ICP was able to recover the rotation and translation effectively with only numerical errors (magnitude < 10−3 mm) remaining in the coordinates. The error for ICP increases beyond this range but as noted earlier, due to standardization of wrist postures during imaging, we expect that the rotations required for the initial alignment will be small, indicating adequacy of the ICP algorithm. The computation time for ICP was < 1 min for one such pairwise registration.
E. Carpal bone shape analysis
RBM analysis was performed to demonstrate its application for the comparison of representative carpal bones based on sex, and for the comparison of carpal bones of the left and right wrists for individuals.
1) Carpal bone shape comparison based on sex
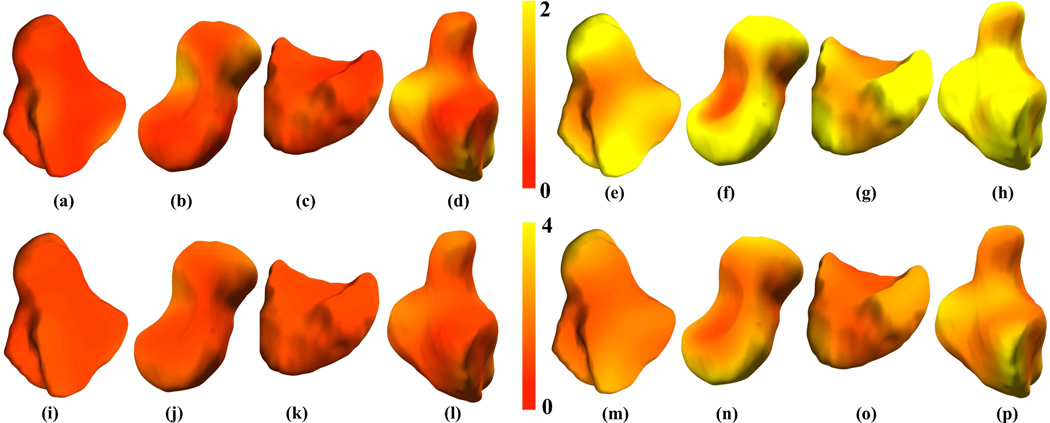
We separated the cohort into two populations based on sex - men (n=13) and women (n=15). The atlas in this case was the same as that described in section III-B. The bones from the atlas were co-registered to those of both men and women using the procedure described in section II-C and the displacement vectors were computed at each surface node. In figure 5 we show maps of the mean and standard deviations of the pointwise displacement for four representative bones of the right wrist for the both men and women. The results for the bones of the left wrist were similar, and as noted in section III-E2, the shape differences between the bones of the left and right wrists were insignificant. We then used the method described in section II-E1 to perform group comparisons based on sex.
Figure 5.
Carpal bone shape variation within groups shown for men (a-d, i-l) and women (e-h, m-p) as surface renderings of pointwise mean displacement (a-h, entire top row) and standard deviation (i-p, entire bottom row) maps for the trapezium (a, e, i, m), scaphoid (b, f, j, n), lunate (c, g, k, o) and hamate (d, h, l, p) respectively. These mean displacement (mm) and standard deviation (mm) maps were calculated from the carpal bones of n=13 men and n=15 women from the database. The atlas in this case was that selected in section III-B
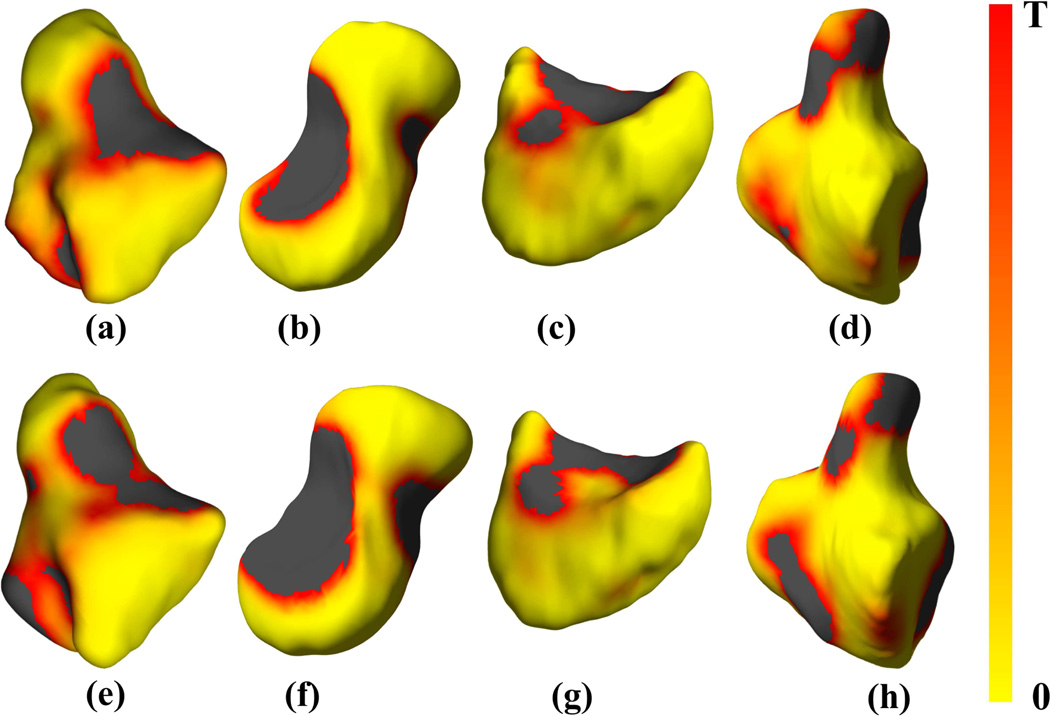
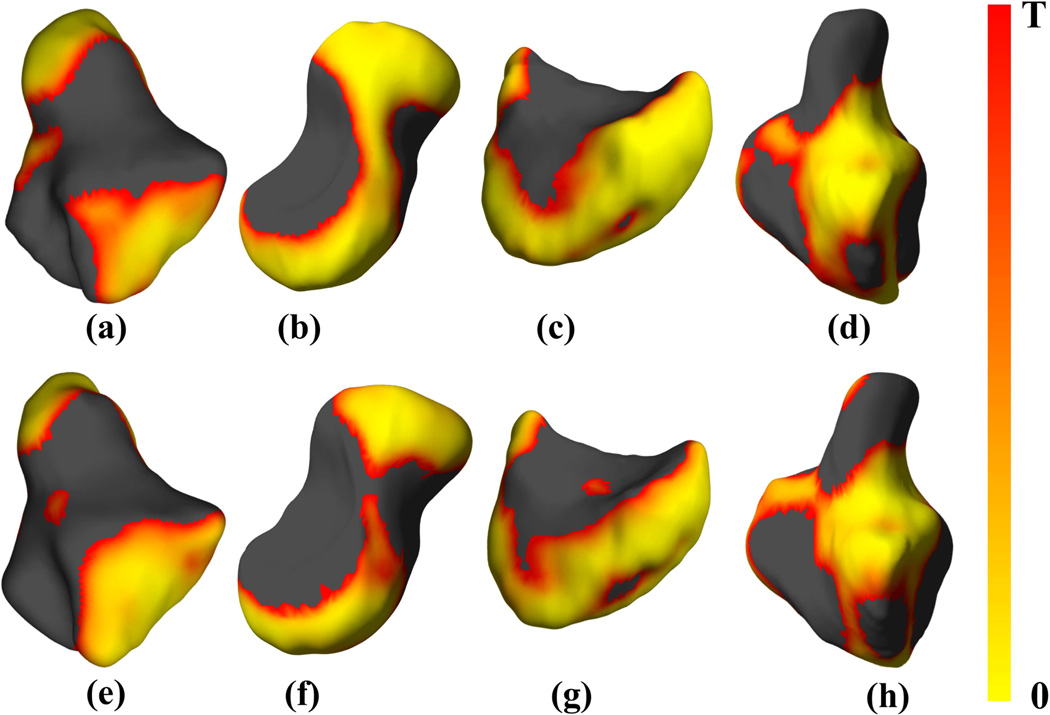
The results for four representative wrist bones are shown in figure 6, where the colorscale represents significance after thresholding at the FDR-corrected threshold. Yellow color in the maps indicates low p-values close to zero indicating significant difference between the bone shapes of men and women. Red color on the other hand indicates high p-values but below the FDR-corrected threshold. The dark gray colored region did not pass the significance test (p-values were above the FDR-corrected threshold). A similar analysis was also performed after normalizing the bone surface areas, as described in section II-E1. The results of this analysis are shown in figure 7. After area normalization, larger regions of the bone surfaces appear to show insignificant shape differences based on sex. Therefore bone size (scaling) appears to be a clear contributor to sex-based shape differences. The presence of regions of significant shape differences despite normalization however imply that size alone is insufficient for explaining the undelying sex-based bone shape differences.
Figure 6.
Shape differences in four representative carpal bones based on sex, showing FDR-corrected p-value maps of significant shape differences rendered on bone surfaces of the (a, e) trapezium, (b, f) scaphoid, (c, g) lunate and (d, h) hamate, respectively of the right (a-d, entire top row) and left (e-h, entire bottom row) wrist atlases. The black color indicates values that exceed the FDR-corrected p-value threshold T. The threshold values were as follows: (a) 0.0045, (b) 0.0039, (c) 0.0047, (d) 0.0042, (e) 0.0043, (f) 0.0043, (g) 0.0047, and (h) 0.0043.
Figure 7.
Shape differences after normalization by surface area in four representative carpal bones based on sex, showing FDR-corrected p-value maps of significant shape differences rendered on bone surfaces of the (a, e) trapezium, (b, f) scaphoid, (c, g) lunate and (d, h) hamate, respectively of the right (a-d, entire top row) and left (e-h, entire bottom row) wrist atlases. The black color indicates values that exceed the FDR-corrected p-value threshold T. The threshold values were as follows: (a) 0.0075, (b) 0.0059, (c) 0.0082, (d) 0.0067, (e) 0.0068, (f) 0.0070, (g) 0.0085, and (h) 0.0068.
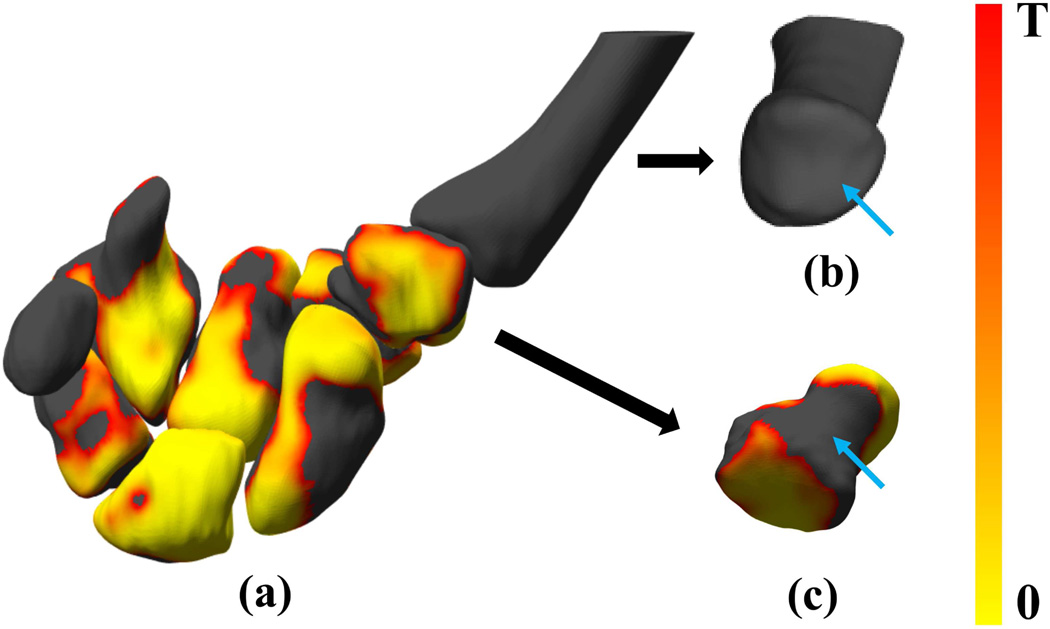
We further analyzed the ability of the method to allow the identification of shape differences across populations for specific regions of the bones such as articulating surfaces, that may be of interest for disease monitoring, biomechanics, surgery or rehabilitation (figure 8(a)). The trapeziometacarpal joint of the thumb (consisting of the first metacarpal bone and the trapezium) is a major target for osteoarthritis and the prevalence of osteoarthritis of this joint is 2–5 times higher in women than men [60]. We show the articulating surfaces of the first metacarpal bone and the trapezium in figure 8(b) and (c). While there appeared to be sex-based shape differences for the trapezium surface as a whole, these differences were not observed along its articulating surface with the first metacarpal bone. The articulating surface of the first metacarpal bone with the trapezium also showed insignificant bone shape differences based on sex.
Figure 8.
Shape comparison based on sex for articulating surfaces of interest; (a) the p-value maps for all 8 bones of the right wrist analyzed in the paper showing regions of statistically-significant shape differences based on sex; (b) the first metacarpal; and (c) the trapezium in a different orientation to highlight the articulating surfaces. Blue arrows indicate the articulating surfaces of the bones.
2) Shape comparison between the carpal bones of the right and left wrist
We did not find statistically significant differences between bone shapes of the right versus left wrists in the population (n=28). We performed this comparison at each point on the atlas bone as explained in section II-E2. Therefore RBM did not possess the power to show any differences in the bone shapes of the right and left wrist.
F. Alternate atlas selections
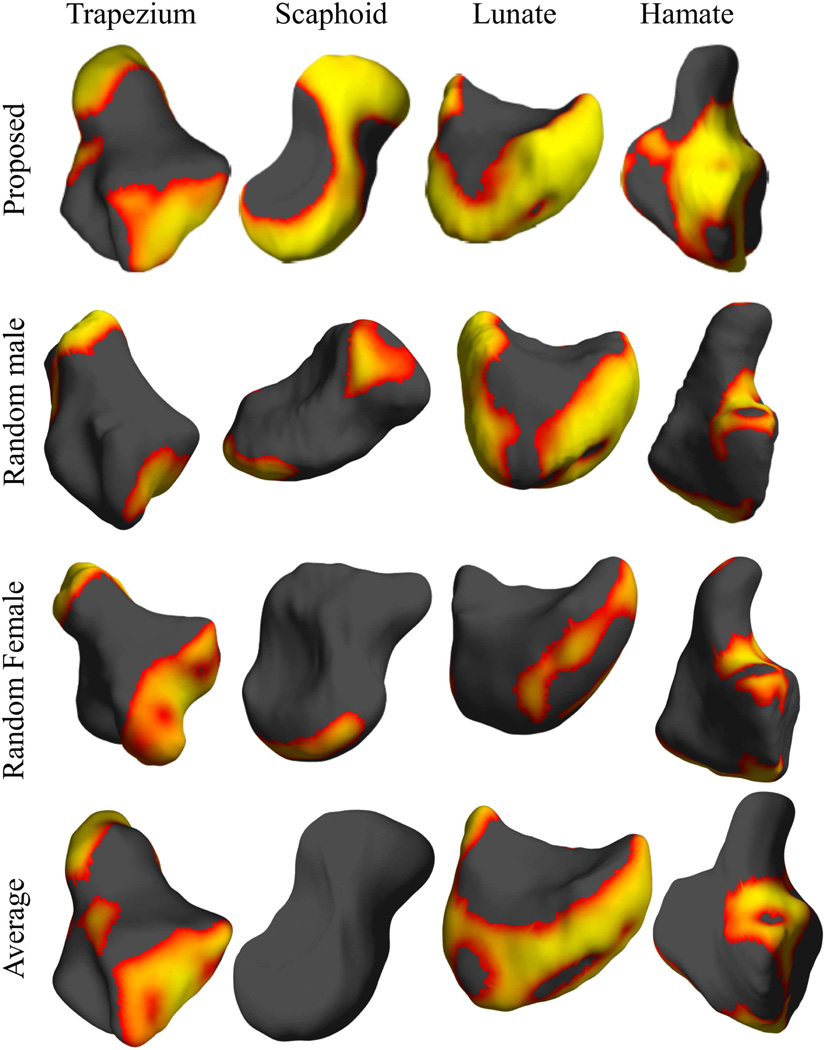
Representative results of shape analysis for the three alternate choices of atlases are depicted in figure 9, where we also show the percentage of the surface area of the bone that demonstrated significantly different shapes based on sex. All alternate atlases showed a smaller percentage area of significant shape difference based on sex compared to the atlas chosen using the method in section II-B. For the averaged atlas, the smaller percentage area of significance based on sex compared to the chosen atlas was possibly due to spatial averaging reducing anatomical detail. When the randomly selected male and female subjects were used as atlases, the resulting regions of significant difference were substantially less than either of the average bone atlas or the atlas selected using RBM.
Figure 9.
Comparison of atlases: each row shows the results obtained using different atlases. It can be seen that RBM yields the largest effect size compared to the other choices of the atlas. We use the same color scale relative to FDR corrected threshold as in Fig. 7.
G. Detection and follow-up of erosive changes to the carpal bones
A displacement map in mm computed using RBM mapped on the atlas bone is shown in figure 10. The maximum depth of erosion based on the displacement field, and the Voronoi-based tesselation method [54] was measured as 1.97 mm and 2.59 mm respectively. This example demonstrates the potential of RBM to detect new erosion, and quantitatively track erosive changes to the carpal bones.
Figure 10.
Detection and follow-up of erosive changes in Rheumatoid Arthritis; (a) a healthy capitate bone; (b) the erosion map in mm showing the location and depth of the erosion; (c) the erosion map in mm showing erosive progression.
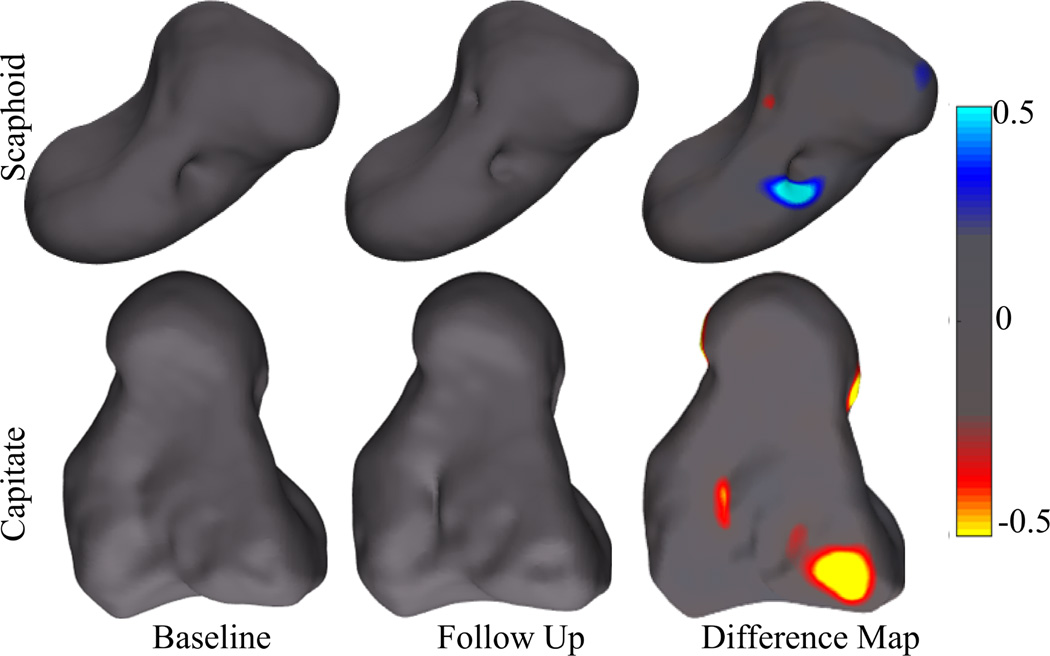
For the clinical study standard DAS28 change criteria were used to classify each subject as a responder or non-responder. Based on this criteria patient 2 was a non-responder to therapy, while patients 1, 3, 4 and 5 were a clinical responders. Figure 11 shows shape changes detected for the bones of patients 1 and 2. For patient 1 the scaphoid showed an area of increased bone repair, while the capitate bone of patient 2 showed areas of continuing bone erosion. For the other subjects the shape differences between the bones from baseline and those for follow-up were within the empirically-chosen threshold of [−0.2, 0.2] indicating insignificant shape differences.
Figure 11.
Change detection in clinical cases; Top row shows the scaphoid bone of patient 1 (responder) whereas the bottom row shows the capitate bone for patient 2 (non-responder). Regions of bone erosion and repair are shown in color.
IV. Discussion and Conclusions
We have described a method for performing morphometric analysis to localize and quantify shape differences in nine wrist bones of healthy subjects. The chosen cohort for demonstrating the performance of the method was of healthy volunteers from a publicly-available database who did not have significant pathological findings. RBM was therefore employed in the context of characterizing normal variation in healthy subjects. The database used however lacked information regarding handedness, body size, metabolic, genetic and environmental factors - all influential in the determination of bone shape - for the subjects and therefore these factors were not controlled for in our analyses. The two groups (women and men) however were in the same age range therefore no explicit age-related control was used. Our goal was not to develop a method for bone segmentation, rather to utilize already segmented bones for shape analysis.
This was a proof-of-principle study, and was conducted in a small sample. Our results indicate that for the trapeziometacarpal joint, while there are a number of regions on the trapezium surface where statistically significant shape differences exist based on sex, these differences do not appear to be along its articulating surface with the first metacarpal. The articulating surface of the first metacarpal bone with the trapezium also showed insignificant shape differences based on sex. Our results for the trapezium contradict those reported by North and Rutledge [61], which concluded that the trapezial articulating surface tended to be more flatter in women than men. Our findings showing insignificant shape differences for the trapezial articulating surface based on sex however corroborate the results recently reported in [62], where such analyses were conducted in a larger sample but using polar maps. There is a higher prevalance of osteoarthritis of the first carpometacarpal (CMC) joint in women compared to men, and the cause of this difference in prevalance based on sex is not well understood. In this context, our results and those from Halilaj et al. [62] support the premise there may be other factors, not the shapes of the articulating surfaces between the trapezium and first metacarpal, that may play a major role in governing the biomechanics of the thumb in women versus men, and therefore pre-disposing women to higher OA of that joint. We expect to continue to validate the technique in future studies and examine shape-based metrics in larger healthy populations and in subjects with and without pathological findings. It must be noted that our study did not have the power to detect differences between the carpal bones of the left and right wrist. The fact that we found significant shape differences based on sex in this study imply that sex-based differences are much larger than those between the left and right wrists of individuals of both sexes.
The determination of mechanical parameters based on bone morphology, alignment, and shape can provide the basis for comparison between normal wrists and wrists with a variety of progressive instability patterns [63], types of fracture [64], pathological and post-traumatic states [65], and different simulated surgical procedures [39], [66]. The analysis of point-wise morphometric characteristics of wrist bones therefore has the potential to identify specific phenotypes that may predispose individuals to altered biomechanics (hence carpal instability or osteoarthritis) [24], [29], [67], and potential age-related bone loss during adulthood [8]. Such analyses may help in determining response to therapies or repair procedure.
We demonstrated a method for atlas selection. The atlas we chose was not a statistical atlas of the population, rather, a single subject from the population whose carpal bones best represented the cohort analyzed based on a minimum l2 distance metric. Our results demonstrate that the atlas chosen by RBM was superior for detecting shape-based differences based on sex compared to the spatially-averaged bone atlas or a randomly chosen atlas. While our chosen atlas corresponded to a biomechanically stable template (as it was for a single healthy, asymptomatic individual), this atlas did not capture the spatial variance in the population. The atlas we chose for determining bone shape differences based on sex showed a reasonable performance for tracking bone erosion status in clinical RA subjects. The trade-offs associated with constructing atlases by other methods, such as unbiased atlas [68], [69], probabilistic atlas [70], [71], disease specific atlas [72]– [74] will be evaluated in future work. The factors affecting the run time for RBM are mesh size, step sizes, number of iterations for ICP and non rigid registration. While we studied the effect of mesh size on the accuracy of shape preservation (figure 2), further optimization is possible for number of iterations and step sizes. Additionally, for atlas selection, pairwise bone registrations can be performed in a parallel computing environment which can dramatically reduce the computation time.
RBM is adaptable for the selection of an atlas for an individual wrist bone (Eq. (2) with B = 1). This property may be useful for shape analysis of a particular bone across a population [29] or on an evolutionary basis [21].
We developed a surface-based non-linear atlas registration technique for the purpose of determining shape differences in the wrist bones. This method provided a local metric for shape comparison in Euclidean space as opposed to a global metric [33] or a metric in a different space [29]. A comparison of RBM with these other techniques will be carried out in the future.
The application of the l2-based surface registration process yielded a point-wise displacement vector field at every point on the mesh model of the bone. In the context of RA a point-wise measure of change was computed by RBM to track bone erosion/repair for measuring response to therapy. Our study found that RBM was sensitive to erosive changes of < 1 mm. A detailed sensitivity and specificity analysis of RBM for RA erosion detection and tracking will be performed in the future in a prospective study of a larger cohort of subjects. Specific factors to be evaluated will include mesh size, number of iterations during warping and effect of choosing different atlases. An intervention/outcomes-based longitudinal study, as was used here, may provide data to assess if small erosive changes detected by RBM will be clinically significant for improving the prognosis for RA patients. After such evaluation RBM may provide an objective approach for better therapeutic selection and therapeutic assessment in RA.
In conclusion this paper presents the RBM method to compare shapes of the carpal bones of the wrist. Additional studies are required in a larger population to better characterize the performance of the method for delineating the influence of sex on carpal bone shape from potential confounding factors including age, body size, and metabolic, genetic and environmental factors, and in the context of therapeutic response monitoring in RA.
Acknowledgments
The authors acknowledge funding from the National Institutes of Health (NIH) grants K12 HD051958 and R03 EB015099 to AJC, R01 NS074980 to RML and AAJ, and UL1 TR000002 and R01 CA129561 to RB. The content is solely the responsibility of the authors and does not necessarily represent the official views of the National Institutes of Health. The authors would like to thank Drs Michael H. Buonocore, Nancy E. Lane, Barton L. Wise, Robert D. Boutin and Joseph J. Crisco for their input regarding the content of the manuscript.
Contributor Information
Anand A. Joshi, Signal and Image Processing Institute, University of Southern California, Los Angeles, CA 90089, USA..
Richard M. Leahy, Signal and Image Processing Institute, University of Southern California, Los Angeles, CA 90089, USA..
Ramsey D. Badawi, Department of Radiology, University of California Davis School of Medicine, Sacramento, CA 95817, USA..
Abhijit J. Chaudhari, Department of Radiology, University of California Davis School of Medicine, Sacramento, CA 95817, USA..
References
- 1.Parfitt A, Travers R, Rauch F, Glorieux F. Structural and cellular changes during bone growth in healthy children. Bone. 2000;27(4):487–494. doi: 10.1016/s8756-3282(00)00353-7. [DOI] [PubMed] [Google Scholar]
- 2.Russo C, Lauretani F, Bandinelli S, Bartali B, Di Iorio A, Volpato S, Guralnik J, Harris T, Ferrucci L. Aging bone in men and women: beyond changes in bone mineral density. Osteoporosis International. 2003;14(7):531–538. doi: 10.1007/s00198-002-1322-y. [DOI] [PubMed] [Google Scholar]
- 3.Seeman E. Pathogenesis of bone fragility in women and men. Lancet. 2002;359(9320):1841. doi: 10.1016/S0140-6736(02)08706-8. [DOI] [PubMed] [Google Scholar]
- 4.Eaton R, Glickel S. Trapeziometacarpal osteoarthritis. Staging as a rationale for treatment. Hand clinics. 1987;3(4):455–471. [PubMed] [Google Scholar]
- 5.Pellegrini VD., Jr Osteoarthritis of the trapeziometacarpal joint: the pathophysiology of articular cartilage degeneration. I. Anatomy and pathology of the aging joint. The Journal of hand surgery. 1991;16(6):967–974. doi: 10.1016/s0363-5023(10)80054-1. [DOI] [PubMed] [Google Scholar]
- 6.van de Giessen M, de Raedt S, Stilling M, Hansen TB, Maas M, Streekstra GJ, van Vliet LJ, Vos FM. Medical Image Computing and Computer-Assisted Intervention–MICCAI 2011. Springer; 2011. Localized component analysis for arthritis detection in the trapeziometacarpal joint; pp. 360–367. [DOI] [PubMed] [Google Scholar]
- 7.Kitay A, Wolfe SW. Scapholunate instability: current concepts in diagnosis and management. The Journal of hand surgery. 2012;37(10):2175–2196. doi: 10.1016/j.jhsa.2012.07.035. [DOI] [PubMed] [Google Scholar]
- 8.Bradney M, Pearce G, Naughton G, Sullivan C, Bass S, Beck T, Carlson J, Seeman E. Moderate exercise during growth in prepubertal boys: changes in bone mass size, volumetric density and bone strength: a controlled prospective study. Journal of Bone and Mineral Research. 1998;13(12):1814–1821. doi: 10.1359/jbmr.1998.13.12.1814. [DOI] [PubMed] [Google Scholar]
- 9.Johnston FE, Jahina SB. The contribution of the carpal bones to the assessment of skeletal age. American Journal of Physical Anthropology. 1965;23(4):349–354. doi: 10.1002/ajpa.1330230408. [DOI] [PubMed] [Google Scholar]
- 10.Crisco JJ, Coburn JC, Moore DC, Upal MA. Carpal bone size and scaling in men versus in women. The Journal of Hand Surgery. 2005;30(1):35–42. doi: 10.1016/j.jhsa.2004.08.012. [DOI] [PubMed] [Google Scholar]
- 11.Moore DC, Crisco JJ, Trafton TG, Leventhal EL. A digital database of wrist bone anatomy and carpal kinematics. Journal of Biomechanics. 2007;40(11):2537–2542. doi: 10.1016/j.jbiomech.2006.10.041. [DOI] [PubMed] [Google Scholar]
- 12.Burr DB, Martin RB. Errors in bone remodeling: toward a unified theory of metabolic bone disease. American Journal of Anatomy. 1989;186(2):186–216. doi: 10.1002/aja.1001860208. [DOI] [PubMed] [Google Scholar]
- 13.Rauch F. Bone growth in length and width: the yin and yang of bone stability. Journal of Musculoskeletal and Neuronal Interactions. 2005;5(3):194. [PubMed] [Google Scholar]
- 14.Martin TJ, Seeman E. Bone remodelling: its local regulation and the emergence of bone fragility. Best practice & research Clinical endocrinology & metabolism. 2008;22(5):701–722. doi: 10.1016/j.beem.2008.07.006. [DOI] [PubMed] [Google Scholar]
- 15.Fernandez DL. A technique for anterior wedge-shaped grafts for scaphoid nonunions with carpal instability. The Journal of hand surgery. 1984;9(5):733–737. doi: 10.1016/s0363-5023(84)80025-8. [DOI] [PubMed] [Google Scholar]
- 16.Gupta A, Leibel DA, Cooney WP., III Prosthetic wrist implant. 8,758,445. uS Patent. 2014 Jun
- 17.Saxena R, Zachariah S, Sanders J. Processing computer tomography bone data for prosthetic finite element modeling: a technical note. Journal of rehabilitation research and development. 2002;39(5):609. [PubMed] [Google Scholar]
- 18.Dohn U, Ejbjerg B, Hasselquist M, Narvestad E, Moller J, Thomsen H, Ostergaard M. Detection of bone erosions in rheumatoid arthritis wrist joints with magnetic resonance imaging, computed tomography and radiography. Arthritis Research & Therapy. 2008;10(1) doi: 10.1186/ar2378. R25–R25–R25–R25. [DOI] [PMC free article] [PubMed] [Google Scholar]
- 19.Crowley A, Dong J, McHaffie A, Clarke A, Reeves Q, Williams M, Robinson E, Dalbeth N, McQueen F. Measuring bone erosion and edema in rheumatoid arthritis: A comparison of manual segmentation and ramris methods. Journal of Magnetic Resonance Imaging. 2011;33(2):364–371. doi: 10.1002/jmri.22425. [DOI] [PubMed] [Google Scholar]
- 20.Finzel S, Rech J, Schmidt S, Engelke K, Englbrecht M, Stach C, Schett G. Repair of bone erosions in rheumatoid arthritis treated with tumour necrosis factor inhibitors is based on bone apposition at the base of the erosion. Annals of the Rheumatic Diseases. 2011;70(9):1587–1593. doi: 10.1136/ard.2010.148395. [DOI] [PubMed] [Google Scholar]
- 21.Tocheri MW, Orr CM, Larson SG, Sutikna T, Saptomo EW, Due RA, Djubiantono T, Morwood MJ, Jungers WL, et al. The primitive wrist of Homo floresiensis and its implications for hominin evolution. Science. 2007;317(5845):1743–1745. doi: 10.1126/science.1147143. [DOI] [PubMed] [Google Scholar]
- 22.Sebastian TB, Tek H, Crisco JJ, Kimia BB. Segmentation of carpal bones from CT images using skeletally coupled deformable models. Medical Image Analysis. 2003;7(1):21–45. doi: 10.1016/s1361-8415(02)00065-8. [DOI] [PubMed] [Google Scholar]
- 23.Snel JG, Venema HW, Grimbergen CA. Deformable triangular surfaces using fast 1-D radial Lagrangian dynamics-segmentation of 3-D MR CT images of the wrist Medical Imaging. IEEE Transactions on. 2002;21(8):888–903. doi: 10.1109/TMI.2002.803127. [DOI] [PubMed] [Google Scholar]
- 24.Crisco JJ, McGovern RD, Wolfe SW. Noninvasive technique for measuring in vivo three-dimensional carpal bone kinematics. Journal of Orthopaedic Research. 1999;17(1):96–100. doi: 10.1002/jor.1100170115. [DOI] [PubMed] [Google Scholar]
- 25.Duryea J, Magalnick M, Alli S, Yao L, Wilson M, Goldbach-Mansky R. Semiautomated three-dimensional segmentation software to quantify carpal bone volume changes on wrist CT scans for arthritis assessment. Medical Physics. 2008;35:2321. doi: 10.1118/1.2900111. [DOI] [PMC free article] [PubMed] [Google Scholar]
- 26.Snel J, Venema H, Moojen T, Ritt J, Grimbergen C, den Heeten G. Quantitative in vivo analysis of the kinematics of carpal bones from three-dimensional CT images using a deformable surface model and a three-dimensional matching technique. Medical Physics. 2000;27(9):2037. doi: 10.1118/1.1289896. [DOI] [PubMed] [Google Scholar]
- 27.Sonenblum SE, Crisco J, Kang L, Akelman E. In vivo motion of the scaphotrapezio-trapezoidal (STT) joint. Journal of Biomechanics. 2004;37(5):645–652. doi: 10.1016/j.jbiomech.2003.09.033. [DOI] [PubMed] [Google Scholar]
- 28.Crisco JJ, Coburn JC, Moore DC, Akelman E, Weiss A-PC, Wolfe SW. In vivo radiocarpal kinematics and the dart thrower’s motion. The Journal of Bone & Joint Surgery. 2005;87(12):2729–2740. doi: 10.2106/JBJS.D.03058. [DOI] [PubMed] [Google Scholar]
- 29.van de Giessen M, Foumani M, Streekstra GJ, Strackee SD, Maas M, van Vliet LJ, Grimbergen KA, Vos FM. Statistical descriptions of scaphoid and lunate bone shapes. Journal of Biomechanics. 2010;43(8):1463–1469. doi: 10.1016/j.jbiomech.2010.02.006. [DOI] [PubMed] [Google Scholar]
- 30.van de Giessen M, Foumani M, Vos F, Strackee S, Maas M, Van Vliet L, Grimbergen C, Streekstra G. A 4D statistical model of wrist bone motion patterns. IEEE Transactions on Medical Imaging. 2012;31(3):613. doi: 10.1109/TMI.2011.2174159. [DOI] [PubMed] [Google Scholar]
- 31.Chen X, Graham J, Hutchinson C, Muir L. Automatic Inference Measurement of 3D Carpal Bone Kinematics From Single View Fluoroscopic Sequences Medical Imaging. IEEE Transactions on. 2013;32(2):317–328. doi: 10.1109/TMI.2012.2226740. [DOI] [PubMed] [Google Scholar]
- 32.van de Giessen M, Streekstra GJ, Strackee SD, Maas M, Grimbergen KA, van Vliet LJ, Vos FM. Constrained registration of the wrist joint Medical Imaging. IEEE Transactions on. 2009;28(12):1861–1869. doi: 10.1109/TMI.2009.2021432. [DOI] [PubMed] [Google Scholar]
- 33.Chaudhari AJ, Leahy RM, Wise BL, Lane NE, Badawi RD, Joshi AA. Global point signature for shape analysis of carpal bones. Physics in medicine and biology. 2014;59(4):961. doi: 10.1088/0031-9155/59/4/961. [DOI] [PMC free article] [PubMed] [Google Scholar]
- 34.Halilaj E, Laidlaw DH, Moore DC, Crisco JJ. Polar histograms of curvature for quantifying skeletal joint shape and 2 congruence 3. Journal of Biomechanical Engineering. 2014 doi: 10.1115/1.4027938. vol. in press. [DOI] [PMC free article] [PubMed] [Google Scholar]
- 35.Chen X, Graham J, Hutchinson C, Muir L. Automatic generation of statistical pose shape models for articulated joints. Medical Imaging, IEEE Transactions on. 2014;33(2):372–383. doi: 10.1109/TMI.2013.2285503. [DOI] [PubMed] [Google Scholar]
- 36.Moore DC, Crisco JJ, Trafton TG, Leventhal EL. A digital database of wrist bone anatomy and carpal kinematics. Journal of Biomechanics. 2007;40(11):2537–2542. doi: 10.1016/j.jbiomech.2006.10.041. [DOI] [PubMed] [Google Scholar]
- 37.Besl PJ, McKay ND. A Method for Registration of 3-D Shapes. IEEE Transactions on Pattern Analysis and Machine Intelligence. 1992;14(2):239–256. [Google Scholar]
- 38.Garland M. QSlim 2.0. Computer Software. University of Illinois at Urbana-Champaign, UIUC Computer Graphics Lab. 1999 [Google Scholar]
- 39.Shores JT, Demehri S, Chhabra A. Kinematic 4 Dimensional CT Imaging in the Assessment of Wrist Biomechanics Before and After Surgical Repair. Eplasty. 2013;13 [PMC free article] [PubMed] [Google Scholar]
- 40.Neu CP, McGovern RD, Crisco JJ. Kinematic accuracy of three surface registration methods in a Three-Dimensional wrist bone study. Journal of Biomechanical Engineering. 2000;122(5):528–533. doi: 10.1115/1.1289992. [DOI] [PubMed] [Google Scholar]
- 41.Joshi A, Chaudhari A, Li C, Dutta J, Cherry S, Shattuck D, Toga A, Leahy R. Digiwarp: a method for deformable mouse atlas warping to surface topographic data. Physics in Medicine and Biology. 2010;55:6197. doi: 10.1088/0031-9155/55/20/011. [DOI] [PMC free article] [PubMed] [Google Scholar]
- 42.Chung MK, Robbins SM, Dalton KM, Davidson RJ, Alexander AL, Evans A. Cortical thickness analysis in autism with heat kernel smoothing. NeuroImage. 2005 May;25(4):1256–1265. doi: 10.1016/j.neuroimage.2004.12.052. [DOI] [PubMed] [Google Scholar]
- 43.Chung M, Taylor J. Diffusion smoothing on brain surface via finite element method . Biomedical Imaging: Nano to Macro, 2004. IEEE International Symposium on. IEEE. 2004:432–435. [Google Scholar]
- 44.Barber CB, Dobkin DP, Huhdanpaa H. The quickhull algorithm for convex hulls. ACM Transactions on Mathematical Software (TOMS) 1996;22(4):469–483. [Google Scholar]
- 45.Rainbow MJ, Kamal RN, Leventhal E, Akelman E, Moore DC, Wolfe SW, Crisco JJ. In vivo kinematics of the scaphoid lunate, capitate, and third metacarpal in extreme wrist flexion and extension. The Journal of hand surgery. 2013;38(2):278–288. doi: 10.1016/j.jhsa.2012.10.035. [DOI] [PMC free article] [PubMed] [Google Scholar]
- 46.Benjamini Y, Yekutieli D. The control of the false discovery rate in multiple testing under dependency. Annals of Statistics. 2001;29:1165–1188. [Online]. Available: http://citeseerx.ist.psu.edu/viewdoc/summary?doi=10.1.1.124.8492. [Google Scholar]
- 47.Scott DL, Coulton BL, Popert AJ. Long term progression of joint damage in rheumatoid arthritis. British Medical Journal. 1986;45(5):373–373. doi: 10.1136/ard.45.5.373. [DOI] [PMC free article] [PubMed] [Google Scholar]
- 48.Molenaar ET, Voskuyl AE, Dinant HJ, Bezemer PD, Boers M, Dijkmans BA. Progression of radiologic damage in patients with rheumatoid arthritis in clinical remission. Arthritis Rheum. 2004;50(1):36–42. doi: 10.1002/art.11481. [DOI] [PubMed] [Google Scholar]
- 49.Jimenez-Boj E, Nobauer-Huhmann I, Hanslik-Schnabel B, Dorotka R, Wanivenhaus A, Kainberger F, Trattnig S, Axmann R, Tsuji W, Hermann S, Smolen J, Schett G. Bone erosions and bone marrow edema as defined by magnetic resonance imaging reflect true bone marrow inflammation in rheumatoid arthritis. Arthritis & Rheumatism. 2007;56(4):1118–1124. doi: 10.1002/art.22496. [DOI] [PubMed] [Google Scholar]
- 50.Schett G, Gravallese E. Bone erosion in rheumatoid arthritis: mechanisms diagnosis and treatment. Nature Reviews Rheumatology. 2012;8(11):656–664. doi: 10.1038/nrrheum.2012.153. [DOI] [PMC free article] [PubMed] [Google Scholar]
- 51.Bird P, Lassere M, Shnier R, Edmonds J. Computerized measurement of magnetic resonance imaging erosion volumes in patients with rheumatoid arthritis: a comparison with existing magnetic resonance imaging scoring systems and standard clinical outcome measures. Arthritis & Rheumatism. 2003;48(3):614–624. doi: 10.1002/art.10820. [DOI] [PubMed] [Google Scholar]
- 52.Bird P, Joshua F, Lassere M, Shnier R, Edmonds J. Training and calibration improve inter-reader reliability of joint damage assessment using magnetic resonance image scoring and computerized erosion volume measurement. J Rheumatol. 2005;32(8):1452–1458. [PubMed] [Google Scholar]
- 53.Scott DL, Pugner K, Kaarela K, Doyle DV, Woolf A, Holmes J, Hieke K. The links between joint damage and disability in rheumatoid arthritis. Rheumatology. 2000;39(2):122–122. doi: 10.1093/rheumatology/39.2.122. [DOI] [PubMed] [Google Scholar]
- 54.Joshi AA, Leahy RM, Badawi RD, Chaudhari AJ. Morphometry for early monitoring of treatment response in rheumatoid arthritis. Biomedical Imaging (ISBI) 2013 IEEE 10th International Symposium on. IEEE. 2013:121–124. doi: 10.1109/ISBI.2013.6556427. [DOI] [PMC free article] [PubMed] [Google Scholar]
- 55.Haavardsholm EA, Bøyesen P, Østergaard M, Schildvold A, Kvien TK. Magnetic resonance imaging findings in 84 patients with early rheumatoid arthritis: bone marrow oedema predicts erosive progression. Annals of the rheumatic diseases. 2008;67(6):794–800. doi: 10.1136/ard.2007.071977. [DOI] [PubMed] [Google Scholar]
- 56.Shattuck DW, Leahy RM. BrainSuite: An automated cortical surface identification tool. Medical Image Analysis. 2002;8(2):129–142. doi: 10.1016/s1361-8415(02)00054-3. [DOI] [PubMed] [Google Scholar]
- 57.Chaudhari A, Burkett G, Harse R, Bowen S, Packard N, Naguwa S, Hunter J, Buonocore M, Stern R, Badawi R. A multimodality wrist restraint system for high resolution PET/CT and MR imaging in rheumatoid arthritis. J Nucl Med Meeting Abstracts. 2008;49 [Google Scholar]
- 58.Chaudhari AJ, Bowen SL, Burkett GW, Packard NJ, Godinez F, Joshi AA, Naguwa SM, Shelton DK, Hunter JC, Boone JM, Buonocore MH, Badawi RD. High-resolution (18)F-FDG PET with MRI for monitoring response to treatment in rheumatoid arthritis. European Journal of Nuclear Medicine and Molecular Imaging. 2010;37(5):1047–1047. doi: 10.1007/s00259-009-1364-x. [DOI] [PMC free article] [PubMed] [Google Scholar]
- 59.Chaudhari AJ, Burkett GW, Bowen SL, Harse R, Packard NJ, Stern RL, Naguwa SM, Hunter JC, Boone JM, Buonocore MH, et al. Multimodality high resolution wrist imaging for monitoring response to therapy in rheumatoid arthritis: Instrumentation techniques. Nuclear Science Symposium Conference Record, 2008. NSS’08. IEEE; IEEE; 2008. pp. 4840–4844. [Google Scholar]
- 60.Zhang Y, Niu J, Kelly-Hayes M, Chaisson CE, Aliabadi P, Felson DT. Prevalence of Symptomatic Hand Osteoarthritis and Its Impact on Functional Status among the Elderly The Framingham Study. American Journal of Epidemiology. 2002;156(11):1021–1027. doi: 10.1093/aje/kwf141. [DOI] [PubMed] [Google Scholar]
- 61.North E, Rutledge W. The trapezium-thumb metacarpal joint: the relationship of joint shape and degenerative joint disease. The Hand. 1983;15(2):201. doi: 10.1016/s0072-968x(83)80014-x. [DOI] [PubMed] [Google Scholar]
- 62.Halilaj E, Moore DC, Laidlaw DH, Got CJ, Weiss A-PC, Ladd AL, Crisco JJ. The articular morphology of the first carpometacarpal joint does not differ between men and women, but changes with aging and early stage osteoarthritis. Journal of Biomechanics. 2014 doi: 10.1016/j.jbiomech.2014.05.005. vol. in press. [DOI] [PMC free article] [PubMed] [Google Scholar]
- 63.Goldberg SH, Strauch RE, Rosenwasser MP. Scapholunate and lunotriquetral instability in the athlete: Diagnosis and management. Operative Techniques in Sports Medicine. 2006;14(2):108–121. [Google Scholar]
- 64.McBeath R, Osterman AL. Total wrist arthroplasty. Hand clinics. 2012;28(4):595–609. doi: 10.1016/j.hcl.2012.08.015. [DOI] [PubMed] [Google Scholar]
- 65.Feipel V, Rooze M, Louryan S, Lemort M. Advances in the Biomechanics of the Hand and Wrist. Springer; 1994. Functional anatomy of the carpus in flexion and extension and in radial and ulnar deviations: An in vivo two-and three-dimensional ct study; pp. 255–270. [Google Scholar]
- 66.Coburn JC, Upal MA, Crisco JJ. Coordinate systems for the carpal bones of the wrist. Journal of Biomechanics. 2007;40(1):203–209. doi: 10.1016/j.jbiomech.2005.11.015. [DOI] [PubMed] [Google Scholar]
- 67.Felson D. Osteoarthritis as a disease of mechanics. Osteoarthritis and Cartilage. 2013;21(1):10–15. doi: 10.1016/j.joca.2012.09.012. [DOI] [PMC free article] [PubMed] [Google Scholar]
- 68.Lorenzen P, Davis B, Joshi S. Unbiased atlas formation via large deformations metric mapping. Medical Image Computing and Computer-Assisted Intervention–MICCAI 2005. 2005:411–418. doi: 10.1007/11566489_51. [DOI] [PubMed] [Google Scholar]
- 69.Joshi S, Davis B, Jomier M, Gerig G. Unbiased diffeomorphic atlas construction for computational anatomy. NeuroImage. 2004;23:S151–S160. doi: 10.1016/j.neuroimage.2004.07.068. [DOI] [PubMed] [Google Scholar]
- 70.Thompson P, Woods R, Mega M, Toga A. Mathematical/computational challenges in creating deformable and probabilistic atlases of the human brain. Human Brain Mapping. 2000;9(2):81–92. doi: 10.1002/(SICI)1097-0193(200002)9:2<81::AID-HBM3>3.0.CO;2-8. [DOI] [PMC free article] [PubMed] [Google Scholar]
- 71.Mazziotta J, Toga A, Evans A, Fox P, Lancaster J, Zilles K, Woods R, Paus T, Simpson G, Pike B, et al. A probabilistic atlas and reference system for the human brain: International consortium for brain mapping (icbm) Philosophical Transactions of the Royal Society of London. Series B: Biological Sciences. 2001;356(1412):1293–1322. doi: 10.1098/rstb.2001.0915. [DOI] [PMC free article] [PubMed] [Google Scholar]
- 72.Thompson PM, Mega MS, Toga AW. Disease-specific probabilistic brain atlases. Proc. of CVPR. 2000:227–234. doi: 10.1109/MMBIA.2000.852382. [DOI] [PMC free article] [PubMed] [Google Scholar]
- 73.Thompson PM, Mega MS, Vidal C, Rapoport J, Toga AW. Detecting disease-specific patterns of brain structure using cortical pattern matching a population-based probabilistic brain atlas. IPMI2001 ser. LNCS. 2001:488–501. doi: 10.1007/3-540-45729-1_52. [DOI] [PMC free article] [PubMed] [Google Scholar]
- 74.Thompson PM, Mega MS, Toga AW. Disease-specific probabilistic brain atlases; Procedings of IEEE International Conference on Computer Vision and Pattern Recognition; 2000. pp. 227–234. [DOI] [PMC free article] [PubMed] [Google Scholar]


