

Abstract
Prostaglandin E2 (PGE2) is an inflammatory mediator that plays key roles in promoting tumor development and progression. Urinary concentration of a major PGE2 metabolite (PGE-M) has been recently proposed as a promising cancer biomarker. Using dietary intake data from 600 postmenopausal women aged 50–74 years, we examined cross-sectional relationships between fruit and vegetable intake and urinary levels of PGE-M, determined using liquid chromatography/tandem mass spectrometry. After multivariable adjustment, increasing consumption of fruits, but not vegetables, was associated with reduced levels of urinary PGE-M (p for linear trend=0.02), with geometric means of 5.8 (95% CI: 5.2-6.6) in the lowest quintile versus 4.8 (95% CI: 4.3-5.4) in the highest quintile (Q5) of fruit consumption. A better quality diet, indicated by higher scores on the Healthy Eating Index, was also associated with decreased PGE-M (p for linear trend<0.01). The lack of association with vegetable intake may be related to variation in antioxidant capacities of the major dietary sources of fruits and vegetables for the study participants. Our findings suggest that urinary PGE-M may be modifiable by a healthy diet that follows current national dietary guideline. Further studies are warranted to assess potential utility of urinary PGE-M in assessing cancer prevention efficacy.
Introduction
Prostaglandin E2 (PGE2) is a major prostaglandin produced from arachidonic acid via cyclooxygenase (COX) enzymes and PGE synthase. As a potent mediator of inflammation, PGE2 plays an important role in promoting tumor growth and progression (1). COX-2, an inducible isoform of COX enzyme is a pharmacological target of aspirin and other nonsteroidal anti-inflammatory drugs (NSAIDs). Hence, the possibility that NSAIDs may protect against cancer is thought to be largely derived from the suppression of PGE2 formation (2). Systemic PGE2 production is best determined by measuring excreted urinary metabolites because of the chemical instability of PGE2 (3). We previously observed that higher urinary levels of a major PGE2 metabolite (PGE-M) was positively associated with an increased risk of breast cancer among postmenopausal women who did not use NSAIDs regularly (4). With previous reports showing similar positive association with urinary PGE-M regarding the risk of colorectal and stomach cancers (5, 6), urinary PGE-M has been suggested as a promising cancer risk biomarker (7). Therefore, identification of modifiable factors that affect such a biomarker could lead to a better understanding of risk factors and the mechanisms.
Fruits and vegetables contain a myriad of biologically active components as well as essential nutrients such as vitamins and minerals that may affect carcinogenesis (8). There is convincing evidence of a protective effect of vegetables regarding cancers of the mouth and pharynx, esophagus, stomach, colon, rectum and lung. Convincing or probable evidence is similarly found for fruits related to most of these cancers (9). The anti-carcinogenic effects of fruits and vegetables are partly attributed to the anti-inflammatory property (8). Previous studies have examined inflammatory markers in relation to fruit and vegetable intake or substances rich in fruits and vegetables. However, most of the studies focused on circulating levels of C-reactive protein (CRP) (10–12). We herein examined the relation between dietary intake of fruits and vegetables and urinary levels of PGE-M.
Materials and Methods
Subjects
Data for the present analysis came from the Sister Study, a prospective cohort study of 50,884 women aged 35–74 years to investigate genetic and environmental risk factors for breast cancer (13, 14). Study participants were volunteers from across the United States and Puerto Rico who had a sister with breast cancer but did not have breast cancer themselves at the time of enrollment (2003–2009). Concentrations of a major urinary metabolite of PGE2 (PGE-M) were determined for 607 postmenopausal women aged 50 years or older who did not report current use of hormone replacement therapies (HRT) (4). The current cross-sectional investigation included 600 women with adequate dietary information available. The study was approved by the Institutional Review Board of the National Institute of Environmental Health Sciences, NIH, and the Copernicus Group.
Dietary intake assessment
At the time of enrollment, participants completed the 1998 version of the full diet Block food frequency questionnaire (FFQ). The questionnaire contained 23 vegetable items (13 as a sole dish and 10 as a mixed dish), 10 fruit items (5 seasonal and 5 year-round fruits) and 6 juice items. For each of food and beverage items, participants were asked about serving size (4 categories) and intake frequency (9 categories).
Overall diet quality was assessed using the Healthy Eating Index (HEI). The HEI is based on 10 components reflecting different aspects of a healthy diet (four nutrients, five food groups and a measure of variety in food intake)(15). Each component had a score ranging from 0 to 10, with a total maximum possible score of 100. The highest score of 10 was given for ≤ 30% of energy from fat, ≤ 10% of energy from saturated fat, ≤ 300 mg of cholesterol and ≤ 2,400 mg of sodium intake. Scores for the food group components are determined based on age and gender-specific energy intake levels recommended by the USDA Food Guide Pyramid. For women aged 50 years or older included in the current study, the recommended energy intake was 1,900 kcal per day; accordingly, the maximum score was given for 7.4 servings of grains, 3.5 servings of vegetables, 2.5 servings of fruits, 2 servings of milk and 2.2 servings of meat per day. Variety in food intake was assessed by approximate number of different foods in three days estimated from the FFQ. A maximum score was given if 16 or more different food items were consumed over a 3-day period and a score of zero was given if six or less different items were eaten. Intermediary scores were distributed proportionately. According to the composite score of the HEI, women's diets were categorized as poor (≤ 50), needs improvement (51-80), or good (≥ 81)(15).
Quantification of urinary PGE-M
Excreted metabolite of PGE2 in urine has been generally accepted as an index of endogenous PGE2 (3, 16). A major urinary metabolite of PGE2 (11-α-hydroxy-9,15-dioxo-2,3,4,5-tetranor-prostane-1,20-dioic acid; PGE-M)(17) was quantified using liquid chromatography/tandem mass spectrometry (LC/MS/MS) in the Eicosanoid Laboratory at Vanderbilt University School of Medicine using methods as previously described (3, 18).
A set of twenty samples was analyzed in each run and approximately 20% (N=127) of the total samples were randomly selected and analyzed in duplicate. The coefficient of variation (%CV) of PGE-M among duplicates was 6% within-run and 14% between-runs. Urinary creatinine was measured in duplicate using the Creatinine Colorimetric Detection Kit supplied by Enzo Life Sciences (P/N ADI1907030A) to adjust urinary PGE-M concentration for creatinine concentration (ng PGE-M/mg creatinine).
Statistical analysis
Differences in proportions were evaluated across the quintiles of combined fruit and vegetable consumption (servings per day) using the chi-square tests. The Kruskal-Wallis tests were used for comparison of continuous variables because of the skewed distributions. Pearson's correlation coefficients were used to analyze the associations of selected nutrient intake with fruit and vegetable intake. To evaluate the relations between the dietary variables and urinary PGE-M, women were first grouped into quintiles based on intakes of fruit, vegetables and selected nutrients, and mean urinary PGE-M levels were estimated for each of the quintile groups using linear regression models. Urinary levels of PGE-M were not normally distributed with the majority of the data concentrated on the lower end of its range. Hence, geometric means were computed by regressing the natural logarithm of urinary PGE-M concentrations on the dietary variables and taking an antilog of the resulting mean logarithmic urinary PGE-M concentration. Multiple linear regression models were used to adjust for the following potential confounding factors identified using a directed acyclic graph (DAG) analysis (19): age (50-54, 55-59, 60-64, 65-69, or 70-74y), body mass index (BMI; <25, 25-29.9, 30-34.9, or ≥ 35 kg/m2), smoking status (never, past, or current smoking), pill-years of NSAID use (<0.75, 0.75-<14, 14-<49, or ≥ 49), NSAID use in the past 24 hours, energy intake (Q1: <1220, Q2: 1220-<1552, Q3:1553-<1946, or Q4: ≥ 1946 kcal/day) and percent of energy intake from saturated fat (<8.9, 8.9-10.3, 10.4-12.1, or ≥ 12.2 %). In addition to the aforementioned variables, we adjusted for the residual confounding effects of correlated lifestyle habits by including race (non-Hispanic white or others), education (≤ High school, some college, college degree, or advanced degree) and physical activity (<2.1 2.1-<9.6. 9.6-<20, or ≥ 20 metabolic equivalent [MET]-hours/week) in additional multivariable models. Linear trend was assessed treating an ordered categorical variable as a continuous variable. All tests were performed with two-sided alpha=0.05 using Stata 12.1 (College Station, TX).
Results
Postmenopausal women included in this study were mostly white and generally well educated with the majority (53%) having completed college or more. The median intakes of fruits and vegetables were 1.5 servings/d and 3 servings/d, respectively. High consumption of fruit and vegetable was positively associated with increasing energy and fiber intake and lower percentage of energy from fat (Table 1). Postmenopausal women who consumed more fruits and vegetables also tended to be more educated (college graduate or more) and do exercise more. On the other hand, fruit and vegetable consumption had no clear linear relationship with race, BMI, smoking history, and use of HRT or NSAIDs.
Table 1.
Subject characteristics according to quintiles of fruit and vegetable consumption
| Q1 | Q2 | Q3 | Q4 | Q5 | P value | |
|---|---|---|---|---|---|---|
| Servings/d | <2.8 | 2.8-<4.1 | 4.1-<5.3 | 5.3-<7.2 | ≥ 7.2 | |
| No. Median (IQR) | 116 | 121 | 125 | 113 | 125 | |
| Age, y | 60 (9) | 61 (7) | 61 (10) | 62 (8) | 63 (9) | 0.07 |
| BMI, kg/m2 | 27 (8) | 29 (7) | 27 (7) | 27 (9) | 26 (7) | 0.13 |
| Current exercise, MET-hours/week | 4.4 (15) | 7.5 (17.2) | 7.4 (16.3) | 15 (16.8) | 13.8 (19.9) | <0.01 |
| Energy intake, kcal/d | 1265 (531) | 1466 (623) | 1569 (736) | 1693 (696) | 1838 (761) | <0.01 |
| % Calories from fat | 40.2 (9.4) | 38.1 (9.3) | 37.4 (9.2) | 35.1 (8.7) | 35.6 (9.9) | <0.01 |
| % Calories from saturated fat | 11.8 (3.2) | 11 (2.9) | 10.4 (3.6) | 9.8 (2.9) | 9.3 (2.7) | <0.01 |
| Dietary fiber, g/d | 9.6 (4.7) | 13.3 (4.9) | 16 (5.2) | 20 (6.8) | 24.6 (7.7) | <0.01 |
|
| ||||||
| No. (%) | ||||||
| Non-Hispanic white | 105 (91%) | 110 (91%) | 115 (92%) | 107 (95%) | 118 (94%) | 0.43 |
| College graduate or higher | 44 (38%) | 57 (47%) | 66 (53%) | 71 (63%) | 75 (60%) | <0.01 |
| Never smoked | 54 (47%) | 64 (53%) | 70 (56%) | 54 (48%) | 70 (56%) | 0.07 |
| Regular use of NSAIDs | 65 (56%) | 59 (49%) | 66 (53%) | 71 (63%) | 75 (60%) | 0.20 |
| Used NSAIDs in the past 24 hours | 43 (37%) | 39 (32%) | 55 (44%) | 56 (50%) | 48 (38%) | 0.07 |
| Never used HRT | 41 (35%) | 45 (37%) | 50 (40%) | 38 (34%) | 43 (34%) | 0.04 |
Fruit intake was inversely associated with urinary levels of PGE-M (Figure 1A). After adjustment for the confounding factors identified using the DAG analysis such as age, BMI, smoking status, lifetime history of NSAID use, NSAID use in the past 24 hours, daily energy intake and percent of energy intake from saturated fat, geometric means of urinary PGE-M across increasing quintile categories of fruits were 5.8 (95% CI: 5.2-6.6); 5.9 (95% CI: 5.2-6.6); 5.5 (95% CI: 4.9–6.1); 5.3 (95% CI: 4.7–5.9) and 4.8 (95% CI: 4.3-5.4) (p for linear trend=0.02). We further adjusted for race, education level and physical activity in the multivariable models, but no material changes were made in the increasing trend of urinary PGE-M associated with lower fruit intakes (p for linear trend=0.03). On the other hand, there was no significant relation between vegetable intake and urinary levels of PGE-M (Figure 1A).
Figure 1.
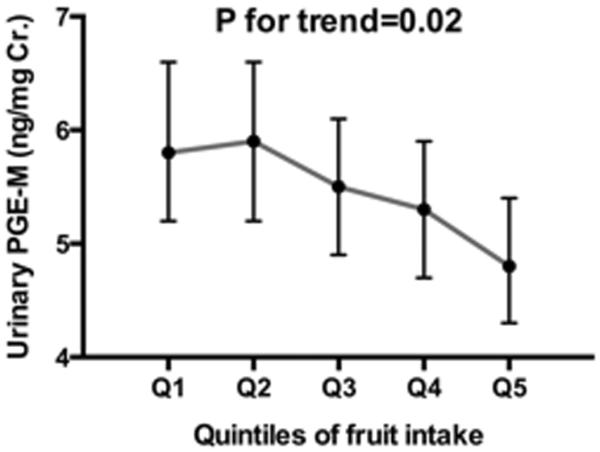

Association of quintiles of fruit (A) and vegetable (B) intake with urinary concentration of prostaglandin E2 metabolite (PFE-M) (ng/mgCr.) among 600 postmenopausal women. Geometric means and 95% confidence intervals presented were adjusted for age (50-54, 55-59, 60-64, 65-69, or 70-74 yr), body mass index (BMI:<25, 25-29.9, 30-34.9, or ≥35 kg/m2), smoking status (never, past, or current smoking), pill-years of nonsteroidal anti-inflammatory drug (NSAID) use (<0.75, 0.75-<14, 14-<49, or ≥49), NSIAD use in the past 24 hours, energy intake (Q1:<1220, Q2:1220-<1553, Q3:1553-<1946, or Q4:≥1946 kcal/day), and percent of energy intake from saturated fat (<8.9, 8.9-10.3, 10.4-12.1, or ≥12.2%).
We then examined whether the observed association between fruit intake and urinary PGE-M could be attributed to specific nutrients or bioactive components rich in fruits. Fruit intake was significantly correlated with all the nutrients examined (all p<0.01; Table 2). Highest correlations were found for vitamin C (r=0.66) and fiber (r=0.51) followed by magnesium (r=0.4) and folate (r=0.39). Because most of these nutrients were also plentiful in vegetables, we computed partial correlation coefficients after adjustment for vegetable intake. Significant correlations with fruit intake remained for all the micronutrients but the vegetable intake-adjusted partial correlations were greatly reduced for some nutrients such as vitamin A and lutein and zeaxanthin by 49% and 84%. There was relatively little change in the correlation coefficients for vitamin C (9%) and fiber (15%) after adjustment for vegetable intake.
Table 2.
Pearson's correlation coefficient (r) and partial correlation coefficient (p) between fruit and vegetable consumption (servings/d) with major nutrients and bioactive compounds found in fruits and vegetables
| Fruit intake | Vegetable intake | |||||
|---|---|---|---|---|---|---|
|
| ||||||
| r | p1 | %change | r | p1 | %change | |
| Vitamin C (mg/d) | 0.6632 | 0.6018 | 9% | 0.5827 | 0.5385 | 8% |
| Fiber (g/d) | 0.5096 | 0.4327 | 15% | 0.7166 | 0.6873 | 4% |
| Magnesium (mg/d) | 0.4 | 0.2772 | 31% | 0.5894 | 0.5372 | 9% |
| Natural folate (dfe/d) | 0.3924 | 0.2643 | 33% | 0.8554 | 0.841 | 2% |
| Vitamin A (rae/d) | 0.3438 | 0.177 | 49% | 0.7794 | 0.7551 | 3% |
| Quercetin (mg/d) | 0.3053 | 0.2230 | 27% | 0.3566 | 0.2921 | 18% |
| Lutein and zeaxanthin (mcg/d) | 0.2649 | 0.0436 | 84% | 0.8039 | 0.2134 | 73% |
| Dietary calcium (mg/d) | 0.2987 | 0.2855 | 4% | 0.3632 | 0.284 | 22% |
Partial correlation of fruit intake with nutrients adjusted for vegetable intake, and vice versa
The majority of women (78%) in this study reported taking vitamin C as a supplement. We thus examined both dietary and total (dietary plus supplemented) vitamin C intake in relation to urinary PGE-M (Table 3). Compared with the lowest quintiles of vitamin C intake, women in the quintiles of higher vitamin C intakes tended to have lower urinary PGE-M, regardless of the sources of vitamin C. However, the significant relationships were no longer observed in the multivariable analyses. Likewise, urinary PGE-M was not independently associated with dietary fiber intake.
Table 3.
Geometric mean urinary PGE-M according to quintiles of vitamin C and fiber intake
| Q1 | Q2 | Q3 | Q4 | Q5 | P for trend | |
|---|---|---|---|---|---|---|
| Total vitamin C1 (mg/d) | <98 | 98-<148 | 148-<249 | 249-<606 | ≥ 606 | |
| Crude | 6.4 (5.7–7.2) | 5.5 (4.9–6.1) | 5.1 (4.6–5.7) | 5.4 (4.9–6.1) | 4.8 (4.3–5.4) | <0.01 |
| Adjusted2 | 5.9 (5.2–6.6) | 5.4 (4.8–6.0) | 5.3 (4.8–6.0) | 5.6 (5.0–6.3) | 5.0 (4.5–5.6) | 0.13 |
|
| ||||||
| Dietary vitamin C (mg/d) | <54 | 54-<80 | 80-<110 | 110-<145 | ≥ 145 | |
| Crude | 6.3 (5.6–7.1) | 5.5 (4.9–6.2) | 5.4 (4.8–6.1) | 5.0 (4.5–5.6) | 5.0 (4.4–5.6) | <0.01 |
| Adjusted | 5.8 (5.2–6.6) | 5.4 (4.8–6.0) | 5.5 (4.9–6.1) | 5.1 (4.5–5.7) | 5.4 (4.7–6.1) | 0.25 |
|
| ||||||
| Dietary fiber3 (g/d) | <11 | 11-<15 | 15-<18 | 18-<23 | ≥ 23 | |
| Crude | 6.5 (5.7–7.2) | 5.5 (5.0–6.2) | 4.9 (4.3–5.5) | 5.4 (4.8–6.0) | 5.0 (4.4–5.6) | <0.01 |
| Adjusted | 6.0 (5.3–6.9) | 5.5 (4.9–6.1) | 5.1 (4.5–5.7) | 5.4 (4.9–6.1) | 5.1 (4.5–5.9) | 0.22 |
|
| ||||||
| Fiber from fruits and vegetables (g/d) | < 4 | 4-<6 | 6-<8 | 8-<11 | ≥ 11 | |
| Crude | 6.3 (5.6–7.0) | 5.4 (4.8–6.1) | 5.2 (4.7–5.9) | 5.2 (4.7–5.8) | 5.0 (4.5–5.7) | <0.01 |
| Adjusted | 6.0 (5.3–6.8) | 5.2 (4.6–5.9) | 5.2 (4.7–5.8) | 5.4 (4.9–6.0) | 5.3 (4.7–6.0) | 0.32 |
Vitamin C intake from diet and supplements
Estimates were adjusted for age (50-54, 55-59, 60-64, 65-69, or 70-74y), body mass index (BMI; <25, 25-29.9, 30-34.9, or ≥ 35 kg/m2), smoking status (never, past, or current smoking), pill-years of NSAID use (<0.75, 0.75-<14, 14-<49, or ≥ 49), NSAID use in the past 24 hours, energy intake (Q1: <1220, Q2: 1220-<1552, Q3: 1553-<1946, or Q4: ≥ 1946 kcal/d) and percent of energy intake from saturated fat (<8.9, 8.9-10.3, 10.4-12.1, or ≥ 12.2%).
Fiber intake from beans, grains as well as fruits and vegetables
We previously found that high intake of fat, particularly saturated fat, was associated with high levels of urinary PGE-M (4). Because the current analysis indicates an independent association between fruit intake and urinary PGE-M after adjustment for dietary fat intake, we estimated the combined effect of a healthy diet on urinary PGE-M using the HEI (Figure 2). According to the HEI categorization scheme (15), the majority (76%) in our analysis was classified as having diets in need of improvement and 15% as having a poor-quality diet; only 9% of women were classified as having a good-quality diet. A better quality diet was associated with increasingly lower levels of urinary PGE-M (p for linear trend<0.01). Adjusted geometric means of urinary PGE-M across the three categories of the HEI were 4.4 (95% CI: 3.7–5.3), 5.4 (95% CI: 5.1–5.7) and 6.1 (95% CI: 5.3–6.9), indicating a slightly greater effect size compared to the association with fruit intake alone. Additional adjustment for race, education and physical activity made little changes in the estimates (p for linear trend = 0.01).
Figure 2.
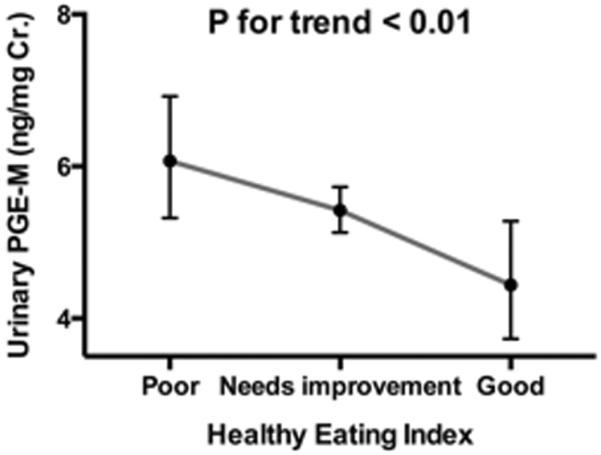
Association between the Health Eating Index and urinary concentration of prostaglandin E2 metabolite (PGE-M) (ng.mg CR.) among 600 postmenopausal women. Healthy Eating Index score was grouped into Q1 (poor <50), Q2 (needs improvement: 51-80), and Q3 (≥81). Geometric means and 95% confidence intervals presented were adjusted for age (50-54, 55-59, 60-64, 65-69, or 70-74 yr.), body mass index (BMI:<25, 25-29.9, 30-34.9, or ≥35 kg/m2), smoking status (never, past, or current smoking), pill-years of nonsteroidal anti-inflammatory drug (NSAID) use (<0.75, 0.75-<14, 14-<49, or ≥49), NSIAD use in the past 24 hours, energy intake (Q1:<1220, Q2:1220-<1553, Q3:1553-<1946, or Q4:≥1946 kcal/day).
Discussion
In this cross-sectional analysis of 600 postmenopausal women, increasing fruit consumption was associated with lower levels of urinary PGE-M. The linear trend of the observed relationship between fruit intake and PGE-M remained significant after multivariable adjustment. We also found that women on a good quality diet had lower urinary PGE-M compared to those on lower-quality diets.
Laboratory studies have documented an inhibitory effect of compounds rich in fruits and vegetables on inflammation (20). In line with these reports, human observational and intervention studies have examined inflammatory markers as intermediate endpoints to account for putatively protective effects of fruits and vegetables against cardiovascular diseases and several cancers. Although we are unaware of studies that specifically examined urinary levels of PGE-M, our results are in general agreement with previous studies based on CRP concentrations. In several cross-sectional studies, high intakes of fruits and vegetables were inversely associated with circulating levels of CRP across different age groups or gender (10, 11, 21), although a study by Oliveira et al. reported the inverse association only among males (22). Significant reduction of CRP was also found in an intervention study that involved the consumption of >8 servings/d of fruits and vegetables among non-smoking males (23). On the other hand, a short-term intervention study among hypertensive individuals did not find a significant difference in CRP concentrations related to varying amount of fruit and vegetable intake assigned (24) and a few analyses using data from the NHANES also did not find an independent association of fruit and vegetable consumption with CRP after multivariable adjustment (25, 26).
In addition to high intakes of fruit and vegetables, healthy dietary patterns characterized by soy products and fish (27) or whole grains and nuts (28) have been inversely associated with CRP and other inflammatory mediators like interleukin 6 (IL-6) in multivariable analysis. The HEI, used as an index of diet quality in our study, was also independently associated with CRP concentrations in some previous studies (29, 30) but not all (31).
We did not observe significant association between vegetable intake and urinary levels of PGE-M. Likewise, some previous studies have reported an inverse association with CRP concentrations for fruit intake, but not for vegetable intake (12, 32). It is possible that these findings including ours may be related to varying antioxidant capacities of major dietary sources of fruits and vegetables among the study participants. Different fruits and vegetables vary in their antioxidant capacity by a factor of 20-fold or more (33) and a single serving of iceberg lettuce and potatoes, the most popular vegetables in the US diet (34), contains much lower antioxidant content compared to a serving of citrus fruit (35, 36). Supporting this notion, previous studies have shown that foods with high antioxidant capacity yielded greater reduction in inflammatory markers compared to foods with low antioxidant capacity (37–39).
Among various inflammatory markers, the current study focused on endogenous production of PGE2 determined by urinary levels of PGE-M. Although CRP is a sensitive marker of low-grade chronic inflammation and a clinically useful surrogate for cardiovascular disease risk (40), the COX-2/PGE2 pathway may have more immediate biologic relevance to cancer. COX2 expression is upregulated in multiple cancers including those of the colon, rectum, stomach, esophagus, liver and lung, and PGE2, the most abundant COX-2 derived prostaglandin, is a key inflammatory mediator that affects tumor growth, migration and invasion (1). There have been several reports showing that flavonoids and vitamin C could suppress PGE2 production either indirectly via decreasing free radical generation or directly suppressing COX-2 transcriptional activity or gene expression (20, 41); these may underlie the observed inverse relationship between higher fruit consumption and urinary PGE-M in our study.
There are limitations to the present study that warrant further discussion. First, this was a cross-sectional study; thus, it limits inferences on the causality of the observed relationships. In particular, healthy behaviors tend to cluster together making it difficult to identify the causal agent(s). Although our analysis statistically controlled for potential confounders that we selected using a DAG analysis and additional indicators of socioeconomic status, we cannot completely rule out residual confounding as a possible explanation for the observed relationships. Secondly, women in our study tended to be highly educated and had a family history of breast cancer; therefore, there is concern that they may be more health conscious compared to the general population. However, this was not the case. Women in the Sister Study were similarly overweight and did not engage in physical activity or other healthy lifestyle behaviors particularly more than the general population (42). Fruit and vegetable consumption and overall diet quality in our study population were also comparable to findings reported in the NHANES III, with a median HEI score of 64 (30, 42).
In conclusion, we found that high intake of fruits and a high quality diet were associated with lower levels of urinary PGE-M, an inflammatory marker that may predict cancer risk (7). We previously observed that high intake of fat was associated with increased levels of urinary PGE-M (4). Taken together, these data suggest that urinary PGE-M may be modifiable by a healthy diet such as that promoted by current national dietary guidelines. Despite accumulating evidence supporting anti-cancer effects of NSAIDs likely via inhibition of PGE2 synthesis, NSAIDs are not generally recommended as a chemopreventive agent in the general public due to the long-term safety concerns (43). Dietary intervention may be an effective alternative, and intervention studies that incorporate urinary PGE-M as a biomarker deserve further attention to determine the causal factors.
Acknowledgement
This work was supported in part by Department of Defense Breast Cancer Postdoctoral Fellowship BC0923202 and the Intramural Research Program of the NIH, National Institute of Environmental Health Sciences (Z01 ES044005).
Footnotes
Publisher's Disclaimer: Authors have no conflict of interest or financial interests to disclose.
References
- 1.Wang D, Dubois RN. Eicosanoids and cancer. Nature reviews Cancer. 2010;10:181–93. doi: 10.1038/nrc2809. [DOI] [PMC free article] [PubMed] [Google Scholar]
- 2.Gasparini G, Longo R, Sarmiento R, Morabito A. Inhibitors of cyclo-oxygenase 2: a new class of anticancer agents? Lancet Oncol. 2003;4:605–615. doi: 10.1016/s1470-2045(03)01220-8. [DOI] [PubMed] [Google Scholar]
- 3.Murphey LJ, Williams MK, Sanchez SC, Byrne LM, Csiki I, et al. Quantification of the major urinary metabolite of PGE2 by a liquid chromatographic/mass spectrometric assay: determination of cyclooxygenase-specific PGE2 synthesis in healthy humans and those with lung cancer. Analytical Biochemistry. 2004;334:266–275. doi: 10.1016/j.ab.2004.08.019. [DOI] [PubMed] [Google Scholar]
- 4.Kim S, Taylor JA, Milne G, Sandler DP. Association between urinary prostaglandin E2 metabolite and breast cancer risk: a prospective, case-cohort study of postmenopausal women. Cancer Prevention Research. 2013 doi: 10.1158/1940-6207.CAPR-13-0040. [DOI] [PMC free article] [PubMed] [Google Scholar]
- 5.Cai Q, Gao YT, Chow WH, Shu XO, Yang G, et al. Prospective study of urinary prostaglandin E2 metabolite and colorectal cancer risk. J Clin Oncol. 2006;24:5010–5016. doi: 10.1200/JCO.2006.06.4931. [DOI] [PubMed] [Google Scholar]
- 6.Dong LM, Shu XO, Gao YT, Milne G, Ji BT, et al. Urinary prostaglandin E2 metabolite and gastric cancer risk in the Shanghai women's health study. Cancer epidemiology, biomarkers & prevention : a publication of the American Association for Cancer Research, cosponsored by the American Society of Preventive Oncology. 2009;18:3075–8. doi: 10.1158/1055-9965.EPI-09-0680. [DOI] [PMC free article] [PubMed] [Google Scholar]
- 7.Wang D, Dubois RN. Urinary PGE-M: A Promising Cancer Biomarker. Cancer Prevention Research. 2013;6:507–10. doi: 10.1158/1940-6207.CAPR-13-0153. [DOI] [PMC free article] [PubMed] [Google Scholar]
- 8.Steinmetz KA, Potter JD. Vegetables, fruit, and cancer prevention: a review. Journal of the American Dietetic Association. 1996;96:1027–39. doi: 10.1016/S0002-8223(96)00273-8. [DOI] [PubMed] [Google Scholar]
- 9.Riboli E, Norat T. Epidemiologic evidence of the protective effect of fruit and vegetables on cancer risk. The American journal of clinical nutrition. 2003;78:559S–569S. doi: 10.1093/ajcn/78.3.559S. [DOI] [PubMed] [Google Scholar]
- 10.Esmaillzadeh A, Kimiagar M, Mehrabi Y, Azadbakht L, Hu FB, et al. Fruit and vegetable intakes, C-reactive protein, and the metabolic syndrome. The American journal of clinical nutrition. 2006;84:1489–97. doi: 10.1093/ajcn/84.6.1489. [DOI] [PubMed] [Google Scholar]
- 11.Gao X, Bermudez OI, Tucker KL. Plasma C-reactive protein and homocysteine concentrations are related to frequent fruit and vegetable intake in Hispanic and non-Hispanic white elders. The Journal of Nutrition. 2004;134:913–8. doi: 10.1093/jn/134.4.913. [DOI] [PubMed] [Google Scholar]
- 12.Wannamethee SG, Lowe GD, Rumley A, Bruckdorfer KR, Whincup PH. Associations of vitamin C status, fruit and vegetable intakes, and markers of inflammation and hemostasis. The American journal of clinical nutrition. 2006;83:567–74. doi: 10.1093/ajcn.83.3.567. quiz 726–7. [DOI] [PubMed] [Google Scholar]
- 13.Weinberg CR, Shore DL, Umbach DM, Sandler DP. Using Risk-based Sampling to Enrich Cohorts for Endpoints, Genes, and Exposures. American Journal of Epidemiology. 2007;166:447–455. doi: 10.1093/aje/kwm097. [DOI] [PMC free article] [PubMed] [Google Scholar]
- 14.Kim S, Sandler DP, Carswell G, De Roo LA, Parks CG, et al. Telomere length in peripheral blood and breast cancer risk in a prospective case-cohort analysis: results from the Sister Study. Cancer Causes and Control. 2011;22:1061–1066. doi: 10.1007/s10552-011-9778-8. [DOI] [PMC free article] [PubMed] [Google Scholar]
- 15.Kennedy ET, Ohls J, Carlson S, Fleming K. The Healthy Eating Index: design and applications. Journal of the American Dietetic Association. 1995;95:1103–8. doi: 10.1016/S0002-8223(95)00300-2. [DOI] [PubMed] [Google Scholar]
- 16.Frolich JC, Wilson TW, Sweetman BJ, Smigel M, Nies AS, et al. Urinary prostaglandins. Identification and origin. J Clin Invest. 1975;55:763–770. doi: 10.1172/JCI107987. [DOI] [PMC free article] [PubMed] [Google Scholar]
- 17.Seyberth HW, Sweetman BJ, Frolich JC, Oates JA. Quantifications of the major urinary metabolite of the E prostaglandins by mass spectrometry: evaluation of the method's application to clinical studies. Prostaglandins. 1976;11:381–97. doi: 10.1016/0090-6980(76)90160-x. [DOI] [PubMed] [Google Scholar]
- 18.Fitzgerald DW, Bezak K, Ocheretina O, Riviere C, Wright TC, et al. The effect of HIV and HPV coinfection on cervical COX-2 expression and systemic prostaglandin E2 levels. Cancer Prevention Research. 2012;5:34–40. doi: 10.1158/1940-6207.CAPR-11-0496. [DOI] [PMC free article] [PubMed] [Google Scholar]
- 19.Textor J, Hardt J, Knuppel S. DAGitty: a graphical tool for analyzing causal diagrams. Epidemiology. 2011;22:745. doi: 10.1097/EDE.0b013e318225c2be. [DOI] [PubMed] [Google Scholar]
- 20.Gonzalez-Gallego J, Garcia-Mediavilla MV, Sanchez-Campos S, Tunon MJ. Fruit polyphenols, immunity and inflammation. The British journal of nutrition. 2010;104(Suppl 3):S15–27. doi: 10.1017/S0007114510003910. [DOI] [PubMed] [Google Scholar]
- 21.Hermsdorff HH, Zulet MA, Puchau B, Martinez JA. Fruit and vegetable consumption and proinflammatory gene expression from peripheral blood mononuclear cells in young adults: a translational study. Nutrition & metabolism. 2010;7:42. doi: 10.1186/1743-7075-7-42. [DOI] [PMC free article] [PubMed] [Google Scholar]
- 22.Oliveira A, Rodriguez-Artalejo F, Lopes C. The association of fruits, vegetables, antioxidant vitamins and fibre intake with high-sensitivity C-reactive protein: sex and body mass index interactions. European Journal of Clinical Nutrition. 2009;63:1345–52. doi: 10.1038/ejcn.2009.61. [DOI] [PubMed] [Google Scholar]
- 23.Watzl B, Kulling SE, Moseneder J, Barth SW, Bub A. A 4-wk intervention with high intake of carotenoid-rich vegetables and fruit reduces plasma C-reactive protein in healthy, nonsmoking men. The American journal of clinical nutrition. 2005;82:1052–8. doi: 10.1093/ajcn/82.5.1052. [DOI] [PubMed] [Google Scholar]
- 24.McCall DO, McGartland CP, McKinley MC, Sharpe P, McCance DR, et al. The effect of increased dietary fruit and vegetable consumption on endothelial activation, inflammation and oxidative stress in hypertensive volunteers. Nutrition, metabolism, and cardiovascular diseases : NMCD. 2011;21:658–64. doi: 10.1016/j.numecd.2010.01.009. [DOI] [PubMed] [Google Scholar]
- 25.Fisk PS, 2nd, Middaugh AL, Rhee YS, Brunt AR. Few favorable associations between fruit and vegetable intake and biomarkers for chronic disease risk in American adults. Nutrition research. 2011;31:616–24. doi: 10.1016/j.nutres.2011.07.005. [DOI] [PubMed] [Google Scholar]
- 26.Ford ES, Mokdad AH, Giles WH, Brown DW. The metabolic syndrome and antioxidant concentrations: findings from the Third National Health and Nutrition Examination Survey. Diabetes. 2003;52:2346–52. doi: 10.2337/diabetes.52.9.2346. [DOI] [PubMed] [Google Scholar]
- 27.Nanri A, Yoshida D, Yamaji T, Mizoue T, Takayanagi R, et al. Dietary patterns and C-reactive protein in Japanese men and women. The American journal of clinical nutrition. 2008;87:1488–96. doi: 10.1093/ajcn/87.5.1488. [DOI] [PubMed] [Google Scholar]
- 28.Nettleton JA, Steffen LM, Mayer-Davis EJ, Jenny NS, Jiang R, et al. Dietary patterns are associated with biochemical markers of inflammation and endothelial activation in the Multi-Ethnic Study of Atherosclerosis (MESA) The American journal of clinical nutrition. 2006;83:1369–79. doi: 10.1093/ajcn/83.6.1369. [DOI] [PMC free article] [PubMed] [Google Scholar]
- 29.Fung TT, McCullough ML, Newby PK, Manson JE, Meigs JB, et al. Diet-quality scores and plasma concentrations of markers of inflammation and endothelial dysfunction. The American journal of clinical nutrition. 2005;82:163–73. doi: 10.1093/ajcn.82.1.163. [DOI] [PubMed] [Google Scholar]
- 30.Ford ES, Mokdad AH, Liu S. Healthy Eating Index and C-reactive protein concentration: findings from the National Health and Nutrition Examination Survey III, 1988–1994. European Journal of Clinical Nutrition. 2005;59:278–83. doi: 10.1038/sj.ejcn.1602070. [DOI] [PubMed] [Google Scholar]
- 31.Boynton A, Neuhouser ML, Wener MH, Wood B, Sorensen B, et al. Associations between healthy eating patterns and immune function or inflammation in overweight or obese postmenopausal women. The American journal of clinical nutrition. 2007;86:1445–55. doi: 10.1093/ajcn/86.5.1445. [DOI] [PubMed] [Google Scholar]
- 32.Holt EM, Steffen LM, Moran A, Basu S, Steinberger J, et al. Fruit and vegetable consumption and its relation to markers of inflammation and oxidative stress in adolescents. Journal of the American Dietetic Association. 2009;109:414–21. doi: 10.1016/j.jada.2008.11.036. [DOI] [PMC free article] [PubMed] [Google Scholar]
- 33.Prior RL. Fruits and vegetables in the prevention of cellular oxidative damage. The American journal of clinical nutrition. 2003;78:570S–578S. doi: 10.1093/ajcn/78.3.570S. [DOI] [PubMed] [Google Scholar]
- 34.Patterson BH, Block G, Rosenberger WF, Pee D, Kahle LL. Fruit and vegetables in the American diet: data from the NHANES II survey. American Journal of Public Health. 1990;80:1443–9. doi: 10.2105/ajph.80.12.1443. [DOI] [PMC free article] [PubMed] [Google Scholar]
- 35.Szeto YT, Tomlinson B, Benzie IF. Total antioxidant and ascorbic acid content of fresh fruits and vegetables: implications for dietary planning and food preservation. The British journal of nutrition. 2002;87:55–9. doi: 10.1079/BJN2001483. [DOI] [PubMed] [Google Scholar]
- 36.Potter JD, Steinmetz K. IARC scientific publications. 1996. Vegetables, fruit and phytoestrogens as preventive agents; pp. 61–90. [PubMed] [Google Scholar]
- 37.Franzini L, Ardigo D, Valtuena S, Pellegrini N, Del Rio D, et al. Food selection based on high total antioxidant capacity improves endothelial function in a low cardiovascular risk population. Nutrition, metabolism, and cardiovascular diseases : NMCD. 2012;22:50–7. doi: 10.1016/j.numecd.2010.04.001. [DOI] [PubMed] [Google Scholar]
- 38.Valtuena S, Pellegrini N, Franzini L, Bianchi MA, Ardigo D, et al. Food selection based on total antioxidant capacity can modify antioxidant intake, systemic inflammation, and liver function without altering markers of oxidative stress. The American journal of clinical nutrition. 2008;87:1290–7. doi: 10.1093/ajcn/87.5.1290. [DOI] [PubMed] [Google Scholar]
- 39.Brighenti F, Valtuena S, Pellegrini N, Ardigo D, Del Rio D, et al. Total antioxidant capacity of the diet is inversely and independently related to plasma concentration of high-sensitivity C-reactive protein in adult Italian subjects. The British journal of nutrition. 2005;93:619–25. doi: 10.1079/bjn20051400. [DOI] [PubMed] [Google Scholar]
- 40.Ridker PM, Hennekens CH, Buring JE, Rifai N. C-reactive protein and other markers of inflammation in the prediction of cardiovascular disease in women. NEnglJ Med. 2000;342:836–843. doi: 10.1056/NEJM200003233421202. [DOI] [PubMed] [Google Scholar]
- 41.O'Leary KA, de Pascual-Tereasa S, Needs PW, Bao YP, O'Brien NM, et al. Effect of flavonoids and vitamin E on cyclooxygenase-2 (COX-2) transcription. Mutation research. 2004;551:245–54. doi: 10.1016/j.mrfmmm.2004.01.015. [DOI] [PubMed] [Google Scholar]
- 42.Spector D, Deroo LA, Sandler DP. Lifestyle behaviors in black and white women with a family history of breast cancer. Preventive Medicine. 2011;52:394–7. doi: 10.1016/j.ypmed.2011.03.001. [DOI] [PMC free article] [PubMed] [Google Scholar]
- 43.Rostom A, Dube C, Lewin G, Tsertsvadze A, Barrowman N, et al. Nonsteroidal Anti-inflammatory Drugs and Cyclooxygenase-2 Inhibitors for Primary Prevention of Colorectal Cancer: A Systematic Review Prepared for the U.S. Preventive Services Task Force. Annals of Internal Medicine. 2007;146:376–389. doi: 10.7326/0003-4819-146-5-200703060-00010. [DOI] [PubMed] [Google Scholar]