

Abstract
Despite the critical functions the human cartilage endplate (CEP) plays in the intervertebral disc, little is known about its structural and mechanical properties and their changes with degeneration. Quantifying these changes with degeneration is important for understanding how the CEP contributes to the function and pathology of the disc. Therefore the objectives of this study were to quantify the effect of disc degeneration on human CEP mechanical properties, determine the influence of superior and inferior disc site on mechanics and composition, and simulate the role of collagen fibers in CEP and disc mechanics using a validated finite element model. Confined compression data and biochemical composition data were used in a biphasic-swelling model to calculate compressive extrafibrillar elastic and permeability properties. Tensile properties were obtained by applying published tensile test data to an ellipsoidal fiber distribution. Results showed that with degeneration CEP permeability decreased 50–60% suggesting that transport is inhibited in the degenerate disc. CEP fibers are organized parallel to the vertebrae and nucleus pulposus and may contribute to large shear strains (0.1–0.2) and delamination failure of the CEP commonly seen in herniated disc tissue. Fiber-reinforcement also reduces CEP axial strains thereby enhancing fluid flux by a factor of 1.8. Collectively, these results suggest that the structure and mechanics of the CEP may play critical roles in the solute transport and disc mechanics.
Introduction
Degenerative disc changes in the nucleus pulposus and annulus fibrosus are well documented, but cartilage endplate (CEP) mechanical properties and how they change with degeneration remain unknown. The CEP is a 600–1000 μm layer of hyaline-like cartilage that separates the disc from the adjacent vertebral endplates and consists largely of type-II collagen, proteoglycans, and water (Moon et al., 2013; Urban and Roberts, 2003). The CEP functions to transmit compressive loads, contain and pressurize the nucleus pulposus, and transport water, nutrients, and waste into and out of the disc. These functional roles have been qualitatively described but have been poorly explored quantitatively, particularly with degeneration. Quantifying the CEP mechanical properties and its changes with degeneration is essential for understanding how the CEP contributes to the function and pathology of the disc. Therefore the objectives of this study were to quantify the effect of disc degeneration on human CEP mechanical properties, determine the influence of superior and inferior disc site on mechanics and composition, and simulate the role of collagen fibers in CEP and disc mechanics using a validated finite element model.
Disc degeneration may be associated with altered CEP mechanical and transport properties. Decreased transport from the vascularized vertebral body, across the CEP, and into the nucleus pulposus may result in insufficient nutrition to its cells (Jackson et al., 2011b; Roberts et al., 1996; Shirazi-Adl et al., 2010). Structural damage decreases CEP tensile modulus (Fields et al., 2014). However, the effect of degeneration on CEP compressive properties is unknown. Degeneration may affect the CEP’s functions, which may be reflected in changes in mechanical properties. We recently applied confined compression to measure the extrafibrillar compressive properties of non-degenerate CEP (Cortes et al., 2014a). Thus, the first objective of this study was to quantify the CEP mechanical properties in confined compression and how disc degeneration alters these properties.
Damage to the CEP can result in herniation of the nucleus pulposus through the vertebral endplate, known as Schmorl’s nodes (Williams et al., 2007). Schmorl’s nodes cause a decrease in disc pressure, loss of disc height, and can result in vertebral body inflammation (Kyere et al., 2012). The prevalence of Schmorl’s nodes is not symmetric; they occur more frequently across the inferior than the superior endplate (Dar et al., 2010). This prevalence may be related to differences in superior and inferior vertebral bone properties, (Grant et al., 2002; Hou and Yuan, 2012) but may also be related to differences in CEP properties. Therefore, the second objective of this study was to determine the influence of disc site (i.e., inferior/superior) on human CEP mechanics and composition.
Finite element modeling is a valuable tool to study the role of the CEP in disc mechanics and transport. Essential to a successful finite element model is the choice of constitutive models and material properties for each tissue. Of the few disc finite element models which have included the CEP, many have modeled it as a poroelastic material with an isotropic linear elastic solid matrix (Ferguson et al., 2004; Jackson et al., 2011b; Malandrino et al., 2009; Qasim et al., 2012; Shirazi-Adl et al., 2010). However the CEP constitutive formulations used have neglected non-linearity that may arise due to collagen fibers. Therefore, the third objective of this study was to model the CEP using measured CEP extrafibrillar matrix and permeability properties and evaluate the role of fiber alignment and mechanical properties.
Methods
Sample Preparation and Biochemical Composition
Human lumbar disc segments (n=19; Table 1; Supplemental Table 1) were acquired (NDRI, Philadelphia, PA), imaged with MRI, and graded for degeneration by both the nucleus pulposus T2 relaxation time and the Pfirrmann grade (Cortes et al., 2014b). The T2 relaxation time is a continuous variable suitable for correlation analyses and the Pfirrmman grade is an integer variable that is widely used and suitable for grouping samples for descriptive statistics. The T2 relaxation time and Pfirrmann grade are correlate with each other (Cortes et al., 2014b; Marinelli et al., 2010). Non-degenerate discs were defined by a Pfirrmann score of 1 and 2 while degenerate discs were grade 3 (Supplemental Table 1). No grade 4 or 5 discs had CEP that was testable. The gender distribution was 7 female and 6 male with an age range of 46 to 80 years old, with an average age of 60 ±12. Samples from lumbar levels L1L2 and L2L3 were used for statistical analyses. Only a few discs from L3L4 and L4L5 had testable CEP so these were not included in averages or statistical analyses (Table 1). CEP samples were dissected from the central region above the nucleus pulposus (total n=34, L1–L5; Figure 1). Samples were tested in confined compression and biochemical composition of adjacent tissue was measured via a DMMB assay (Cortes et al., 2014a). Material properties were determined by optimizing the experimental load curve and biochemical composition using finite element software, FEBio, as described previously (Cortes et al., 2014a) and the supplemental text.
Table 1.
Summary of sample set by lumbar level.
| Lumbar Level | Number of Non- Degenerate CEP | Number of Degenerate CEP | Total Number of CEP |
|---|---|---|---|
| L1L2 | 11 | 10 | 21 |
| L2L3 | 4 | 5 | 9 |
| L3L4 | 0 | 2* | 2* |
| L4L5 | 2* | 0 | 2* |
| Total | 17 | 17 | 34 |
Asterisks denote CEP samples that were excluded from mean calculations and statistical analyses.
Fig. 1.
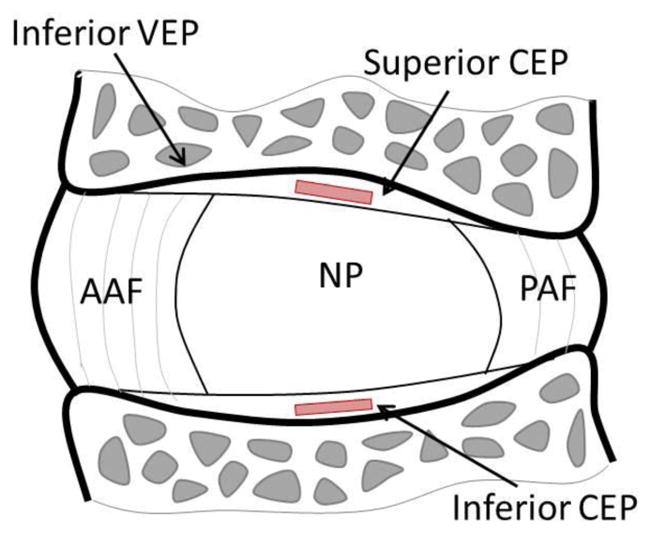
Sagittal section of the intervertebral disc showing location of CEP test samples taken adjacent to the nucleus pulposus (NP). CEP: cartilage endplate, AAF: anterior annulus fibrosus, PAF: posterior annulus fibrosus, NP: nucleus pulposus
Statistics
The effect of disc site (Superior and Inferior) and degeneration (Nondegenerate Grade 1 & 2 and Degenerate Grade 3) was analyzed using a two-way ANOVA with Wilcoxon matched-pairs signed-rank post hoc test for the effect of disc site and Mann-Whitney-U-test for effect of degeneration. The Pfirrmann scoring system is widely used and allows for grouping tissue samples into categories appropriate for the ANOVA, however, it is limited by its discrete nature. Therefore, a continuous parameter, the nucleus pulposus T2 time, (Cortes et al., 2014b), was used to evaluate the Pearson’s correlation with all mechanical and biochemical parameters. Finally, correlation of age and CEP properties were also evaluated. Relationships between mechanical (permeability, modulus) and biochemical (fixed charge density, water) properties were analyzed using Pearson correlation.
Histology and Scanning Electron Microscopy
Additional spine segments (n=4) underwent histological examination of CEP fiber alignment and potential structural differences between non-degenerate and degenerate CEP. Segments were fixed in buffered 10% formalin and decalcified with Formical-2000. Decalcified bone-CEP-NP segments from the center of the disc were paraffin-embedded and 5 μm slices were cut. Samples were stained with Alcian blue and Picrosirius red to show proteoglycan and collagen, respectively. Additional slides were stained with only Picrosirius red and viewed over a polarized light microscope to show CEP fiber alignment. An additional, non-degenerate (Pfirrmann grade 2) disc was prepared for scanning electron microscopy (SEM). An NP-CEP-Bone plug was cored across the inferior CEP. The sample was digested in Chondroitinase ABC overnight to expose collagen fibers and cryosectioned to create a flat imaging plane. The sample was imaged using a Hitachi S4700 SEM.
Finite Element Modeling of CEP Mechanics
The full set of measured CEP Grade 3 extrafibrillar elastic, permeability, and swelling properties (Table 2), averaged for the superior and inferior locations, were incorporated into a validated Grade 3 finite element disc model (Jacobs et al., 2014). Fiber properties, not available from confined compression experiments performed in this study, were obtained by fitting the tensile response from Fields et al (Fields et al., 2014) using an inverse finite element method. The average tensile response was fit to a biphasic-swelling model that was reinforced with an ellipsoidal fiber distribution. The ellipsoidal fiber distribution introduced two additional families of parameters, fiber modulus (ζ) and fiber nonlinearity (α) that are defined by an ellipsoidal distribution function (Ateshian et al., 2009). This ellipsoidal distribution function was based on CEP polarized light histology and SEM, where fibers appear primarily oriented in the plane parallel to the vertebrae and nucleus pulposus and the anterior-posterior and lateral fiber directions were assumed to have the same fiber modulus (e.g. ζ1 = ζ2) while the contribution in the axial direction (ζ3) was set at 10% of ζ1. Fiber nonlinearity was assumed to be independent of coordinate direction (e.g. α1 = α2 = α3). These assumptions reduce the ellipsoidal fiber distribution formulation to
Table 2.
Summary of mechanical and biochemical properties (median, inter-quartile range) for healthy and degenerate CEP.
| Non-degenerate (Grade 1 and 2) | Degenerate (Grade 3) | FE | |||
|---|---|---|---|---|---|
| Inferior | Superior | Inferior | Superior | ||
| E (kPa) | 193 ± 58 | 308 ± 40 | 219 ± 118 | 227 ± 248 | 328 |
| v | 0.000 ± 0.183 | 0.200 ± 0.138 | 0.246 ± 0.066 | 0.342 ± 0.013 | 0.25 |
| β | 0.054 ± 0.480 | 0.416 ± 5.023 | 0.392 ± 0.516 | 0.224 ± 0.443 | 1.06 |
| HA (kPa) | 193 ± 140 | 317 ± 199 | 181 ± 409 | 289 ± 329 | |
| k0 (mm4/Ns) | 0.000287 ± 0.000203⋄ | 0.000824 ±0.000346* | 0.000162 ±0.000108 | 0.000306 ±0.0000743# | 0.00025 |
| M | 3.786 ± 0.608 | 5.986 ± 2.340 | 3.077 ± 0.567 | 4.489 ± 2.334 | 3.9 |
| Water (%) | 57.2 ± 2.5 | 61.7 ± 3.5 | 61.1 ± 0.6 | 62.4 ± 4.1 | 62.3 |
| GAG (%) | 10.6 ± 3.0 | 10.5 ± 5.0 | 19.8 ± 4.5 | 16.3 ± 4.0 | |
| FCD (mM) | 412 ± 76 | 241 ± 24 | 481 ± 29 | 275 ± 163 | 365 |
p<0.05 vs. paired inferior sample;
p<0.1 vs. paired inferior sample p<0.1 vs.
degenerate samples from same disc site
Key: modulus (E), Poisson’s ratio (v), matrix nonlinearity parameter (β), aggregate modulus (HA), permeability (k0), permeability nonlinearity parameter (M), glycosaminoglycan (GAG), fixed charge density (FCD), finite element (FE)
| (1) |
| (2) |
To evaluate the performance of CEP fiber-reinforcement to local CEP mechanics, confined compression and uniaxial tension tests were simulated in FEBio and compared to compression and tension data. To evaluate the role of CEP fiber-reinforcement in overall disc mechanics, a disc compression simulation was performed. The simulated disc was hydrated to equilibrium for 24 hrs with the vertebral bodies fixed, which pressurized the disc (Jacobs et al., 2014). After hydration, 10% axial compression was applied over 10 sec and held for 6.5 hrs to equilibrium. Disc reaction force, CEP strain, and CEP fluid flux data were calculated along the anterior-posterior axis of the mid-sagittal slice of the disc (yz-plane, Figure 2). Simulations were performed with and without including CEP fibers to evaluate the role of fibers in disc and CEP mechanical function.
Fig. 2.
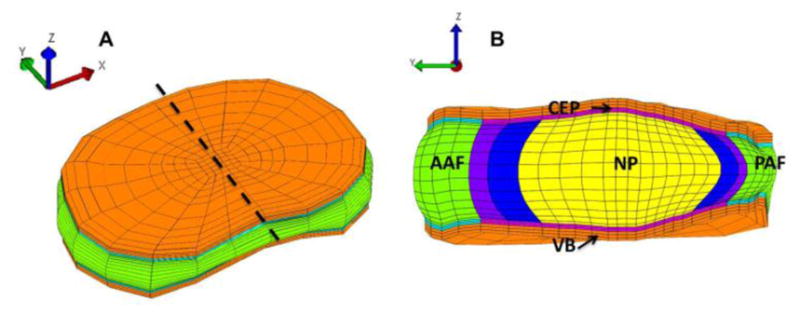
Finite element model geometry and mesh shown for (A) the full disc, and (B) the mid-sagittal section, cut at the dashed line in (A). The full disc is oriented such that the anterior-posterior disc axis coincides with the y-axis. The CEP mechanics were calculated along the yz-plane. CEP: cartilage endplate, AAF: anterior annulus fibrosus, NP: nucleus pulposus, PAF: posterior annulus fibrosus, VB: vertebra
Results
Composition
Average CEP GAG content across all CEP was 14.8% of the dry weight (n=30, Table 2) and was not different with degeneration or disc site (p>0.05). Average water content across all CEP was 61.2% (n=30) and was also not different with degeneration or disc site. FCD did not significantly relate to degeneration as measured by the Pfirmann scale but did correlate with degeneration measured by T2 time (r = −0.36, p < 0.05; Figure 3A). Although degenerative grade (Pfirmann) and NP T2 time are both used to describe degeneration, they are defined differently, so it is not surprising that some parameters, e.g., FCD, are not affected the same way by these different measures of degeneration. FCD also did not increase with age (r = 0.24, p > 0.05; Figure 3D). Surprisingly, GAG and water content did not correlate with degeneration, but FCD, a function of both GAG and water content, increased with degeneration. GAG content was not correlated with water content.
Fig. 3.

Mechanical parameters for all samples were evaluated for correlation with degeneration measured by nucleus pulposus (NP) T2 relaxation time and with specimen age. A lower T2 time represents a more degenerate disc. (A; D) Fixed charge density increases with degeneration (r = −0.36, p<0.05) and does not change with age (r = 0.24, p > 0.05) while (B; E) permeability decreases with degeneration (r = 0.44, p<0.05) and age (r = −0.39 , p < 0.05). (C; F) Modulus was not correlated with degeneration or age (p>0.05).
Histological Appearance
Histological assessment of NP-CEP-Bone segments demonstrated the structural organization of the CEP (Figure 4). The nucleus pulposus stained almost exclusively for proteoglycans, marking the boundary with the more fibrous CEP in non-degenerate samples (Figure 4A, 4C). The CEP from degenerated discs showed staining for proteoglycans (Figure 4B, 4D), inconsistent with measured composition. In non-degenerated CEP the proteoglycan staining appeared to be concentrated at the pericellular matrix (PCM) (Figures 4A and 4C) but in degenerate CEP the proteoglycan staining was more dispersed (Figures 4B and 4D). The pericellular matrix, and thus the cells, appear to be randomly arranged and do not have the columnar organization observed in articular cartilage (Wilusz et al., 2014). Fibers in the CEP tend to be oriented in the same direction although from polarized light it is unclear whether the fibers are parallel or perpendicular to the vertebrae (Figures 4E and 4F). Cells tend to be elongated parallel to the vertebrae, suggesting a parallel arrangement of fibers. This observation is supported by SEM as fibers appear mostly parallel to the vertebrae (Figure 4F).
Fig. 4.

Histological assessment of non-degenerate and degenerate CEPs. Alcian blue and picrosirius red staining of superior (A,B) and inferior (C,D) endplates. Arrows denote CEP thickness. Non-degenerate CEP (A,C) appear structurally different than degenerate endplates (B, D). Non-degenerate CEP have GAG concentrated in the PCM (E) while degenerate CEP have prominent GAG staining throughout the tissue. Polarized light image viewed over 45° cross polarizers (E) and SEM image of CEP fibers (F). Fibers appear aligned in parallel to the vertebral bone and are not arranged like those found in articular cartilage. Arrows (F) denote example horizontally-oriented fibers. Scale bar (A–E) = 500 μm. Scale bar (F) = 1 μm. NP = Nucleus Pulposus, VB = Vertebra.
Confined Compression Mechanical Properties
The optimization to determine CEP properties from the confined compression tests fit the data very well, with an average R2 of 0.96. Permeability significantly correlated with degeneration determined by NP T2 time, where lower T2 is more degenerate (r = 0.44, p<0.05; Supplemental Table 2), and significantly decreased with fixed charge density (r = −0.35, p<0.05) (Figures 3B and 5A, respectively). Permeability tended to be lower in degenerate inferior CEP compared to non-degenerate inferior CEP (p<0.1). Permeability also decreased with age (r = −0.39, p < 0.05; Figure 3E; Supplemental Table 3). Modulus did not correlate with degeneration (r = −0.03, p>0.05; Figure 3C), but tended to decrease with water content (r =−0.31, p=0.08; Figure 5B). Modulus did not correlate with GAG content, suggesting that GAG plays a more significant osmotic role in the CEP than an elastic role. Permeability (k0) was significantly greater in superior than inferior CEP in non-degenerate discs (p<0.05) and tended to be greater in superior than inferior CEP in degenerate discs (p = 0.08).
Fig. 5.

Permeability decreases with fixed charge density (r = −0.35, p<0.05; A) and modulus tended to decrease with water content (r = −0.31, p=0.08; B).
Finite Element Modeling of CEP Mechanics
An objective of this study was to model the CEP using measured extrafibrillar matrix and permeability properties and evaluate the role of collagen fibers. The fiber properties were obtained by optimizing to tensile test data (Fields et al., 2014). The optimization for the tension test fit the experimental data well (R2 = 0.97) and resulted in a fiber modulus ζ1 = 7.01 MPa and a fiber nonlinearity α1 = 2.88 (unitless). At the tissue level, fiber-reinforcement had no effect on confined compression compared to the fiber-less model (Figure 6A), but fiber-reinforcement was necessary to reproduce tensile results (Figure 6B). Including CEP collagen fiber reinforcement significantly affected CEP mechanics but had little effect on the overall disc behavior in compression. When fibers were not included and an axial compression was applied to the disc, the CEP was predicted to experience large axial tensile strains (Figure 7A) and large shear strains (Figure 7B) in the regions near the AF. However, when fiber reinforcement was included, the CEP was in compression (Figure 7A) and shear strains were reduced compared to the fiber-less model (Figure 7B). Fluid flux, or water flow, through the CEP above the NP were 65% greater in the fiber-reinforced model due to the reduced CEP deformation (Figure 7C). Although inclusion of fibers had large effects in the region of the CEP, the effect was minimal for the entire disc. Including CEP fiber reinforcement increased the peak disc axial reaction force to compression loading by 13% but did not change the equilibrium axial reaction force (Figure 7D).
Fig. 6.

Fiber-reinforced model performance in compression and tension. Both models perform identically in confined compression (A) as fibers do not contribute in confined compression. However, fibers are essential to reproduce tensile data (B).
Fig. 7.

Compression stress-relaxation finite element results taken from the time step of maximum disc compression comparing the fiber-reinforced CEP model to the fiber-less model. AF and NP denote which disc sub-tissue is adjacent to the CEP with lines denoting tissue boundaries. Fibers significantly affect axial (A) and shear (B) deformations. Reduced CEP deformation allows for enhanced fluid flow (C). Fiber-reinforcement minimally affects global disc reaction force (D). CEP: cartilage endplate, AAF: anterior inner annulus fibrosus, PAF: posterior inner annulus fibrosus, NP: nucleus pulposus
Discussion
The aims of this study were to determine the influence of 1) degeneration and 2) superior and inferior site on human CEP mechanics and composition, as well as to 3) determine the role of CEP fiber reinforcement on CEP and disc mechanics. The first objective of this study, to quantify the CEP mechanical properties in confined compression and the effect of disc degeneration, demonstrated that the human CEP mechanical function and composition change with degeneration. Notably, permeability decreased with degeneration, which has important implications related to obstruction of the disc’s transport cycle (Malandrino et al., 2014a; Nachemson et al., 1970; Roberts et al., 1996). Deleterious molecules like lactic acid may not be able to leave the disc as readily and may accumulate in the nucleus pulposus, reducing pH and affecting cell function and viability (Urban et al., 2004). While CEP permeability is correlated with disc degeneration, whether permeability-related reduced transport causes disc degeneration is unknown. Other FE studies have estimated that transport should be reduced by 40% to reduce disc glucose production, and potentially cause disc degeneration (Malandrino et al., 2014b; Zhu et al., 2012). In this study, permeability in degenerate CEP was 60–70% lower than non-degenerate CEP, suggesting that changes in CEP permeability may indeed lead to reduced disc glucose production.
The observed reduction in permeability was correlated with increased CEP fixed charge density (FCD). Tissues with higher FCD can impede diffusive transport by creating a steric and ionic barrier (Roberts et al., 1996). Although this study only measured CEP permeability for Grade 3 discs, as more advanced degenerate discs did not have testable CEP, taken with other studies, we propose that the relationship between CEP permeability and disc degeneration is non-monotonic (Figure 8). The non-degenerate disc’s transport cycle is at a normal baseline (Figure 8A). As degeneration proceeds (Figure 8B) permeability decreases, which may inhibit transport. In advanced degeneration, transport again increases (Rajasekaran et al., 2004), possibly due to combined CEP structural breakdown and disc height loss, allowing fluid to leave the disc more easily. This non-monotonic relationship between CEP permeability and degeneration may also be accompanied by changes in fixed charge density. FCD increases with mild degeneration (measured by T2 time) and correlates with permeability. We hypothesize that this increase in FCD represents an accumulation of fragmented GAG chains that have been cleaved and expunged from the NP. These fragmented GAG chains may become entangled in the dense and charged CEP environment before slowly leaving the disc altogether (Sivan et al., 2013; Sivan et al., 2006). This observation is qualitatively supported by increased proteoglycan staining in CEP.
Fig. 8.
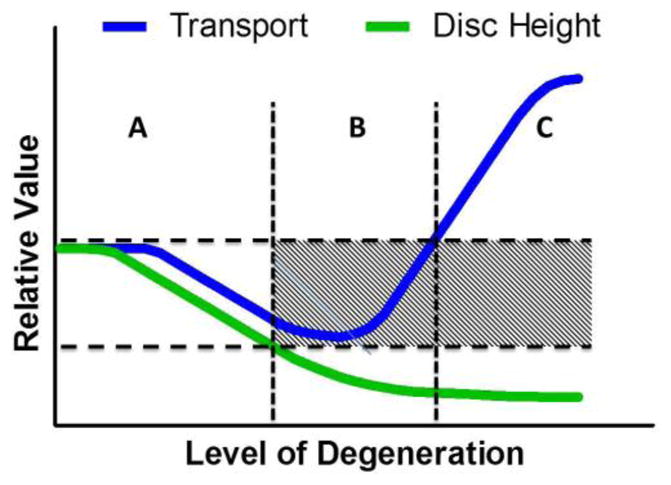
Graph describing proposed changes in transport and disc height with degeneration. In non-degenerate discs, there is an unimpeded transport cycle (A). An optimal range of transport properties permits this balance. As degeneration proceeds, structural and biochemical changes to the CEP and disc reduce transport properties, inhibiting transport (B). In advanced degeneration, transport is enhanced but disc height substantially decreases (C).
While this study demonstrated an increase in FCD with mild degeneration, it remains unclear how FCD changes with advanced degeneration, as studies often report GAG and water content and not FCD explicitly. It is challenging to interpret previous results of GAG and water content in the context of FCD, as FCD is a function of both. Nevertheless, GAG content increased in advanced degeneration (Antoniou et al., 1996), but this increase was accompanied by increased water content. On the other hand, GAG content has been shown to decrease with degeneration (Fields et al., 2014; Roberts et al., 1989; Rodriguez et al., 2011). In the present study there was no significant change in GAG with degeneration. The role of GAG content, water content and their impact on the more functional parameter, FCD, is a complex relationship.
The second objective of this study, to determine the influence of disc site on human CEP mechanics and composition, demonstrated that the superior CEP permeability was greater than that of inferior CEP. The origins of this mechanical difference remains unknown but may be related to differences in the adjacent superior and inferior vertebral bone and physiological loading. Under spinal compression the nucleus pulposus pressurizes and compresses both CEPs, but different underlying bone properties may affect the loading experienced in the CEP. Furthermore, since the spine does not experience pure compression, it is very likely that loading conditions are different across each disc-bone interface. As the tissues remodel in response to their respective loading conditions, differences in mechanical properties of both CEP and the adjacent bony endplate and vertebrae body may develop. For example, the vertebral endplate inferior to the disc has a smaller mean failure load (Grant et al., 2001; Hou and Yuan, 2012) and is thinner (Zhao et al., 2009), rendering it more susceptible to Schmorl’s nodes (Dar et al., 2010). Therefore experimental studies of the CEP and vertebral endplate should carefully control inferior/superior location. Similarly, clinical therapies of the disc should acknowledge potential differences between superior and inferior bone and CEP properties.
The third objective of this study, to model the CEP and evaluate the role of collagen fibers, successfully demonstrated that fibers are important for the CEP function and fluid flow, but have minimal effect on overall disc deformations. These findings demonstrate that CEP properties should reflect its structure in order to produce a physiologically likely stress-strain response at the tissue level. Neglecting the fiber contribution results in CEP axial strains that are in tension and also predicts very large shear strains. These predictions are physiologically unlikely, as axial tensile strains could cause delamination of the CEP. Ultimately, even with fiber-reinforcement, CEP shear strains are large due to significant lateral expansion of the NP. This suggests that excessive shear deformation may be a failure mechanism of the CEP, consistent with clinical observations of CEP delamination (Kokubun et al., 1996; Lama et al., 2014). Moreover, while fiber-reinforcement can affect CEP mechanics, it doesn’t significantly affect disc-level mechanics, with reinforcement increasing maximum disc reaction force by only 13% without affecting equilibrium reaction force. Thus previous models used to evaluate overall disc deformations remain valid (Jackson et al., 2011a; Jackson et al., 2011b; Jacobs et al., 2014; Malandrino et al., 2011; Malandrino et al., 2009), however they may not predict accurate stress and strain in the CEP and in nearby tissues.
The finite element simulations confirm that the collagen fibers significantly affect the fluid flow through the CEP. By including the fibers, the CEP fluid flux is nearly doubled compared to simulations that neglect the fibers. This can be explained by noting that fluid flow is dependent on the CEP deformation. Including fibers results in less CEP deformation, decreasing apparent permeability, and promoting greater fluid flow. Excluding the fiber distribution in models of the CEP may underestimate fluid flow and therefore convection, a potentially important component of the transport cycle (Ferguson et al., 2004; Urban et al., 2004; Urban and Roberts, 2003). Fluid flow out of the disc due to mechanical loading reduces the disc height and thus, the distance between the solute supply in the vertebral body and the cells in the center of the NP, which would promote transport of nutrients through the disc to the central NP cells. On the other hand, fluid flow out of the disc also reduces NP water content and increases NP FCD, which would inhibit transport of nutrients through the disc to the central NP cells (Grunhagen et al., 2006). Fiber-reinforcement may play a role in balancing these opposing mechanisms. Deviations from the normal fiber organization and fiber mechanical properties may affect CEP deformations and fluid flow, causing an imbalance between transport-promoting and transport-inhibiting mechanisms. Furthermore, deviations from normal fiber organization are likely relevant across the full 3D distribution of fibers.
The values of the extrafibrillar elastic and permeability properties reported here reflect the accepted functions of the CEP, including transmitting compressive loads. In order to accomplish this, the CEP must be stiff enough to support the high pressures developed in the nucleus pulposus and transmit loads across the disc-bone interface. The CEP accomplishes these functions by generating osmotic pressures comparable to those in the NP, arising from similar fixed charge densities. The CEP FCD is 80–770 mM, and is comparable to the 40–700 mM FCD of the NP (Cortes et al., 2014a; Johannessen and Elliott, 2005). Interestingly, the CEP compressive modulus in this study (270 kPa) and our previous work (300 kPa) is on the lower end of the range for articular cartilage 300–1000 kPa (Athanasiou et al., 1991; Chen et al., 2001; Moore and Burris, 2015; Mow et al., 1980) which also supports large compressive loads. Since the CEP compressive modulus is significantly lower than the CEP tensile modulus (~6 MPa) (Fields et al., 2014), the CEP exhibits tension-compression nonlinearity (Ateshian et al., 2003; Chahine et al., 2004; Huang et al., 2003) which provides for interstitial fluid pressurization as a mechanism in supporting load (Ateshian et al., 2003; Moore and Burris, 2014).
Despite having some mechanical property similarities, the CEP has structural and biochemical differences that distinguish it from articular cartilage. The fiber arrangement in articular cartilage has distinct zones, including a surface zone with fibers aligned along the surface, a middle zone with randomly dispersed fibers, and a deep zone with vertical fibers integrating with the subchondral bone (Buckwalter and Ratcliffe, 1994). The CEP fibers appear to be parallel to the NP and do not have columnar organization at the cartilage-bone interface. While both tissues interface with bone, the strength of this interface in the CEP is likely much weaker due to a lack of fibrillar connection. This may render the CEP weak in shear and may lead to detachment from the bone as seen in lateral herniation (Kokubun et al., 1996; Lama et al., 2014). Furthermore, the CEP biochemical composition is different from that of articular cartilage. The CEP is much less hydrated and has a lower GAG content than human articular cartilage (Armstrong and Mow, 1982; Canal Guterl et al., 2010; Roberts et al., 1989; Setton et al., 1999; Setton et al., 1993). These structural and biochemical differences between CEP and articular cartilage, together with the different functional roles of these tissues, where the CEP functions to provide a barrier between the bone and the nucleus pulposus and articular cartilage supports joint contact, support the notion that the CEP and articular cartilage are unique and different tissues.
In conclusion, compressive experimental testing and biphasic-swelling modeling show that permeability and fixed charge density are significantly affected by degeneration and superior and inferior location. These findings have important implications in the mechanics and health of the intervertebral disc. Furthermore, CEP fibers are organized parallel to the VB and the NP and may contribute to large shear strains and delamination failure of the CEP. Fibers also contribute to the disc transport cycle by reducing CEP axial strains and enhancing fluid flux. Collectively, these results show that CEP permeability and fiber-reinforcement may be important factors influencing the disc transport cycle.
Supplementary Material
Acknowledgments
Research reported in this publication was supported by the National Institute of Arthritis and Musculoskeletal and Skin Diseases of the National Institutes of Health under Award Numbers NIH R21AR061751 and NIH R01AR050052. The content is solely the responsibility of the authors and does not necessarily represent the official views of the National Institute of Health.
We are grateful to the developers of the open-source finite element program FEBio (www.febio.org) and to NDRI (National Disease Research Interchange) for providing human tissue.
Appendix: Supplemental Text
Samples were cut using a freezing stage microtome to create a uniform thickness (0.80 ± 0.17, n=34). Matched-thickness samples adjacent to those tested in compression were prepared for analyses of water and glycosaminoglycan content (GAG). Water content was determined by the difference between the wet and dry weights and GAG content was determined by a 1,9-dimethylmethylene blue (DMMB) assay (Han et al., 2012). The GAG and water content were used to calculate the fixed charge density (FCD), which is deformation-dependent and defined by the following equation,
| (1) |
where Zcs is the number of charges per chondroitin sulfate (2 charges/repeating unit), cGAG is the initial GAG concentration, φ0 is the reference state hydration, Mcs is the molecular weight of chondroitin sulfate (513g/repeating unit), and J is the Jacobian of the deformation (Chahine et al., 2004). The GAG concentration and water content are fixed parameters representing the initial tissue configuration. However, the FCD is a density parameter that changes with volume, particularly at large strains, so deformation-dependence is included in the formulation.
Confined Compression Testing and Analysis
Each sample was tested in confined compression with the bone-side of the CEP interfaced with the porous platen. A tare load of 0.1 N was applied and the tissue was swelled to equilibrium in a bath of 0.15M PBS for 40 min. Quasi-static compression ramps (0.016%/s) were consecutively applied to 5%, 10%, and 15% and the samples were held to equilibrium after each ramp (Cortes et al., 2014a). Preliminary studies determined that the tissue achieved equilibrium within 3000 sec, 3000 sec, and 4000 sec for the three ramps, respectively.
The confined compression CEP non-linear mechanics were modeled with a biphasic-swelling constitutive formulation. This model is an extension of the classic biphasic theory and consists of three components: extra-fibrillar matrix modulus, permeability, and osmotic swelling (Ateshian et al., 2009; Cortes et al., 2014a). This formulation decouples the ‘structural’ effect of GAG material on the extra-fibrillar elastic stress (via the Holmes-Mow constitutive equation) and the osmotic swelling effect of GAG (via the Donnan osmotic swelling equation). Note that most published biphasic properties for cartilaginous tissues have a single modulus term that combined both the extra-fibrillar matrix modulus and the osmotic pressure. In confined compression, the fibers do not contribute to the mechanics and were neglected. The applied stress in the biphasic-swelling model is a combination of the fluid and osmotic pressures (pf and pos) and the matrix stress (σmatrix),
| (2) |
The elastic matrix was modeled using a Holmes-Mow constitutive law, which is defined by the modulus (E), Poisson’s ratio (ν), and non-linearity parameter (β) (Holmes and Mow, 1990). Additionally, the strain-dependent permeability was modeled based on the reference permeability (k0) and non-linearity parameter (M) (Holmes and Mow, 1990). The permeability constitutive law was defined as
| (3) |
where k0 is the reference permeability, M is the non-linearity parameter, and I3 is the 3rd strain invariant, defined as I3 = detC where C is the right Cauchy-Green deformation tensor. The osmotic pressure was calculated as a function of the tissue’s fixed charge density and bath osmolarity (Cortes and Elliott, 2012).
The elastic (E, v, β) and permeability (k0, M) properties were obtained by curve-fitting the full experimental load curves to the biphasic-swelling model using FEBio’s built-in Levenberg-Marquardt algorithm (Cortes et al., 2014a). Briefly, the full confined compression experiment in PBS was simulated generating a reaction force curve that was compared to the experimental load curve. The material properties were solved iteratively by minimizing the difference between the FE-generated and experimental load curves. Pilot testing for a previous study demonstrated that the optimization procedure produced a unique set of parameters (Cortes et al., 2014a). The quality of the curve fits was analyzed by calculating the coefficient of determination, R2.
Footnotes
Conflicts of Interest
The authors have no conflicts of interest to report.
Disclosures
None to report.
Publisher's Disclaimer: This is a PDF file of an unedited manuscript that has been accepted for publication. As a service to our customers we are providing this early version of the manuscript. The manuscript will undergo copyediting, typesetting, and review of the resulting proof before it is published in its final citable form. Please note that during the production process errors may be discovered which could affect the content, and all legal disclaimers that apply to the journal pertain.
References
- Antoniou J, Goudsouzian N, Heathfield T, Winterbottom N, Steffen T, Poole A, Aebi M, Alini M. The Human Lumbar Endplate. Spine (Phila Pa 1976) 1996;21:1153–1161. doi: 10.1097/00007632-199605150-00006. [DOI] [PubMed] [Google Scholar]
- Armstrong CG, V, Mow C. Variations in the intrinsic mechanical properties of human articular cartilage with age, degeneration, and water content. Journal of Bone and Joint Surgery. 1982;64:88–94. [PubMed] [Google Scholar]
- Ateshian GA, Rajan V, Chahine NO, Canal CE, Hung CT. Modeling the matrix of articular cartilage using a continuous fiber angular distribution predicts many observed phenomena. Journal of biomechanical engineering. 2009;131:061003. doi: 10.1115/1.3118773. [DOI] [PMC free article] [PubMed] [Google Scholar]
- Ateshian GA, Soltz MA, Mauck RL, Basalo IM, Hung CT, Lai WM. The role of osmotic pressure and tension-compression nonlinearity in the frictional response of articular cartilage. Transport in Porous Media. 2003;50:5–33. [Google Scholar]
- Athanasiou KA, Rosenwasser MP, Buckwalter JA, Malinin TI, Mow VC. Interspecies comparisons of in situ intrinsic mechanical properties of distal femoral cartilage. Journal of Orthopedic Research. 1991;9:330–340. doi: 10.1002/jor.1100090304. [DOI] [PubMed] [Google Scholar]
- Buckwalter JAM, VC, Ratcliffe A. Restoration of injured or degenerated articular cartilage. Journal of the American Academy of Orthopedic Surgeons. 1994;2:192–201. doi: 10.5435/00124635-199407000-00002. [DOI] [PubMed] [Google Scholar]
- Canal Guterl C, Hung CT, Ateshian GA. Electrostatic and non-electrostatic contributions of proteoglycans to the compressive equilibrium modulus of bovine articular cartilage. Journal of Biomechanics. 2010;43:1343–1350. doi: 10.1016/j.jbiomech.2010.01.021. [DOI] [PMC free article] [PubMed] [Google Scholar]
- Chahine NO, Wang CC, Hung CT, Ateshian GA. Anisotropic strain-dependent material properties of bovine articular cartilage in the transitional range from tension to compression. Journal of Biomechanics. 2004;37:1251–1261. doi: 10.1016/j.jbiomech.2003.12.008. [DOI] [PMC free article] [PubMed] [Google Scholar]
- Chen ACB, WC, Schinagl RM, Sah RL. Depth- and strain-dependent mechanical and electromechanical properties of full-thickness bovine articular cartilage in confined compression. Journal of Biomechanics. 2001;34:1–12. doi: 10.1016/s0021-9290(00)00170-6. [DOI] [PubMed] [Google Scholar]
- Cortes DH, Elliott DM. Extra-fibrillar matrix mechanics of annulus fibrosus in tension and compression. Biomech Model Mechanobiol. 2012;11:781–790. doi: 10.1007/s10237-011-0351-x. [DOI] [PMC free article] [PubMed] [Google Scholar]
- Cortes DH, Jacobs NT, DeLucca JF, Elliott DM. Elastic, permeability and swelling properties of human intervertebral disc tissues: A benchmark for tissue engineering. Journal of Biomechanics. 2014a;47:2088–2094. doi: 10.1016/j.jbiomech.2013.12.021. [DOI] [PMC free article] [PubMed] [Google Scholar]
- Cortes DH, Magland JF, Wright AC, Elliott DM. The shear modulus of the nucleus pulposus measured using magnetic resonance elastography: a potential biomarker for intervertebral disc degeneration. Magnetic Resonance in Medicine. 2014b;72:211–219. doi: 10.1002/mrm.24895. [DOI] [PMC free article] [PubMed] [Google Scholar]
- Dar G, Masharawi Y, Peleg S, Steinberg N, May H, Medlej B, Peled N, Hershkovitz I. Schmorl's nodes distribution in the human spine and its possible etiology. European Spine Journal. 2010;19:670–675. doi: 10.1007/s00586-009-1238-8. [DOI] [PMC free article] [PubMed] [Google Scholar]
- Ferguson SJ, Ito K, Nolte LP. Fluid flow and convective transport of solutes within the intervertebral disc. Journal of Biomechanics. 2004;37:213–221. doi: 10.1016/s0021-9290(03)00250-1. [DOI] [PubMed] [Google Scholar]
- Fields AJ, Rodriguez D, Gary KN, Liebenberg EC, Lotz JC. Influence of biochemical composition on endplate cartilage tensile properties in the human lumbar spine. Journal of Orthopedic Research. 2014;32:245–252. doi: 10.1002/jor.22516. [DOI] [PMC free article] [PubMed] [Google Scholar]
- Grant JP, Oxland T, Dvorak MF. Mapping the Structural Properites of the Lumbosacral Vertebral Endplates. Spine (Phila Pa 1976) 2001;26:889–896. doi: 10.1097/00007632-200104150-00012. [DOI] [PubMed] [Google Scholar]
- Grant JP, Oxland TR, Dvorak MF, Fisher CG. The effects of bone density and disc degeneration on the structural property distributions in the lower lumbar vertebral endplates. Journal of Orthopedic Research. 2002;20:1115–1120. doi: 10.1016/S0736-0266(02)00039-6. [DOI] [PubMed] [Google Scholar]
- Grunhagen T, Wilde G, Soukane DM, Shirazi-Adl A, Urban J. Nutrient supply and intervertebral disc metabolism. Journal of Bone and Joint Surgery. 2006;88:30–35. doi: 10.2106/JBJS.E.01290. [DOI] [PubMed] [Google Scholar]
- Han WM, Nerurkar NL, Smith LJ, Jacobs NT, Mauck RL, Elliott DM. Multi-scale structural and tensile mechanical response of annulus fibrosus to osmotic loading. Annals of Biomedical Engineering. 2012;40:1610–1621. doi: 10.1007/s10439-012-0525-4. [DOI] [PMC free article] [PubMed] [Google Scholar]
- Holmes MH, V, Mow C. The nonlinear characteristics of soft gels and hydrated connective tissues in ultrafiltration. Journal of Biomechanics. 1990;23:1145–1156. doi: 10.1016/0021-9290(90)90007-p. [DOI] [PubMed] [Google Scholar]
- Hou Y, Yuan W. Influences of disc degeneration and bone mineral density on the structural properties of lumbar end plates. The Spine Journal. 2012;12:249–256. doi: 10.1016/j.spinee.2012.01.021. [DOI] [PubMed] [Google Scholar]
- Huang CY, Soltz MA, Kopacz M, Mow VC, Ateshian GA. Experimental verification of the roles of intrinsic matrix viscoelasticity and tension-compression nonlinearity in the biphasic response of cartilage. Journal of biomechanical engineering. 2003;125:84–93. doi: 10.1115/1.1531656. [DOI] [PubMed] [Google Scholar]
- Jackson AR, Huang CY, Brown MD, Gu WY. 3D finite element analysis of nutrient distributions and cell viability in the intervertebral disc: effects of deformation and degeneration. Journal of biomechanical engineering. 2011a;133:091006. doi: 10.1115/1.4004944. [DOI] [PMC free article] [PubMed] [Google Scholar]
- Jackson AR, Huang CY, Gu WY. Effect of endplate calcification and mechanical deformation on the distribution of glucose in intervertebral disc: a 3D finite element study. Computer methods in biomechanics and biomedical engineering. 2011b;14:195–204. doi: 10.1080/10255842.2010.535815. [DOI] [PMC free article] [PubMed] [Google Scholar]
- Jacobs NT, Cortes DH, Peloquin JM, Vresilovic EJ, Elliott DM. Validation and application of an intervertebral disc finite element model utilizing independently constructed tissue-level constitutive formulations that are nonlinear, anisotropic, and time-dependent. Journal of Biomechanics. 2014;47:2540–2546. doi: 10.1016/j.jbiomech.2014.06.008. [DOI] [PMC free article] [PubMed] [Google Scholar]
- Johannessen W, Elliott D. Effects of degeneration on the biphasic material properties of human nucleus pulposus in confined compression. Spine (Phila Pa 1976) 2005;30:E724–E729. doi: 10.1097/01.brs.0000192236.92867.15. [DOI] [PubMed] [Google Scholar]
- Kokubun S, Sakurai M, Tanaka Y. Cartilaginous endplate in cervical disc herniation. Spine (Phila Pa 1976) 1996;21:190–195. doi: 10.1097/00007632-199601150-00006. [DOI] [PubMed] [Google Scholar]
- Kyere KA, Than KD, Wang AC, Rahman SU, Valdivia-Valdivia JM, La Marca F, Park P. Schmorl's nodes. European Spine Journal. 2012;21:2115–2121. doi: 10.1007/s00586-012-2325-9. [DOI] [PMC free article] [PubMed] [Google Scholar]
- Lama P, Zehra U, Balkovec C, Claireaux HA, Flower L, Harding IJ, Dolan P, Adams MA. Significance of cartilage endplate within herniated disc tissue. European Spine Journal. 2014 doi: 10.1007/s00586-014-3399-3. [DOI] [PubMed] [Google Scholar]
- Malandrino A, Lacroix D, Hellmich C, Ito K, Ferguson SJ, Noailly J. The role of endplate poromechanical properties on the nutrient availability in the intervertebral disc. Osteoarthritis Cartilage. 2014a;22:1053–1060. doi: 10.1016/j.joca.2014.05.005. [DOI] [PubMed] [Google Scholar]
- Malandrino A, Noailly J, Lacroix D. The effect of sustained compression on oxygen metabolic transport in the intervertebral disc decreases with degenerative changes. PLoS Comput Biol. 2011;7:e1002112. doi: 10.1371/journal.pcbi.1002112. [DOI] [PMC free article] [PubMed] [Google Scholar]
- Malandrino A, Noailly J, Lacroix D. Numerical exploration of the combined effect of nutrient supply, tissue condition and deformation in the intervertebral disc. Journal of Biomechanics. 2014b;47:1520–1525. doi: 10.1016/j.jbiomech.2014.02.004. [DOI] [PubMed] [Google Scholar]
- Malandrino A, Planell JA, Lacroix D. Statistical factorial analysis on the poroelastic material properties sensitivity of the lumbar intervertebral disc under compression, flexion and axial rotation. Journal of Biomechanics. 2009;42:2780–2788. doi: 10.1016/j.jbiomech.2009.07.039. [DOI] [PubMed] [Google Scholar]
- Marinelli NL, V, Haughton M, Anderson PA. T2 relaxation times correlated with stage of lumbar intervertebral disk degeneration and patient age. AJNR Am J Neuroradiol. 2010;31:1278–1282. doi: 10.3174/ajnr.A2080. [DOI] [PMC free article] [PubMed] [Google Scholar]
- Moon SM, Yoder JH, Wright AC, Smith LJ, Vresilovic EJ, Elliott DM. Evaluation of intervertebral disc cartilaginous endplate structure using magnetic resonance imaging. European Spine Journal. 2013 doi: 10.1007/s00586-013-2798-1. [DOI] [PMC free article] [PubMed] [Google Scholar]
- Moore AC, Burris DL. An analytical model to predict interstitial lubrication of cartilage in migrating contact areas. Journal of Biomechanics. 2014;47:148–153. doi: 10.1016/j.jbiomech.2013.09.020. [DOI] [PMC free article] [PubMed] [Google Scholar]
- Moore AC, Burris DL. Tribological and material properties for cartilage of and throughout the bovine stifle: support for the altered joint kinematics hypothesis of osteoarthritis. Osteoarthritis Cartilage. 2015;23:161–169. doi: 10.1016/j.joca.2014.09.021. [DOI] [PMC free article] [PubMed] [Google Scholar]
- Mow VC, Kuei SC, Lai WM, Armstrong CG. Biphasic Creep and Stress Relaxation of Articular Cartilage in Compression: Theory and Experiments. Journal of biomechanical engineering. 1980;102:73–84. doi: 10.1115/1.3138202. [DOI] [PubMed] [Google Scholar]
- Nachemson A, Lewin T, Maroudas A, Freeman M. In vitro diffusion of dye through the end-plates and the annulus fibrosus of human lumbar inter-vertebral discs. Acta Orthopaedica Scandinavica. 1970;41:589–607. doi: 10.3109/17453677008991550. [DOI] [PubMed] [Google Scholar]
- Qasim M, Natarajan RN, An HS, Andersson GB. Initiation and progression of mechanical damage in the intervertebral disc under cyclic loading using continuum damage mechanics methodology: A finite element study. Journal of Biomechanics. 2012;45:1934–1940. doi: 10.1016/j.jbiomech.2012.05.022. [DOI] [PMC free article] [PubMed] [Google Scholar]
- Rajasekaran S, Babu JN, Arun R, Armstrong BR, Shetty AP, Murugan S. ISSLS Prize Winner: A study of diffusion in human lumbar discs: a serial magnetic resonance imaging study documenting the influence of the endplate on diffusion in normal and degenerate discs. Spine (Phila Pa 1976) 2004;29:2654–2657. doi: 10.1097/01.brs.0000148014.15210.64. [DOI] [PubMed] [Google Scholar]
- Roberts S, Menage J, Urban JP. Biochemical and structural properties of the cartilage end-plate and its relation to the intervertebral disc. Spine (Phila Pa 1976) 1989;14:166–174. doi: 10.1097/00007632-198902000-00005. [DOI] [PubMed] [Google Scholar]
- Roberts S, Urban JP, Evans HE, Einstein S. Transport Properties of the Human Cartilage Endplate in Relation to Its Composition and Calcification. Spine (Phila Pa 1976) 1996;21:415–420. doi: 10.1097/00007632-199602150-00003. [DOI] [PubMed] [Google Scholar]
- Rodriguez AG, Slichter CK, Acosta FL, Rodriguez-Soto AE, Burghardt AJ, Majumdar S, Lotz JC. Human disc nucleus properties and vertebral endplate permeability. Spine (Phila Pa 1976) 2011;36:512–520. doi: 10.1097/BRS.0b013e3181f72b94. [DOI] [PMC free article] [PubMed] [Google Scholar]
- Setton LA, Elliott DM, Mow VC. Altered mechanics of cartilage with osteoarthritis: human osteoarthritis and an experimental model of joint degeneration. Osteoarthritis Cartilage. 1999;7:2–14. doi: 10.1053/joca.1998.0170. [DOI] [PubMed] [Google Scholar]
- Setton LA, Zhu W, Weidenbaum M, Ratcliffe A, Mow VC. Compressive Properties of the Cartilaginous End-Plate of the Baboon Lumbar Spine. Journal of Orthopedic Research. 1993;11:228–239. doi: 10.1002/jor.1100110210. [DOI] [PubMed] [Google Scholar]
- Shirazi-Adl A, Taheri M, Urban JP. Analysis of cell viability in intervertebral disc: Effect of endplate permeability on cell population. Journal of Biomechanics. 2010;43:1330–1336. doi: 10.1016/j.jbiomech.2010.01.023. [DOI] [PubMed] [Google Scholar]
- Sivan SS, Hayes AJ, Wachtel E, Caterson B, Merkher Y, Maroudas A, Brown S, Roberts S. Biochemical composition and turnover of the extracellular matrix of the normal and degenerate intervertebral disc. European Spine Journal. 2013 doi: 10.1007/s00586-013-2767-8. [DOI] [PubMed] [Google Scholar]
- Sivan SS, Tsitron E, Wachtel E, Roughley P, Sakkee N, van der Ham F, Degroot J, Maroudas A. Age-related accumulation of pentosidine in aggrecan and collagen from normal and degenerate human intervertebral discs. The Biochemical journal. 2006;399:29–35. doi: 10.1042/BJ20060579. [DOI] [PMC free article] [PubMed] [Google Scholar]
- Urban J, Smith S, Fairbank J. Nutrition of the intervertebral disc. Spine (Phila Pa 1976) 2004;29:2700–2709. doi: 10.1097/01.brs.0000146499.97948.52. [DOI] [PubMed] [Google Scholar]
- Urban JPG, Roberts S. Degeneration of the Intervertebral Disc. Arthritis Research & Therapy. 2003;5:120. doi: 10.1186/ar629. [DOI] [PMC free article] [PubMed] [Google Scholar]
- Williams FM, Manek NJ, Sambrook PN, Spector TD, Macgregor AJ. Schmorl's nodes: common, highly heritable, and related to lumbar disc disease. Arthritis and rheumatism. 2007;57:855–860. doi: 10.1002/art.22789. [DOI] [PubMed] [Google Scholar]
- Wilusz RE, Sanchez-Adams J, Guilak F. The structure and function of the pericellular matrix of articular cartilage. Matrix Biology. 2014;39:25–32. doi: 10.1016/j.matbio.2014.08.009. [DOI] [PMC free article] [PubMed] [Google Scholar]
- Zhao FD, Pollintine P, Hole BD, Adams MA, Dolan P. Vertebral fractures usually affect the cranial endplate because it is thinner and supported by less-dense trabecular bone. Bone. 2009;44:372–379. doi: 10.1016/j.bone.2008.10.048. [DOI] [PubMed] [Google Scholar]
- Zhu Q, Jackson AR, Gu WY. Cell viability in intervertebral disc under various nutritional and dynamic loading conditions: 3d finite element analysis. Journal of Biomechanics. 2012;45:2769–2777. doi: 10.1016/j.jbiomech.2012.08.044. [DOI] [PMC free article] [PubMed] [Google Scholar]
Associated Data
This section collects any data citations, data availability statements, or supplementary materials included in this article.