Abstract
Radiation therapy with protons and heavier ions is an attractive form of cancer treatment that could enhance local control and survival of cancers that are currently difficult to cure and lead to less side effects due to sparing of normal tissues. However, particle therapy faces a significant technical challenge because one cannot accurately predict the particle range in the patient using data provided by existing imaging technologies. Proton computed tomography (pCT) is an emerging imaging modality capable of improving the accuracy of range prediction. In this paper, we describe the successive pCT scanners designed and built by our group with the goal to support particle therapy treatment planning and image guidance by reconstructing an accurate 3D map of the stopping power relative to water in patient tissues. The pCT scanners we have built to date consist of silicon telescopes, which track the proton before and after the object to be reconstructed, and an energy or range detector, which measures the residual energy and/or range of the protons used to evaluate the water equivalent path length (WEPL) of each proton in the object. An overview of a decade-long evolution of the conceptual design of pCT scanners and their calibration is given. Results of scanner performance tests are presented, which demonstrate that the latest pCT scanner approaches readiness for clinical applications in hadron therapy.
Keywords: proton computed tomography, hadron therapy, WEPL, proton detector, range measurement, head scanner
1. Introduction
Radiation therapy with protons and heavier ions (hadron therapy) aims at selective tumor destruction while sparing healthy tissues as much as possible. Protons and ions produce very conformal dose distributions due to the Bragg peak, which can be placed at any depth within the patient by tuning the particle energy. Careful aiming at the target from several directions further improves high dose confinement in the target volume with less dose delivered to healthy tissues, and prevents patient critical structures from being irradiated. Due to these advantages, the number of hadron therapy centers, most using protons but some also carbon ions, has been growing worldwide over the last two decades. To fully exploit the Bragg peak advantages of hadron therapy, knowledge of particle relative stopping power (RSP) with respect to water within the patient is needed for treatment planning in order to accurately calculate particle beam range, optimize the dose distribution, and to verify before treatment that the pre-calculated dose plan can be safely delivered.
Up to now, hadron therapy treatment planning has relied on RSP data derived from x-ray computed tomography (CT) scans. Up to several millimeter range uncertainties associated with the conversion of x-ray CT Hounsfield numbers to charged particle RSP often limit the choice of beam directions, since radiation oncologists are hesitant to direct a beam with such uncertainty at a critical structure such as spinal cord, brainstem, or optic nerves. An additional challenge, unique to hadron therapy, is that the actual distribution of tissues and their relationship to the target may not reproduce the distribution at the time of treatment planning, thus creating additional uncertainties of particle range at the time of treatment. The consequence of these uncertainties is that the range of the particle beam has to be extended making the treatment target volume larger than what would be necessary under ideal circumstances.
Proton computed tomography (pCT) i.e., imaging with energetic protons traversing the object to be reconstructed, is a low-dose imaging technique capable to improve range prediction accuracy because the particles used for imaging are of the same kind as those used for treatment [1]. The pCT method also has the potential to provide an effective low-dose imaging method that may be used for verification of treatment plan just before treatment.
The use of protons for imaging was originally proposed more than 50 years ago by X-ray CT inventor Allan Cormack [2], who also mentioned this possibility in his Nobel lecture in 1979. Detector and computing technology were not ready at the time of his suggestion, and first experiments with this technology as a medical diagnostic tool were performed only in the late 1970s [3,4]. A comparison of the first pCT scanner performance with that of contemporary X-ray CT scanners showed that although a superior dose-density resolution could be achieved with protons, the spatial resolution of pCT was worse by a factor 2–2.5 because of multiple Coulomb scattering (MCS). Until the early 2000s pCT technology was not further developed. At that time, the interest in the pCT was revived due to the expansion of proton therapy and the increasing use of proton gantries allowing to direct the beam from any angle. In early 2003, a group of investigators interested in application of high energy particle detectors in medicine met at Brookhaven National Laboratory (BNL) to discuss the possibility of pCT development for hadron therapy. At this meeting, an informal pCT collaboration was established, which performed studies to define design specifications based on clinical requirements and to identify optimal detector technologies for a clinical pCT system. A conceptual design was developed within one year following the initial meeting [5]. Since then, the pCT technology development has continued by the pCT collaboration mostly at the University of California, Santa Cruz and Loma Linda University Medical Center, site of the first hospital based proton treatment center, with contributions from several other institutions and investigators sharing interest and expertise in this development.
In the following sections, the authors present an overview of the decade-long evolution of the conceptual design from a proof-of-principle prototype to the pre-clinical Phase II pCT head scanner. Successive improvement of scanner performance and calibration techniques are described.
2. Initial concept for the pCT scanner design
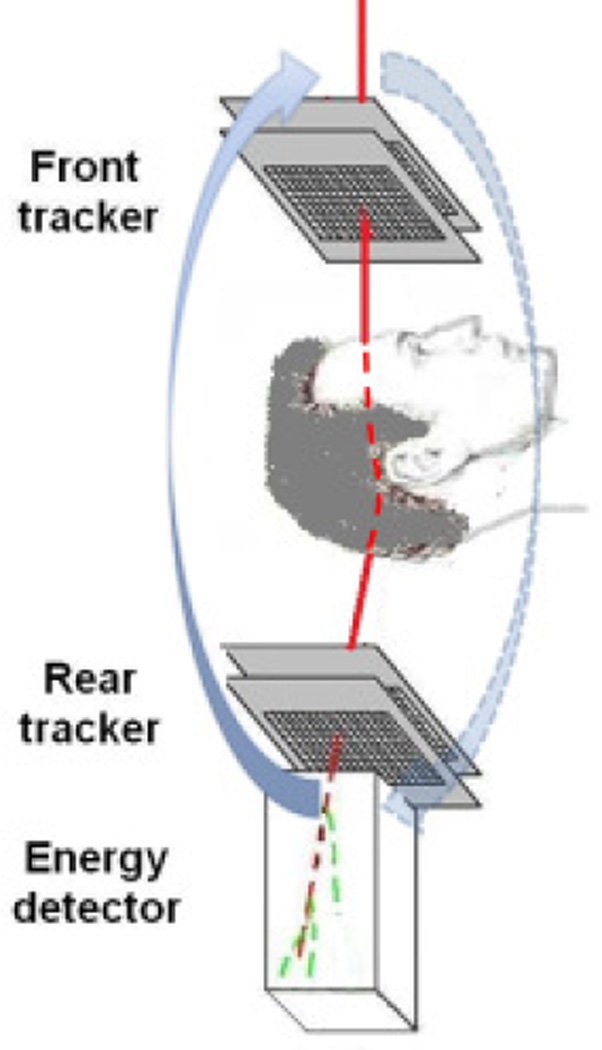
The initial design concept of the pCT collaboration originated in the approach described by Hanson [1,4], which was based on measurement of energy loss of individual protons traversing the object to be reconstructed. The general layout of the pCT system using this is shown in Fig.1.
Fig. 1.
The pCT scanner design concept based on individual proton tracking and energy measurement. The scanner rotates about the object together with a proton gantry delivering a broad beam of protons, which are tracked individually.
Protons with known incoming energy Ein are registered one-by-one with position-sensitive detectors (trackers) before and after the object and are absorbed in the energy detector (calorimeter), which thus measures residual proton energy. From each of these measurements, an estimate of the integral RSP along the proton path L through the object can be obtained by numerically solving the integral of the reciprocal stopping power of the protons in water, which is the water equivalent path length (WEPL):
| (1) |
where Eout is the outgoing energy, which is equal to sum of the proton residual energy measured by the energy detector and a small energy loss in the rear tracker, Sw is the stopping power of water for protons of energy E, which in the energy range of interest for pCT is described appropriately by the Bethe–Bloch equation. Accumulating data for a multitude of protons traversing the object from multiple directions around the object allows reconstruction of 3D RSP distributions in a tomographic fashion using an appropriate CT reconstruction technique. Spatial accuracy of the RSP reconstruction is limited by MCS in the object, but also depends on the tracking accuracy and method used to obtain a proton path estimate. One of the advantages of the individual proton tracking concept is the ability to improve the spatial resolution by tracing the proton path through the object. Although this advantage was not realized in Hanson's early studies, which used a straight-line approximation for the proton path, the possibility of improving the path estimate was mentioned. When the pCT collaboration developed its design concept, it was suggested to use the information from particle trackers including proton position and direction at the boundaries of the imaged object in conjunction with an appropriate, e.g., Gaussian, model of MCS within the object to estimate likely path.
2.1. Most Likely Path (MLP) concept and proof-of-principal experiments
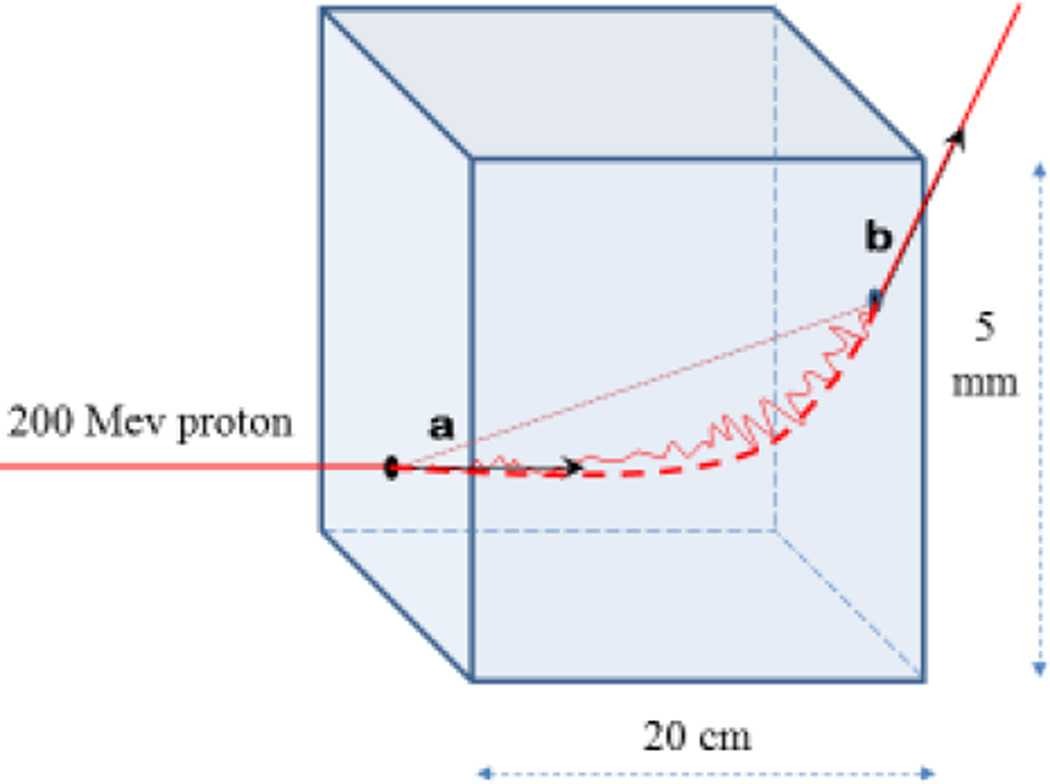
The first attempt to account for the MCS effects on proton trajectories in a homogenous material was done by Schneider and Pedroni in their analysis of the spatial resolution of proton radiography [6]. These authors developed a formalism to calculate the most probable trajectory of protons in a uniform object using measured entry and exit locations of the proton. The pCT collaboration developed a similar MLP formalism for pCT reconstruction based on an approach suggested by Williams [7], who was a member of the pCT collaboration at that time. His approach also assumed knowledge of the respective entry and exit positions and directions (see Fig. 2). Using Monte Carlo simulations, it was shown by Li et al [8] that sub-millimeter spatial resolution in pCT reconstruction could be achieved with this MLP formalism in combination with an algebraic reconstruction technique (ART). The accuracy of the MLP prediction was subsequently verified experimentally using a silicon strip detector (SSD) set-up with high position and angular resolution [9]. The set-up consisted of four SSDs with a strip pitch of 236 µm, comprising two telescopes to measure proton positions at the entrance and exit of a segmented absorber made of a 1.25 cm thick acrylic (PMMA) plates. The locations of individual 200 MeV protons inside the absorber were measured with an additional SSD placed at different degrader depths. The distributions of the observed proton position were compared to the MLP predictions using William’s approach, demonstrating that the location of the protons can be predicted with an accuracy of better than 0.5 mm within a uniform 20cm thick PMMA degrader.
Fig. 2.
Illustration of the MLP concept (not to scale) The solid line represents the trajectory of a proton undergoing (exaggerated) multiple Coulomb scattering in a water slab. Vectors a and b (generally non-coplanar) represent proton entry and exit directions, respectively, necessary to evaluate the MLP. The dashed line shows the MLP and the dotted line corresponds to a straight-line approximation used in regular CT reconstruction.
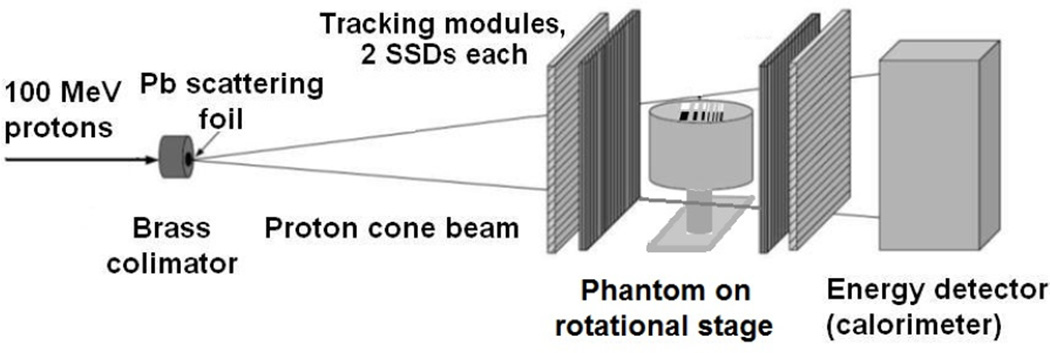
In 2007, a proof-of-principal study of the pCT scanner design and the reconstruction based on the MLP formalism application was performed at the Loma Linda University (LLU) proton accelerator research beam line with the experimental set-up [10] shown in Fig.3. A 100 MeV proton pencil beam collimated with a 2mmdiameter brass collimator was scattered with a 0.25mm thick lead foil to form a divergent cone beam. Tracking modules, each equipped with two SSDs (0.4 mm thick, 64 × 64 mm2 sensitive areas) with orthogonal strip orientation, were installed upstream and downstream of a small cylindrical phantom installed on a computer-controlled rotational stage. The entry and exit SSD modules registered the proton entry and exit coordinates, respectively, whereas the entry direction was reconstructed based on the scattering foil position. A 40 mm thick CsI(Tl) scintillator, forming a single-stage calorimeter matching the sensitive area of the SSDs, was used to measure residual proton energy. The scanning object was an acrylic cylinder 30 mm in height and 40 mm in diameter with two rows of rectangular wells, 25 mm in depth and 4 mm in height and a width and spacing varying between 1 and 4 mm; the wells of one row were filled with bone-equivalent plastic insets while the other row of wells was left empty.
Fig. 3.
Proton cone beam set-up used in a proof-of-principal experiment to test the pCT reconstruction based on the MLP concept.
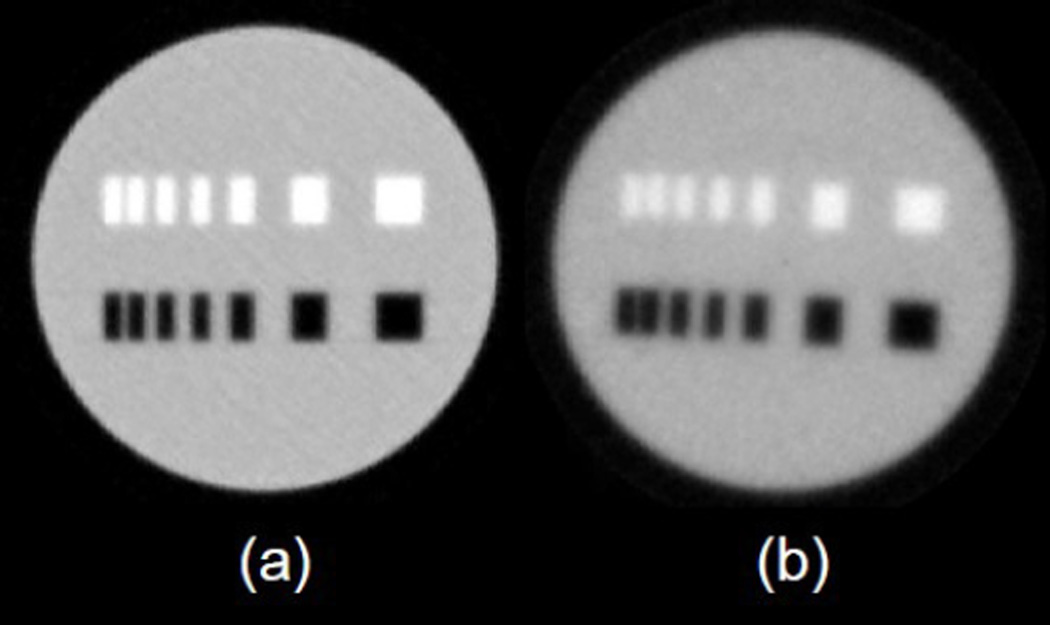
The phantom was scanned with a 100MeV proton cone beam with 90 discrete projection angles in increments of 4°. About 200k events were recorded per projection, containing coordinates of individual proton events registered by the tracking modules and the residual energy measured by the calorimeter. The recorded experimental data and analogous data generated by a GEANT4-based Monte Carlo (MC) code simulating the experimental set-up were used to generate MLPs and to reconstruct the RSP of the object with an ART-based algorithm [11]. The 3D reconstructions from simulated and experimental data presented as 2D axial images are shown in Fig. 4.
Fig. 4.
Axial 2D phantom images reconstructed using ART and the MLP concept from (a) simulated and (b) experimental data.
These first results demonstrated that a spatial resolution of better than 1 mm can be achieved using one upstream and one downstream 2D-tracking module and a cone beam reconstruction of a 4cm diameter acrylic phantom. We were encouraged by the high quality of the reconstructed pCT images with this pCT design concept. It was clear to us that for larger objects additional tracking modules were needed for the information required for a full MLP calculation.
2.2. pCT hardware design
Our primary goal has been to develop pCT technology for applications in hadron therapy of brain and head and neck cancers in order to determine RSP distributions within the patient for accurate treatment planning and to verify patient position RSP distribution before treatment. To this end, the pCT head scanner eventually has to be integrated into the gantry treatment room complying with safety constraints and fulfilling clinically meaningful requirements. The key clinical performance requirements defined the detector technologies initially chosen by the pCT collaboration; they were specified in [5] as follows:
Spatial resolution for head-size objects : better than 1 mm;
RSP reconstruction accuracy: better than 1%;
Minimum distance between patient and pCT scanner: 10 cm;
Scan duration: less than 5 min;
Maximum dose per scan: 5 cGy or less.
It was not trivial to satisfy all these challenging requirements with a compact detector rotating around the patient, therefore it was decided to approach the hardware design in several phases. In the first phase (Phase I), we designed a prototype with a horizontal rotation axis mounted on a horizontal fixed beam line to demonstrate the ability of the pCT scanner to produce clinically meaningful images and the specified RSP reconstruction accuracy of a larger (14 cm diameter) spherical phantom (Lucy 3D QA phantom, Standard Imaging, Inc., Middleton, WI). The Phase I scanner was designed to work at a moderate data rate of a few tens of kilo-samples (kS)/s that allowed to perform a high-quality pCT scan in a few hours. The subsequent phase (Phase II) aimed at faster detectors and electronics to allow decrease the scan duration to 10 minutes or less while keeping the required measurement accuracy. At the same, time the axial size of the scanning area was doubled from 18 cm to 36 cm.
To meet the specifications for spatial resolution, the proton entry and exit points into the object have to be reconstructed with a spatial accuracy better than 1 mm, which is comparable to the pixel size of a CT planning scan, in order to allow for accurate MLP estimation. This requires two pairs of two–dimensional (2D) position-sensitive detectors rotating around the patient at a minimum distance of 10 cm from the patient surface. Initially, several technical solutions for the trackers were considered, including gaseous, silicon (Si), and scintillating detectors. The pCT collaboration decided to use Si strip detectors (SSDs), because they have been widely used in high-energy physics and astrophysics, because of their unrivaled spatial resolution at high event rates, mechanical stability, and reliability. SSD technology is characterized by low noise and very high proton registration efficiency minimizing patient radiation exposure during the pCT scan.
For the measurements of the residual energy of protons traversing the imaging object, the pCT collaboration decided to use a multi-array of CsI(Tl) scintillators with photodiode readout for the Phase I scanner. This choice was mainly defined by the excellent energy resolution of such detectors for high-energy protons, and its compactness and stability (see e.g. [12] and references therein). On the other hand CsI(Tl) based scintillating detectors are relatively slow, and though fine grain design approach improves rate capability of the calorimeter, the Phase I pCT scanner energy detector was not supposed to provide the clinically required data rate. It was planned to upgrade the calorimeter with faster scintillating crystals and readout in Phase II.
3. The Phase I pCT scanner
The goal of the Phase I pCT project was to image phantoms up to the size of a small pediatric head phantom HN715 (Computerized Imaging Reference Systems, Inc., Norfolk, VA). A schematic representation of the Phase I system and a view of the actual Phase I scanner after completion is shown in Fig. 5. Note that the adult Rando® head phantom (Phantom Laboratory, Salem, NY) mounted on the scanner exceeded the sensitive area of the scanner and was later replaced by the smaller pediatric head phantom. The Phase I scanner was comprised of front and rear tracking modules positioned before and after the object to measure the position and direction of individual protons as they entered and exited the object. In each module eight 8.95 × 8.95 cm2 single-sided SSDs with strip pitch of 228 µm were arranged in two XY planes separated by 100 mm. To achieve a continuous sensitive area without any gaps, the detectors in each plane were overlapped by 5 mm resulting in a sensitive area of 8.95 × 17.4 cm2. The SSDs and its readout system were designed by the Santa Cruz Institute of Particle Physics (SCIPP) at UCSC, originally for the NASA Fermi space telescope mission [13, 14]. In fact, we used leftover SSDs and ASICs from the Fermi telescope fabrication to build the pCT scanner tracking modules.
Fig. 5.
Schematic drawing (left) and photo of the Phase I pCT scanner with head phantom installed on the rotational stage.
The energy detector, integrated with the rear tracker module, was a segmented calorimeter consisting of 18 CsI(Tl) crystals arranged to form a 3 × 6 rectangular matrix with a sensitive area of 10.2 × 20.4 cm2 slightly exceeding the sensitive area of the tracker. The individual crystal has a cropped pyramidal shape, with upstream cross-sectional dimensions of 3.4 × 3.4 cm2, downstream dimensions of 3.6 × 3.6 cm2, and an axial length of 12.5 cm, sufficient to stop protons of 200 MeV. Each crystal was coupled to a Hamamatsu S3584 photodiode and wrapped with VM2000 (3M, St. Paul, MN) 65 µm thick reflector film, so that the gap between calorimeter elements was about 130 µm [15]. Photodiode signals were amplified by CREMAT 110 charge sensitive preamplifiers [16], shaped with CREMAT 200 2-µs shapers, and digitized by 12 bit ADCs.
The ADCs and SSD front-end ASICs were controlled and read out in sync by a field programmable gate array (FPGA) which sent an event-by-event data stream to the data acquisition (DAQ) computer via an Ethernet link. The DAQ system recorded both the tracking and energy information at a maximum rate of approximately 105 protons per second; but the effective data rate the system could handle was only a few kS/s because of the 1:1 duty cycle of the LLU synchrotron, the time needed for the projection angle increments and the large number of pile-up events caused by inherent spikes in the accelerator intensity. With this effective data rate, it took about 4.5 hours to perform a full 360 ° scan with 90 projections.
3.1. Phase I pCT scanner calibration and performance tests
In our initial pCT experiments with the small tracker prototype, we performed absolute energy detector calibration with mono-energetic proton beams in order to use Eq (1) for WEPL evaluation. For Phase I, we developed an alternative approach of calibrating the response of the segmented calorimeter directly in WEPL units using a set of plates of known water-equivalent thickness [17], similar to the calibration method suggested by Schneider for proton radiography[18]. Unlike Schneider’s approach, our approach did not require knowledge of the incoming proton energy Ein or calibration of the ADC output in energy units; instead, we just recorded the energy detector output in ADC counts for a set of precisely machined polystyrene plates arranged with water-equivalent thicknesses in the required WEPL range of 0–260mm for 200MeV protons. Fitting these data with a second order polynomial, we obtained a calibration curve to convert ADC counts into WEPL, i.e., the value of the RSP integral required for 3D reconstruction of RSP. Since we calibrated the energy detector in WEPL units, we refer to it as “WEPL detector”.
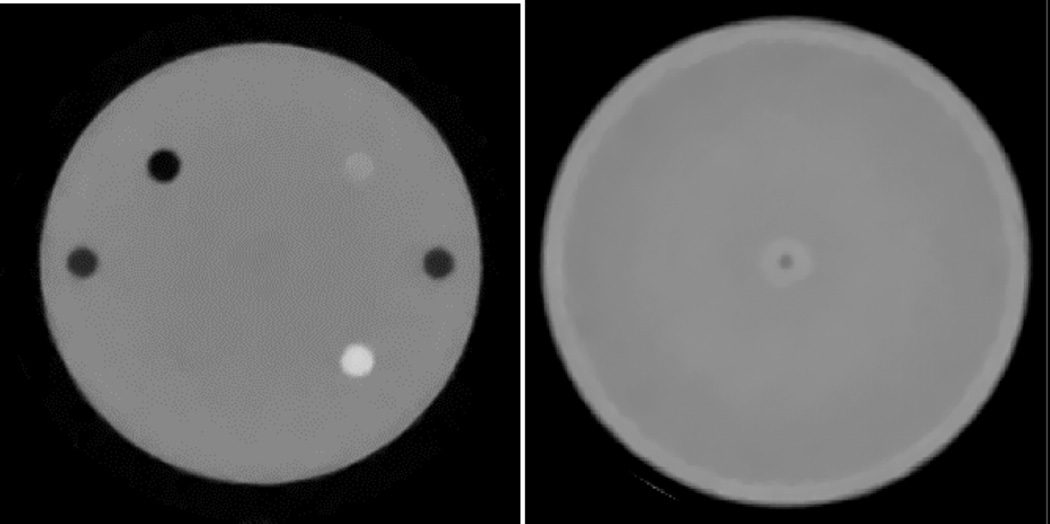
With the calibrated Phase I scanner, first 200 MeV proton beam data were acquired using the spherical Lucy™ QA head phantom from Standard Imaging. About 140 million proton events were recorded during a complete scan; and the dose to the phantom during this scan was estimated to be of the order of 0.5 mGy. The 3D phantom image (Fig.6, left pane) was then reconstructed from these data with reconstruction software developed by Penfold et al. in collaboration with the mathematician Yair Censor [19]. The reconstruction was performed on a dual graphical processing unit (GPU) workstation. The Lucy phantom is made of polystyrene and has four cylindrical wells; for the scan one was left empty, and the other three were filled with tissue equivalent materials of known RSP - polystyrene, bone substitute, and acrylic. The reconstructed RSP values for these materials were 1.035, 1.68, and 1.19, thus within 1% of the RSP values have been measured in charged particle beams [20]. Similar reconstruction accuracy was obtained in the pCT scan of a 14 cm diameter cylindrical water phantom with 0.5 cm acrylic walls; for the water content, the reconstructed RSP was found to be 0.995±0.006, 0.006, in fact, very close to the true value of 1.000.
Fig. 6.
Left: reconstructed slice of the spherical Lucy phantom [19]. Bone, lucite and air inserts are visible (as well as pegs at the left and right sides of the phantom connecting phantom hemispheres). The polystyrene cylinder (lower left insert) is barely distinguishable because its stopping power is practicaly the same as that of polystyrene phantom body. Right image: reconstructed slice of the water phantom[17]; the central ring is an artifact caused by the incompletely corrected overlap of Si tracker planes planes.
A careful analysis of the reconstructed images and associated RSP distributions showed that there were systematic ring artifacts in the reconstruction. The central artifact, most clearly seen in the uniform water phantom reconstruction is related to the 5 mm overlap region of the tracker planes mentioned above, which adds about 2mm water-equivalent thickness to the WEPL value of protons going through this region. Correction for such events using tracking information is complicated because of MCS both in the trackers and phantom. On the other hand, an insensitive gap of a few mm inbetween SSDs in case of side-by-side SSD tiling would have produced even larger artifacts as shown by MC simulations [19]. This problem was later addressd in the Phase II pCT scanner design. There were other ring artifacts, which were associated with variations in the signal from individual calorimeter crystals and proton energy loss in the reflective wrapping surrounding each crystal [19], which resulted in degradation of the energy resolution for protons ranging from 0.5% for the central region of a single crystal to more then 2% when averaged over the calorimeter sensitive area. It was shown, that these artifacts could be significantly suppresed by rejecting protons entering the detector within a few mm of the crystal borders, as defined by the track extrapolation from the rear tracker to the calorimeter, and by peforming a second scan after shifting the phantom in the transversal plane. Such approach, while appropriate for the initial performance studies, is clearly impractical in clinical applications, because it would increase the dose to patient and increases the full scan time. This problem caused by transverse segmentation of the WEPL detector led us to give up the original calorimeter design based on array of fast inorganic scintillators, and search for a better solution.
4. R&D for design of the Phase II pCT WEPL detector
Plastic scintillators, commercially available as large-sized blocks, formed the basis for the fast Phase II WEPL detector without the transverse segmentation of the Phase I detector. Though less dense and, therefore, requiring a larger thickness to stop protons (about 25 cm for 200 MeV protons), plastic scintillator material weighs by almost a factor two less than its inorganic counterpart with the same integral stopping power. The main problem in application of a large size plastic scintillator for calorimetric WEPL measurements is its relatively poor intrinsic energy resolution. To address this, we set out to find a Phase II WEPL detector design with less stringent requirements for intrinsic energy resolution.
The first design option we considered was based on the well-known range counter approach [21] (also see [22] and references therein). In the range counter, protons stop in a long stack of thin scintillating tiles, each of them working as a scintillating counter. Calibrating the range counter response (the number of consecutively firing counters) in WEPL units in the same manner as the Phase I calorimeter as described in the previous section, one can measure WEPL of each proton traversing the scanned object. To further investigate this concept, we performed a Geant4-based MC study of a hypothetical WEPL detector composed of polystyrene scintillating tiles with thickness of 1, 3, 4, and 6 mm. It was found that the WEPL resolution for 200MeV protons is in the 3.5 - 4 mm range and only weakly depends on the tile thickness. For 4mm polystyrene tiles, such detector requires about 60 counters to measure the WEPL of 200 MeV protons. To produce it light, compact, and technologically simple design, we proposed to use modern silicon photomultipliers coupled directly to the clipped corner of the scintillating tile for the scintillating light readout. We built two such counters with a sensitive area of 40 × 15 cm2 using polystyrene-based scintillating tiles of 3.75 mm thickness (or ~ 4mm when wrapped with reflecting material). The scintillating tiles were directly read out by Hamamatsu silicon photomultipliers (MPPC S10362-33-050C) with 3 × 3 mm2 sensitive area. In a beam test performed at the LLU proton accelerator, the counters provided a high photoelectron yield of about 40 photoelectrons per 200 MeV proton. With a threshold value of 5 photoelectrons, the counters demonstrated close to 100% counting efficiency over their entire sensitive area. Thus, the range counter approach was found to be suitable for the Phase II WEPL detector.
We also studied a second option that utilized a novel multi-stage WEPL detector design combining calorimetric and range measurements [23]. In contrast to the range counter, the multi-stage WEPL detector consists of only a small number (n= 3–5) of scintillating tiles (stages), and its response is defined by both the number of fired stages and the energy deposited by the proton stopping in the most distal stage. Because the range of energies deposited by stopping protons in the stage is proportional to the stage depth and hence is a factor 1/n smaller than in the calorimetric measurements, the energy resolution of each stage does not need to be nearly as good to achieve comparable WEPL measurement accuracy. Using the calibration method outlined in Section 3.1, the multi-stage detector can be calibrated in WEPL units, but in this case, the calibration curve has to be evaluated for each individual stage and thus requires additional calibration points. As shown in [23], a multistage detector with only five stages and a moderate intrinsic energy resolution performs much better than the Phase I CsI calorimeter over the entire WEPL range, and its resolution was found to be about 30% better than in the range counter approach discussed above.
5. The Phase II pCT scanner
The R&D work for the Phase II WEPL detectors set the stage for the Phase II pCT scanner design. This Phase aimed at increasing the data rate to the MS/s range while maintaining required measurement accuracy. In the new design, we took into consideration the lessons learned from the experimental results obtained with the Phase I scanner, results of the R&D for the fast WEPL and tracking detectors, and extensive Geant4 simulations. In comparison with the Phase I pCT scanner, the Phase II scanner design featured the following major improvements:
Doubling of the sensitive area of the SSD trackers to 9 × 36 cm2 with reduced gaps and no overlaps [24].
A custom application specific integrated circuit (ASIC) for the SSD readout, designed for the fast data rate [25].
A 5-stage WEPL detector based on plastic scintillators allowing processing of WEPL measurements at a MS/s rate [23].
A DAQ system capable of acquiring proton events at a sustained rate in excess of 1 MS/s [26].
A brief description of the Phase II detectors follows in the subsections below.
5.1. Tracking modules
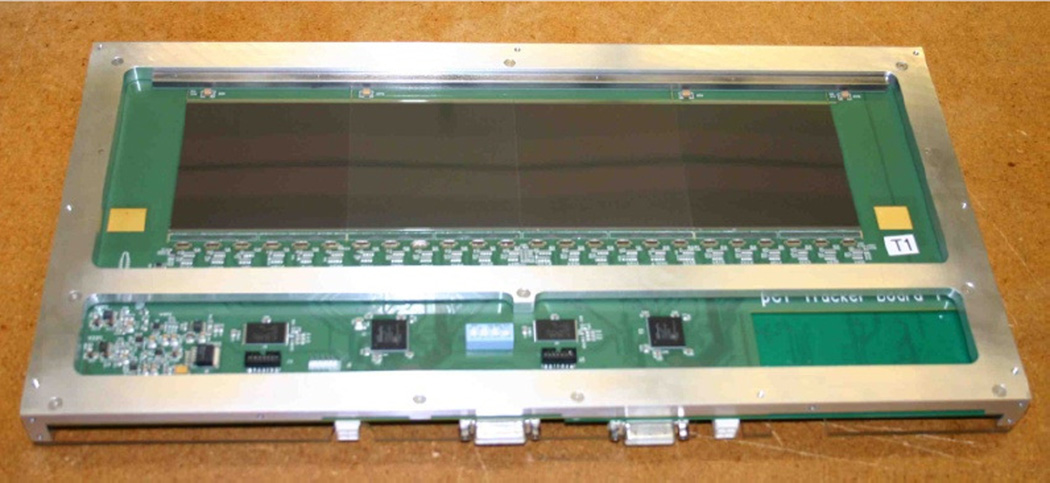
The front and rear tracking modules of the Phase II scanner contains 32 single-sided SSDs, each with a sensitive area of 8.95 × 8.95 cm2 and a strip pitch of 228 µm, the same we used in the Phase I trackers. To achieve a nearly continuous sensitive area with minimal gaps and without overlapping sensors, we re-cut the edges of the sensors to a minimal width [27]. Four sensors are mounted side-by-side on a printed circuit board (PCB), which also accommodates the front-end electronics [26]. The PCB is cut out under the sensors thus composing uniform (2mm water equivalent) continuous sensitive area of 8.95 × 35.6 cm2. Two back-to-back PCBs with orthogonal orientation of SSDs strips make up a 2D coordinate detector and are installed using locating pins in a precisely machined aluminum cassette (Fig.7). Two such cassettes, 50 mm apart, form a tracking module. The 50 mm detector spacing is slightly above the minimal distance required for good spatial resolution, which was defined by a Gean4 simulation carried out to investigate the influence of the detector spacing on the MLP reconstruction accuracy.
Figure 7.
Cassette with two PCBs installed. PCB accommodating 4 SSDs with vertical strip orientation is visible. 24 custom 64-channel frontend ICs [25] are positioned along the edge of the sensitive area to amplify and digitize the signals from the strips.
Alignment pins were used to locate the cassettes in an aluminum housing of the tracking module, providing an overall mechanical alignment accuracy of the SSDs better than 100 µm. The aluminum housing is equipped with 50 µm thick blackened aluminum-foil windows overlapping the sensitive area, which shields SSDs from ambient light and external EM noise, while minimizing the amount of material on the proton paths.
5.2. 5-stage WEPL detector
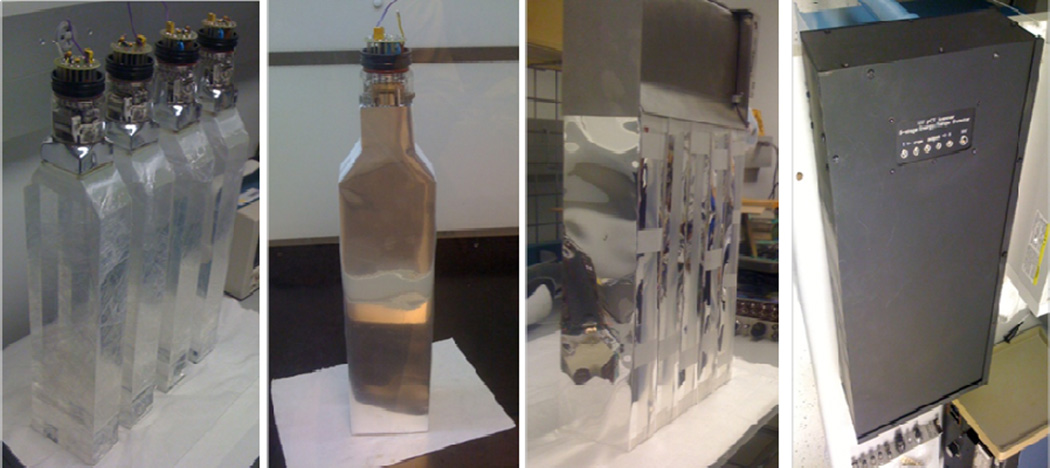
The 5-stage detector is designed for WEPL measurements in the 0–260 water-equivalent mm range required for a head scan with a 200 MeV proton beam. The WEPL range defines the thickness of each stage to be about 260/5 = 52 water-equivalent millimeters. The detector scintillating material is polystyrene-based UPS-923A, which provides high light output, low light attenuation, and long-term stability [28]. Polystyrene’s RSP is about 1.038, so the stage thickness should be not less than 50 mm. We chose 51 mm to fit a two-inch photomultiplier. The lateral stage sensitive area must overlap fully that of the tracking system, which is 8.95 × 35.6 cm2. We used 10 cm × 40 cm × 5.1 cm scintillator slabs with edges on one side beveled at an angle of 35° to form a built-in light guide that fits the two-inch square window of a Hamamatsu R3318 photomultiplier tube (PMT). All scintillator sides were optically polished, and the PMTs were glued with optical epoxy to the scintillators as shown in the first pane of Fig. 8. Each scintillator-PMT assembly was cladded with reflective material as shown in the second pane. The material used was Vikuiti™ ESR film (3M, St. Paul, MN), 65 µm thick, with greater than 98% reflectance (improved VM2000 film). All five wrapped stages were stacked together, and the PMT’s were covered with a combined mu-metal/soft-steel shielding as shown in the third pane of Fig. 8. The complete 5-stage assembly was enclosed by a steel housing with 10 cm × 37 cm entrance window made from 50 µm-thick blackened aluminum foil, which shields the PMTs from light while minimizing amount of material on proton paths (last pane in Fig. 8).
Figure 8.
Assembly of the 5-stage detector
All five PMTs were wired to be powered in parallel. The first seven PMT dynodes operate from a single −800 V supply that passes current through passive dividers using resistors and Zener diodes. These low current dividers are located on the PMTs and equipped with trimpots to equalize stage gains. The final three dynodes operate from a −365 V supply and a custom voltage-divider circuit, composed of high voltage transistors and Zener diodes, which supply the three dynodes of each PMT with stable voltages and relatively high current, as is necessary for PMTs gain stability at high proton rate. A custom board was designed to digitize the PMT signals as a part of pCT DAQ system, which has been described elsewhere [26].
5.3. Phase II pCT scanner calibration and performance tests
For initial tests, the Phase II pCT scanner was installed on the research beam line of the LLU clinical proton synchrotron, about 3 m downstream of the horizontal beam-line exit window (Fig.9). At LLU, we used a relatively low intensity 200 MeV proton beam scattered by two one-millimeter thick lead foils installed in front of the vacuum exit window, which provided a Gaussian cone beam with about an 8 cm sigma at the front tracker.
Figure 9.
Left pane: The Phase-II pCT head scanner installed in the research beam line at Loma Linda proton synchrotron. The front tracker (A), rear tracker (B), the phantom rotation stage (C), and 5-stage detector (D) are labeled. The red arrow indicates the proton beam direction. Right pane: the same scanner installed on a robotic arm in gantry room at Northwestern Medicine Chicago Proton Center.
The beam intensity was quite non-uniform during the two-second proton spill. Despite some attempts to tune the accelerator operation better, it varied from a maximum of a few million protons/s in the beginning of the spill down to a few hundreds of thousands of proton/s at the spill end. At present, the scanner is undergoing tests at the Northwestern Medicine Chicago Proton Center in Warrenville, IL, where a wobbled proton beam of adjustable horizontal and vertical size is delivered by an isochronous 230 MeV cyclotron thus providing a uniform lateral beam profile at relatively constant intensity (+/− 10%) tuned to a rate of ~ 1 million protons/s.
For the Phase II design, we developed a novel calibration procedure, which takes just a few minutes of the initial beam time, and is performed at the beginning of a scanning session. The first step in the calibration procedure is to measure and parameterize the dependence of the detector response on the lateral location of the proton path in the scintillator. To this end, we use tracking information: track segments are extrapolated from the rear-tracking module to a stage area subdivided into 0.5 cm × 0.5 cm bins, ADC count distributions are accumulated for each bin and averaged over a large sample of single-track events. The resulting 3D distribution represents the spatial variations in the stage response along horizontal (T) and vertical (V) axis in the detector coordinate system. To parameterize that position dependence, the 3D distribution for each stage is fitted with a quadratic function of T and V coordinates as shown in the left pane of Fig. 10 for the first stage. The fitted function is used to correct the stage response for proton track location. The corrected 3D distribution is shown in the right pane in Fig. 10. That correction procedure reduces the spatial variation to less than 0.4 % (RMS) over the entire sensitive area except for small regions close to PMT, which are not used for head image reconstruction.
Fig. 10.
Left pane: parameterization of stage response with quadratic function of T and V coordinates. Right pane: stage response in energy units, corrected for track position.
After evaluation of the position correction functions, the system needs to be calibrated to convert the five ADC counts into WEPL of the proton through the object being imaged. In the Phase I pCT scanner the calibration of the WEPL detector was performed in a few runs with a set of polystyrene plates of known thickness. The 5-stage detector used in the Phase II pCT scanner requires at least five times more calibration points (calibration phantom thicknesses), which makes the calibration procedure with a set of plates time-consuming and impractical. Therefore, a new step phantom, combined with a method utilizing tracking information, was developed to facilitate and expedite the WEPL calibration procedure.
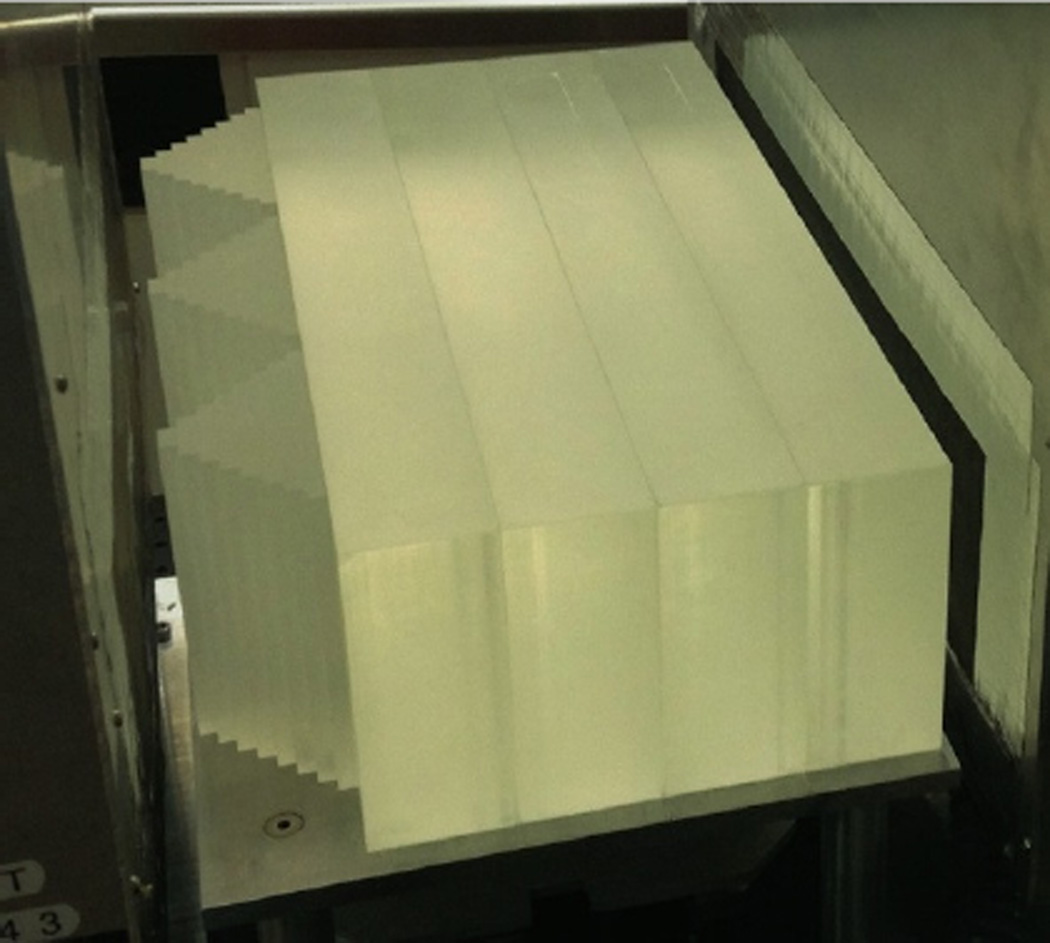
The new calibration phantom was machined in a shape of an eight-step pyramid made of polystyrene; each step size is 6.35 mm to give a maximum variation along the beam direction of 5.08 cm. Three such pyramids cover the entire area of the WEPL detector, providing nine WEPL calibration points simultaneously when irradiated with a broad proton beam. To cover the full range of WEPL, four removable polystyrene bricks with an area of 10 × 40 cm2 and 5.08 cm thickness are attached sequentially during the calibration procedure. The maximum polystyrene thickness that can be traversed by a proton is thus 25.4 cm; therefore, the calibration set-up provides 41 WEPL calibration points in the 0 – 263.7 mm WEPL range. The step phantom with all four additional bricks installed between the tracking modules during a calibration procedure is shown in Fig. 11.
Fig. 11.
Calibration set-up: polystyrene step phantom with four additional polystyrene bricks installed in-between tracking modules.
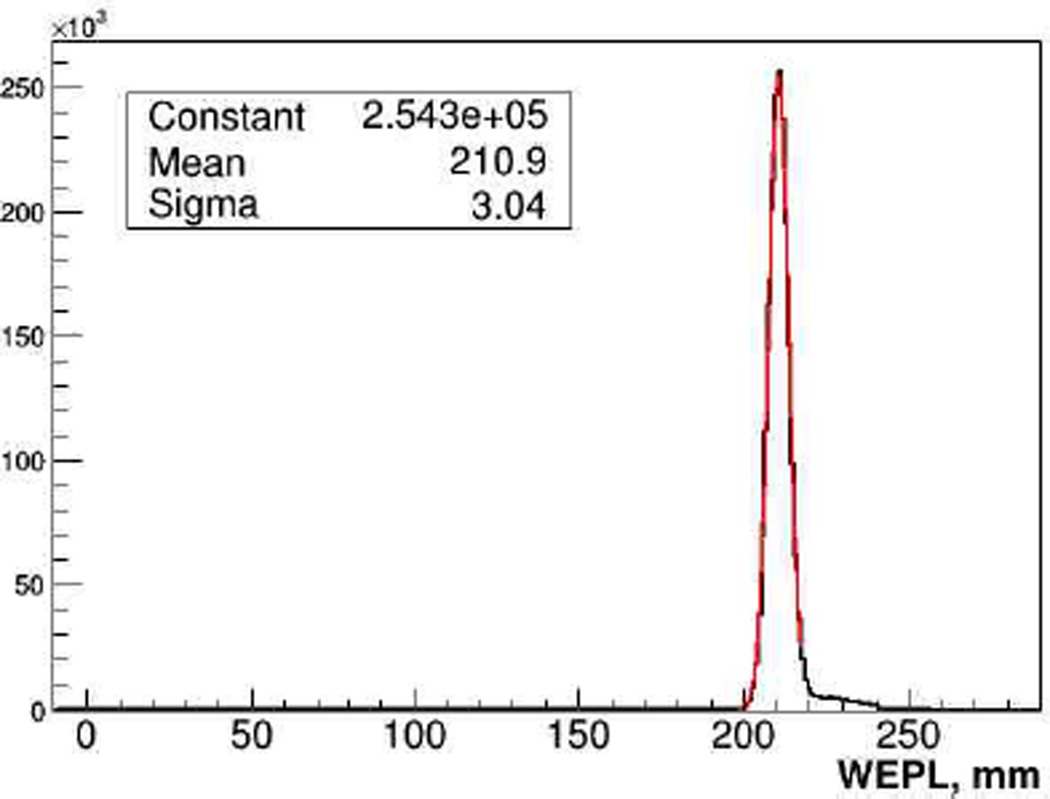
The calibration procedure is performed in five consecutive runs in addition to an “empty” run with no phantom installed: data are first taken with just the step phantom installed, and then the bricks are added one by one, thus producing 9 WEPL calibration points per run. To establish a calibration curve, i.e., WEPL as a function of ADC counts in each stage, for every proton stopped in a stage the path length through the calibration phantom is reconstructed using tracking information. The path length, multiplied by the RSP of polystyrene (1.038), defines proton WEPL through the phantom, and the ADC count in that stage is recorded for this WEPL. Recorded data sets are used to fit the five individual WEPL calibration functions as described in Sections 3.1 and 4. Correctness and accuracy of the WEPL detector calibration was verified by proton radiographs of objects with known RSP distribution. It was found, that in all cases reconstructed WEPL value agreed with the true value within 1%, a level of accuracy that is necessary to attain the clinical specification. The average WEPL uncertainty per proton in the full WEPL range was evaluated to be 3.0±0.2 mm, close to the 200-MeV proton range straggling limit of 2.8 mm. As an example, Fig.12 shows reconstructed WEPL distribution for about one million 200 MeV protons traversing an 8 ± 0.01 inch thick polystyrene slab.
Figure. 12.
WEPL distribution for 1M 200 MeV protons traversing a 203.2 mm thick (211 mm water equivalent) polystyrene slab.
Figure 12. WEPL distribution for 1M 200 MeV protons traversing a 203.2 mm thick (211 mm water equivalent) polystyrene slab.
The right-sided WEPL tail visible in Fig. 12, which is present in all distributions, is attributed mainly to nuclear interactions of protons in the phantom or scanner detectors, which also skew and broaden the main peak to some degree. Presently events with a large WEPL deviation from the main peak are removed during the CT reconstruction by binning proton histories into intervals and applying appropriate cuts on scattering angle and WEPL. We are currently investigating the possibility to perform cuts by analyzing the energy deposition pattern in all stages. Nevertheless, the already attained good accuracy of the single proton WEPL reconstruction minimizes the total number of protons required to obtain high quality images and hence the total dose delivered to the patient during the scan.
5.4. Phantom imaging with Phase II pCT scanner
With the calibrated Phase II pCT scanner, a number of phantom scans have already been performed both at LLU and the Northwestern Medicine Chicago Proton Center in order to evaluate the scanner performance and provide data for optimizing the reconstruction software development described in [29, 30]. The pCT reconstruction development and its computational aspects will be subject of separate publications in the near future.
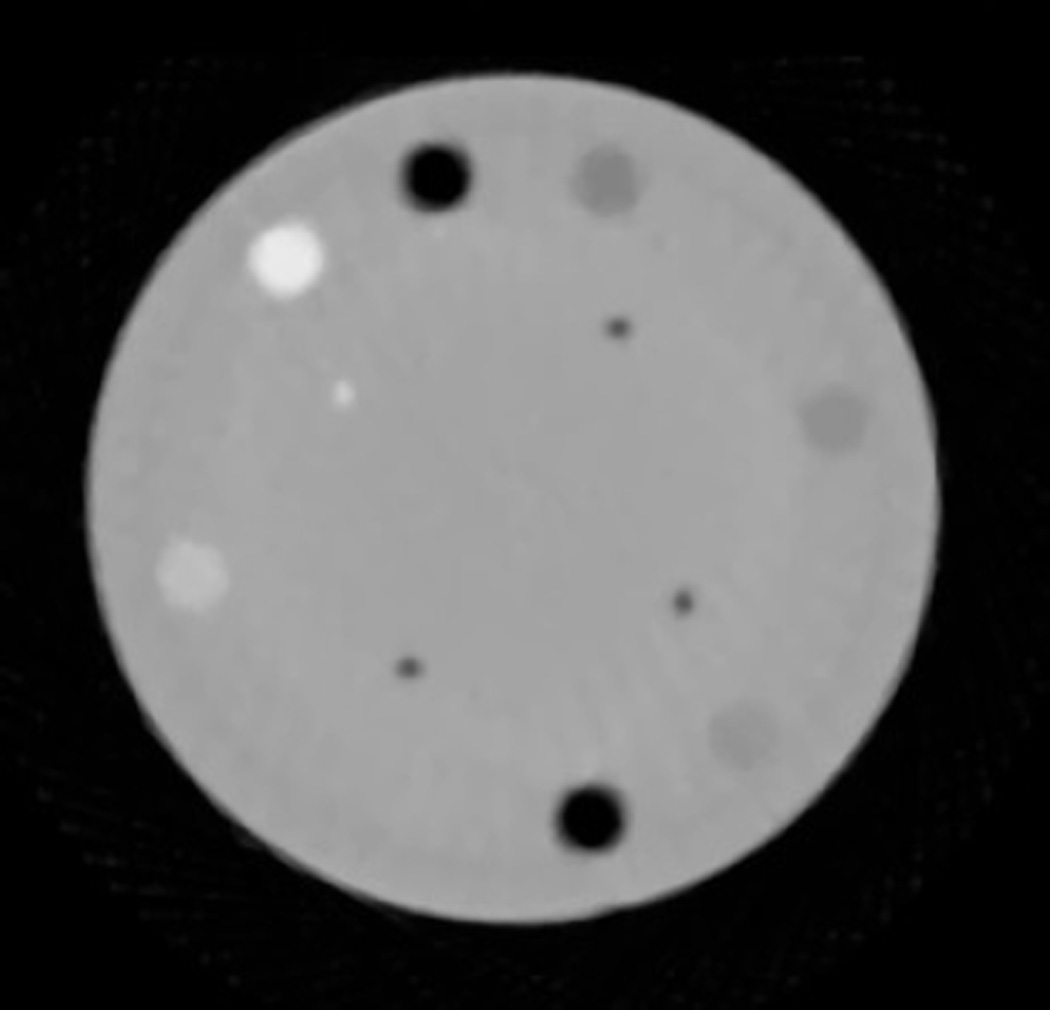
The first phantom scan results to date demonstrate that at the present stage the scanner detectors, DAQ and pCT reconstruction software performance for the 3D RSP map reconstruction is already close to the desired clinical specification. As an example, Figure 13 shows a slice of the 3D RSP distribution reconstructed with a beta version of the pCT software from about 75 million WEPL values of protons traversing the CTP404 module of the Catphan® 600 series phantom (Phantom Laboratory, Salem, NY). The CTP404 module incorporates several cylindrical insets of different RSP (Teflon, Delrin, Lucite, polystyrene, water-equivalent plastic, LDPE, PMP, air). The reconstructed RSP map of the phantom reproduces RSP values of all inserts with accuracy required by clinical specifications.
Figure 13.
Axial 2D image of the CTP404 module reconstructed with data from the Phase II pCT scanner.
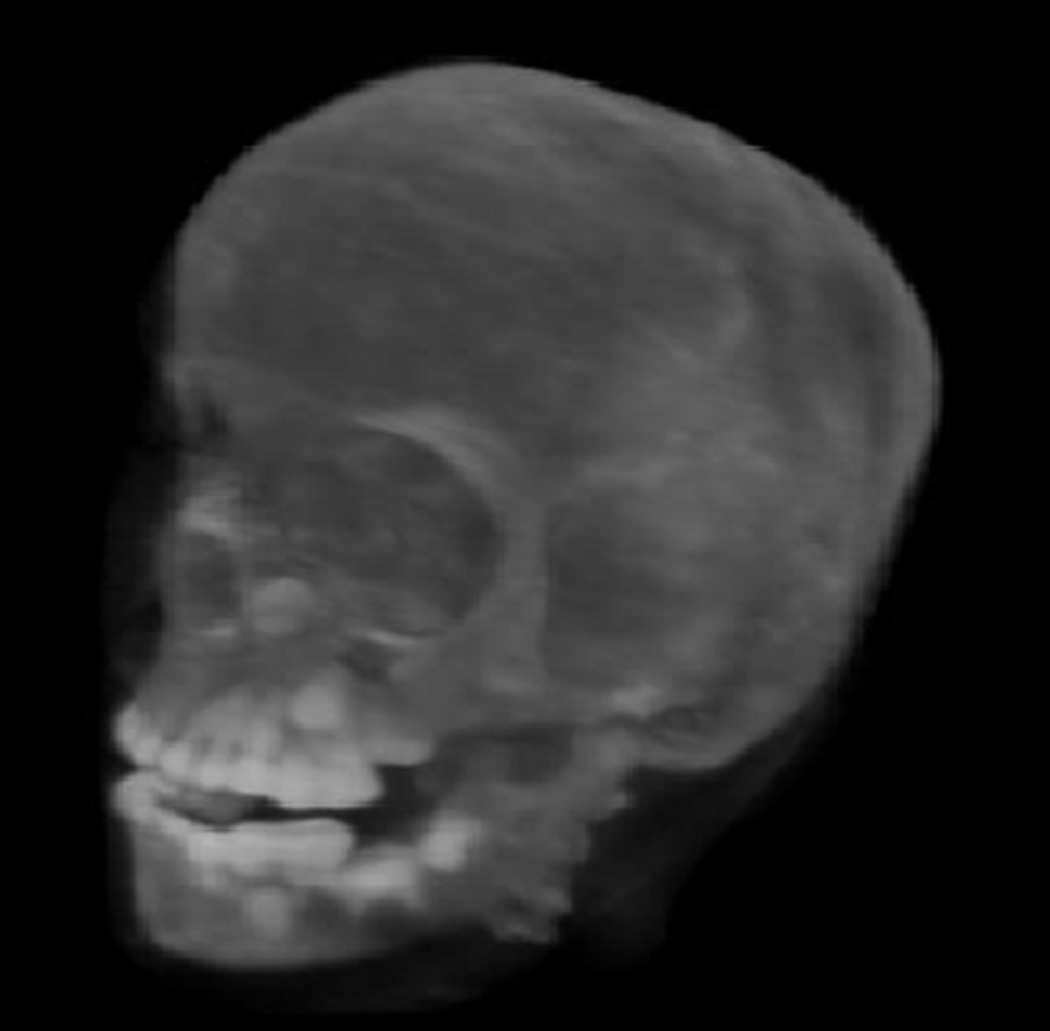
The reconstructed 3D RSP maps can be converted into the standard DICOM format that is used by contemporary treatment planning systems. In addition, volumetric 3D reconstructions, e.g. the pCT image of the CIRS head phantom obtained with the Phase II pCT scanner (Fig. 14) have been tested as input for a 3D-to-3D alignment procedure for treatment-room positioning.
Figure 14.
3D rendering of the pCT-reconstructed RSP map of a pediatric anthropomorphic head phantom.
At present, with about 6–10 minutes at the Chicago cyclotron and 20–50 minutes at the LLU synchrotron, caused by the 1:1 duty cycle and spill non-uniformity, the pCT scan duration is longer than desired clinically (2–5 minutes). Further work is obviously needed on the accelerator and beam delivery system side as well as the pCT system side to shorten the scan duration by another factor 2–3 while maintaining the attained accuracy of RSP reconstruction.
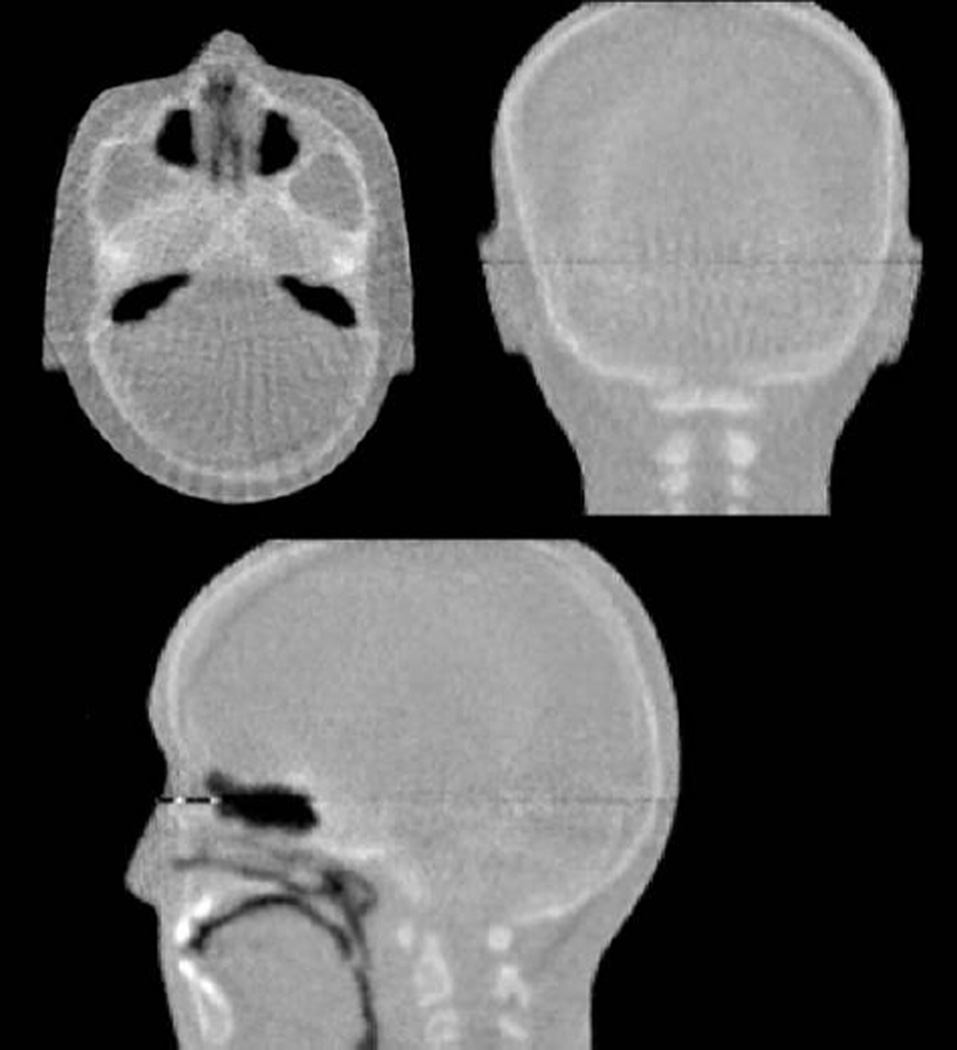
Work on evaluation of the Phase II scanner performance for in-room position verification and image guided proton therapy is in progress (Fig. 15). We are also developing an MLP-based algorithm for proton radiography that can produce radiographs that not only represent anatomical features used to the patient position verification, but also allows verification of the RSP map used for the treatment planning. These are promising developments with direct clinical application in hadron therapy.
Figure 15.
Three cardinal planes of 3D RSP images obtained with Phase II scans of the anthropomorphic head phantom. There are some artifacts in these images, which are currently being addressed in the reconstruction method
6. Conclusions
Since 2003, the pCT collaboration has developed the proton computed tomography and radiography technology to a stage where it is within reach of clinical implementation for hadron therapy. The main development milestones that made this possible are:
Development of the conceptual scanner design utilizing modern detectors registering individual protons (originally developed for HEP and astrophysics applications).
Introduction of the MLP concept significantly improving pCT spatial accuracy
Development of the tracking detectors with uniform sensitive area (slim edge technology)
Development of a novel energy/range detector optimized for WEPL measurements
Development of a fast readout electronics and DAQ system reliably operating at MS/s data rates
Development of the reconstruction software capable to reconstruct 3D RSP map of scanned object in clinically reasonable time with specified accuracy.
Still additional work is obviously required before the first pCT system will be ready for clinical use. First, we need to reduce the full scan time by another factor 2–3. We plan to achieve this goal through increase of data rate by a factor of about two by modifying the DAQ system and shortening the WEPL detector signal from presently 100 ns to 30–40 ns that will convert part of the current pile-up events into events useful for reconstruction thus incising efficacy of proton beam utilization. Further reduction of the scan duration can be attained by implementing continuous readout instead of the discrete 4° step-and-shoot technique currently implemented, thus eliminating the time spent on performing the angle increments without data taking. Implementation of the continuous 360° scan will be especially important for a clinical environment with continuous gantry rotation, because it is impractical to do a pCT scan in a reasonable time with a multi-ton proton gantry operating in a step-and-shoot mode. Integration of a pCT scanner into a gantry room will require close collaboration with industrial partners developing proton beam delivery systems.
While the Phase II pCT scanner hardware is already capable to provide high-quality data for tomographic and radiographic images, the low-dose aspect needs to be further investigated, and software for in-room positioning and treatment plan adaptation need to be further developed.
Acknowledgments
The authors would like to thank a large number of individuals (physicists, engineers, accelerator staff, postdocs and students) who have contributed to the success of the pCT collaboration. Naming all of them is impossible. Many these individual contributors are listed as authors in the referenced publications. The authors would particularly like to acknowledge Robert Jones of Inland Technical Service for his mechanical engineering support. This work was supported in part by award number R01EB013118-01 from the National Institute of Biomedical Imaging and Bioengineering (NIBIB) of National Institutes of Health (NIH) and the National Science Foundation (NSF). Proton CT reconstruction has been supported by grants from the U.S. Israel Binational Science Foundation (BSF) grants no. 2013003 and 2009012. The development of the Phase I scanner was supported by the U.S. Department of Defence Prostate Cancer Research Program, award No. W81XWH-12-1-0122 and the Department of Radiation Medicine at Loma Linda University Medical Center. The content of this paper is solely the responsibility of the authors and does not necessarily represent the official views of NIBIB, NIH, and NSF.
Footnotes
Publisher's Disclaimer: This is a PDF file of an unedited manuscript that has been accepted for publication. As a service to our customers we are providing this early version of the manuscript. The manuscript will undergo copyediting, typesetting, and review of the resulting proof before it is published in its final citable form. Please note that during the production process errors may be discovered which could affect the content, and all legal disclaimers that apply to the journal pertain.
References
- 1.Hanson KM, et al. Phys. Med. Biol. 1981;26:965. doi: 10.1088/0031-9155/26/6/001. [DOI] [PubMed] [Google Scholar]
- 2.Cormack A. J. Appl. Phys. 1963;34:2722. [Google Scholar]
- 3.Cormack AM, Koehler AM. Phys. Med. Biol. 1976;4:560. doi: 10.1088/0031-9155/21/4/007. [DOI] [PubMed] [Google Scholar]
- 4.Hanson KM. IEEE Trans. Nucl. Sci. 1979;26:1635–1640. [Google Scholar]
- 5.Schulte R, et al. IEEE Trans. Nucl. Sci. 2004;51:866. [Google Scholar]
- 6.Schneider U, Pedroni E. Medical Physics. 1994;21:1657. doi: 10.1118/1.597212. [DOI] [PubMed] [Google Scholar]
- 7.Williams DC. Phys. Med. Biol. 2004;49:2899. doi: 10.1088/0031-9155/49/13/010. [DOI] [PubMed] [Google Scholar]
- 8.Li T, Liang Z, Singanallur JV, Satogata TJ, Williams DC, Schulte RW. Medical Physics. 2006;33:699. doi: 10.1118/1.2171507. [DOI] [PMC free article] [PubMed] [Google Scholar]
- 9.Bruzzi M, et al. IEEE Trans. Nucl. Sci. 2007;54:140. [Google Scholar]
- 10.Bashkirov V, et al. AIP Conference Proceedings. In: McDaniel FD, Doyle BL, editors. Fort Worth, TX. 2008. p. 460. [Google Scholar]
- 11.Schulte RW, Penfold SN, Tafas JT, Schubert KE. Medical Physics. 2008;35:4849. doi: 10.1118/1.2986139. [DOI] [PubMed] [Google Scholar]
- 12.Wagner A, et al. Nucl. Instrum. Meth. A. 2001;456:290. [Google Scholar]
- 13.Ohsugi T, et al. Nucl. Instrum. Meth. A. 2005;541:29. [Google Scholar]
- 14.Johnson RP, et al. IEEE Transa. Nucl. Sci. 1998;45:927. [Google Scholar]
- 15.Missaghian J, et al. J. Instrum. 2010;5:6001. [Google Scholar]
- 16. www.cremat.com/CR-110.pdf, www.cremat.com/CR-200.pdf. [Google Scholar]
- 17.Hurley RF, et al. Med. Phys. 2012;39 doi: 10.1118/1.3700173. [DOI] [PMC free article] [PubMed] [Google Scholar]
- 18.Ph.D. Thesis. Villigen, Switzerland: Paul Scherrer Institute; 1994. U. Schneider Proton Radiography: A tool for quality control in proton. [Google Scholar]
- 19.Ph.D. Thesis. Australia: University. of Wollongong; 2010. S. Penfold, Image Reconstruction and Monte Carlo Simulations in the Development of Proton Computed Tomography for Applications in Proton Radiation Therapy. [Google Scholar]
- 20.Moyers MF, Sardesai M, Sun S, Miller DW. Med Dosim. 2010;35:179. doi: 10.1016/j.meddos.2009.05.004. [DOI] [PubMed] [Google Scholar]
- 21.Zatserklyaniy A, et al. Proceedings of the 2012 IEEE NSS–MIC. Anaheim,CA: [October 29–November3, 2012]. p. 1326. [Google Scholar]
- 22.Amaldi U, et al. Nucl. Instrum. Meth. A. 2011;629:337. [Google Scholar]
- 23.Bashkirov VA, et al. Scintillation Detector Design and Performance for Proton Radiography and Computed Tomography. Med. Phys. doi: 10.1118/1.4939255. submitted to. [DOI] [PMC free article] [PubMed] [Google Scholar]
- 24.Sadrozinski HF-W, et al. Nucl. Instrum. Meth. A. 2013;699:205. doi: 10.1016/j.nima.2012.04.029. [DOI] [PMC free article] [PubMed] [Google Scholar]
- 25.Johnson RP, et al. IEEE Trans. Nucl. Sci. 2013;60:3262. doi: 10.1109/TNS.2013.2274663. [DOI] [PMC free article] [PubMed] [Google Scholar]
- 26.Johnson RP, et al. A Fast Pre-Clinical Head Scanner for Proton CT, submitted to IEEE Trans. Nucl. Sci [Google Scholar]
- 27.Christophersen. M, et al. Nucl. Instrum. Meth. A. 2013;699:14. [Google Scholar]
- 28.Artikova A. Nucl. Instrum. Meth. A. 2005;555:125. [Google Scholar]
- 29.Penfold SN, et al. Med. Phys. 2010;37 doi: 10.1118/1.3504603. [DOI] [PMC free article] [PubMed] [Google Scholar]
- 30.Penfold SN, Schulte RW, Censor Y, Bashkirov V, McAllister S, Schubert KE, Rosenfeld AB. Biomedical Mathematics: Promising Directions in Imaging, Therapy Planning and Inverse Problems. Madison, WI: Medical Physics Publishing; 2010. chapter Block-Iterative and String- Averaging Projection Algorithms in Proton Computed Tomography Image Reconstruction: pages pp. 347–367. [Google Scholar]


