

Abstract
Excitotoxicity was originally postulated to be a late stage side effect of Alzheimer’s disease (AD)-related neurodegeneration, however more recent studies indicate that it may occur early in AD and contribute to the neurodegenerative process. Tau and amyloid beta (Aβ), the main components of neurofibrillary tangles (NFTs) and amyloid plaques, have been implicated in cooperatively and independently facilitating excitotoxicity. Our study investigated the roles of tau and Aβ in AD-related excitotoxicity. In vivo studies showed that tau knockout (tau−/−) mice were significantly protected from seizures and hippocampal superoxide production induced with the glutamate analog, kainic acid (KA). We hypothesized that tau accomplished this by facilitating KA-induced Ca2+ influx into neurons, however lentiviral tau knockdown failed to ameliorate KA-induced Ca2+ influx into primary rat cortical neurons. We further investigated if tau cooperated with Aβ to facilitate KA-induced Ca2+ influx. While Aβ biphasically modulated the KA-induced Ca2+cyt responses, tau knockdown continued to have no effect. Therefore, tau facilitates KA-induced seizures and superoxide production in a manner that does not involve facilitation of Ca2+ influx through KA receptors (KAR). On the other hand, acute pretreatment with Aβ (10 minutes) enhanced KA-induced Ca2+ influx, while chronic Aβ (24 hours) significantly reduced it, regardless of tau knockdown. Given previously published connections between Aβ, group 1 metabotropic glutamate receptors (mGluRs), and KAR regulation, we hypothesized that Aβ modulates KAR via a G-protein coupled receptor pathway mediated by group 1 mGluRs. We found that Aβ did not activate group 1 mGluRs and inhibition of these receptors did not reverse Aβ modulation of KA-induced Ca2+ influx. Therefore, Aβ biphasically regulates KAR via a mechanism that does not involve group 1 mGluR activation.
Keywords: Alzheimer’s disease, excitotoxicity, amyloid beta, tau, group 1 metabotropic glutamate receptors, kainate receptors
1. Introduction
Excitotoxicity has gained considerable attention as a mediator of AD pathogenesis over the past several decades. Early evidence from epidemiological studies showed that AD patients are at significantly greater risk of developing late onset unprovoked seizures compared to age-matched healthy controls. Many of these early studies excluded patients with any history of seizures, which biased the findings toward AD diagnosis preceding seizure onset (Amatniek et al., 2006; Hauser et al., 1986; Hesdorffer et al., 1996; Romanelli et al., 1990). However, more recent evidence suggests excitotoxicity can start early in AD and may manifest as subtle epileptiform activity that is hard to detect in human patients. A recent retrospective, observational study found that patients with amnestic mild cognitive impairment (aMCI) or AD with comorbid epilepsy or epileptiform activity experienced cognitive decline and were diagnosed with AD or aMCI much earlier than those without epilepsy. In addition, seizures and epilepsy diagnosis often began early in AD progression (at a mild to moderate disease state) and often preceded or coincided with aMCI or AD diagnosis (Vossel et al., 2013). Indeed, an earlier study found that 2 out of the 10 AD patients who developed seizures, did so prior to dementia diagnosis (Hauser et al., 1986). This suggests that AD-related seizure and excitotoxicity may occur earlier and play a more important role in AD progression than the initial findings suggested.
Aβ, the main component of amyloid plaques has been implicated in mediating excitotoxicity in AD. Several AD mouse models expressing mutations in the amyloid precursor protein (APP) and presenillin 1 (PS1) genes that lead to increased production and accumulation of pathologic forms of Aβ exhibit abnormal neuronal membrane characteristics and hyperexcitability. For example, APPK670N/M671L/PS1M146V mice display increased intrinsic excitability of CA1 pyramidal neurons and abnormal dendritic structure (Siskova et al., 2014). Another group found spontaneous epileptiform activity and seizures concurrent with Aβ pathology onset in APP695K595N/M596L/PS1dE9 mice. Cortical pyramidal neurons in slice preparations from these mice also exhibited depolarized resting membrane potential and increased excitability, which was mimicked in wild type (WT) mouse cortex and hippocampus after treatment with 1μM Aβ fibrils (Minkeviciene et al., 2009). These results were corroborated in a similar AD mouse model, APPKM670/671NL/PS1dE9, which also displayed spontaneous seizures, epileptiform discharges, and depolarized resting membrane and reversal potentials of γ-aminobutyric acid (GABA) currents in dentate granule cells in slice preparations. Again, slices from WT mice treated with Aβ42 protofibrils for one hour mirrored these effects (Zilberter et al., 2013).
Tau protein, the main component of NFTs, is also associated with AD-related excitotoxicity. Several studies have shown that reduction or absence of tau can ameliorate seizures and hyperexcitability in Aβ-forming AD transgenic mice. Studies using hAPPJ20 mice which express APP with Swedish and Indiana mutations (PDGF-APPKM670/671NL/V717F), show spontaneous non-convulsive epileptiform activity in hippocampus and cortex, accompanied by compensatory remodeling of GABAergic networks and expression of neuropeptide Y (NPY) and its receptors – all of which was prevented by genetic reduction of tau expression (Palop et al., 2007). In addition to dose-dependently reversing hAPPJ20 mouse spatial memory impairment, abnormal exploratory locomotor behavior, and early mortality, tau gene reduction also rendered hAPPJ20 and non-transgenic mice less susceptible to seizures induced by KA, or the GABA antagonist, pentylenetetrazol (PTZ) (Palop et al., 2007; Roberson et al., 2007; Roberson et al., 2011).
Since genetic reduction of tau appears to protect mice from pharmacologically induced seizures in the absence of any other mutations, several groups have begun to study how tau contributes to excitotoxicity independent of Aβ. One group reduced tau expression in a Kcna−/− mouse model in which hyperexcitability is induced by ablation of Kv1.1 delayed rectifying voltage gated potassium (K+) channels. Tau reduction decreased the frequency and duration of EEG seizure activity and hyperexcitability of CA3 pyramidal neurons, and increased survival in Kcna−/− mice. Two established drosophila models of human seizure disorders were also more resistant to bang-induced seizures when tau expression was reduced (Holth et al., 2013). To avoid confounding effects of compensatory changes observed in tau knockout models, another group knocked down tau expression in adult non-transgenic mice using antisense oligonucleotides. The group achieved significant reduction of endogenous tau expression throughout the central nervous system, which dose dependently protected mice from PTZ-induced seizures (DeVos et al., 2013). These studies suggest that tau plays an important role in excitotoxicity and that tau can act independent of, or in concert with, Aβ to elicit excitotoxicity.
The purpose of the present study was to further elucidate the roles of tau and Aβ in excitotoxicity. We examined the effect of reduced tau expression on KA-induced seizure and superoxide (a common reactive oxygen specie (ROS)) production in mouse brains and KA-induced Ca2+ influx in rat primary cortical neurons. Our results support previous findings that tau−/− mice are protected from KA-induced seizures and added that the absence of tau prevented KA-induced superoxide production in the hippocampi of these mice. We investigated whether tau accomplished this by facilitating KA-induced Ca2+ influx. Despite very efficient lentiviral knockdown of tau, no differences in KA-induced Ca2+ influx were observed in rat primary neurons transduced with scrambled and tau-shRNA viruses. Because tau and Aβ are proposed to work in concert to elicit AD pathology (Eckert et al., 2010; Quintanilla et al., 2012; Rhein et al., 2009), we tested whether Aβ pretreatment could exacerbate KA-induced Ca2+ influx and further, if tau reduction could prevent the effect of Aβ. We treated control and tau knockdown neurons with Aβ42 prior to KA treatment and found that Aβ42 had a biphasic effect on the KA-induced Ca2+cyt response and that this effect was not prevented by the reduction of tau expression. The biphasic effect of Aβ42 we observed on KA-induced Ca2+ influx mimics previously demonstrated modulation of KAR by group 1 mGluRs and protein kinase C (PKC) (Cho et al., 2003; Nasu-Nishimura et al., 2010; Rojas et al., 2013). In addition, Aβ has previously been shown to activate group 1 mGluRs and elicit downstream effects on glutamate receptor activity (Um et al., 2012; Um et al., 2013). Therefore, we investigated whether Aβ42 was modulating KAR by activating group 1 mGluRs. We found that inhibition of group 1 mGluRs did not reverse the effect of Aβ42 on KA-induced Ca2+ influx. Since group 1 mGluR activation leads to release of Ca2+ from internal stores, we further tested whether Aβ42 could activate these receptors by measuring Ca2+cyt fluxes in the absence of external Ca2+. Aβ42 elicited release of Ca2+ from internal stores that was similar to that of group 1 mGluR agonists, but was not inhibited by group 1 mGluR antagonists suggesting Aβ42 was not activating group 1 mGluRs in our model.
From these studies, we conclude that tau facilitates KA-induced seizures and subsequent ROS production in vivo independent of an effect on KA-induced Ca2+ influx. Further, Aβ42 modulates KA-induced Ca2+ signaling in a biphasic manner that may involve release of internal Ca2+ stores, but does not appear to be mediated by group 1 mGluRs.
2. Results
2.1. Tau facilitates KA-induced seizures in vivo
Previous studies have shown that reduction or ablation of tau expression in the absence of other mutations can protect mice from pharmacologically induced seizures (Holth et al., 2013; Ittner et al., 2010; Roberson et al., 2007; Roberson et al., 2011). We first confirmed these findings by treating 5–7 month old male WT or tau−/− mice with an intraperitoneal (i.p.) injection of 25mg/kg KA, which was considered a moderate to high dose based on previous studies (Roberson et al., 2007). Seizure behavior was video recorded for one hour post injection and was later scored by a blinded third party using a modified Racine scale (Racine, 1972). While seizure severity scores increase over time for both genotypes, the tau−/− mice increased significantly slower than the WT mice according to general estimating equation statistical analysis. Tau−/− mice treated with 25mg/kg KA experienced mild seizures that mostly consisted of immobilization and rigidity (Racine score of 1–2) with brief periods of head nodding (Racine score 3) in a fraction of the group. On the other hand, WT mice experienced significantly more severe seizures than the tau−/− mice beginning 40 minutes post injection (Fig 1 A). While, 80% of the WT mice treated with 25mg/kg KA experienced limbic motor seizures (Racine score of 4), 40% experienced tonic-clonic seizures (Racine score of 6), and 50% died; none of the of tau−/− mice died or experienced these forms of seizures and only 30% reached a Racine score of 3 (Fig 1 B). Both of these groups were compared against animals treated with an equivalent volume of sterile PBS vehicle and vehicle treated animal behavior was used to calibrate the baseline of the Racine scale. Our data support previous findings that tau−/− mice are significantly protected from pharmacologically induced seizure (Ittner et al., 2010; Roberson et al., 2007). Therefore, tau facilitates or is permissive for KA-induced excitotoxic seizures in vivo.
Figure 1. Tau facilitates KA-induced seizures in vivo.
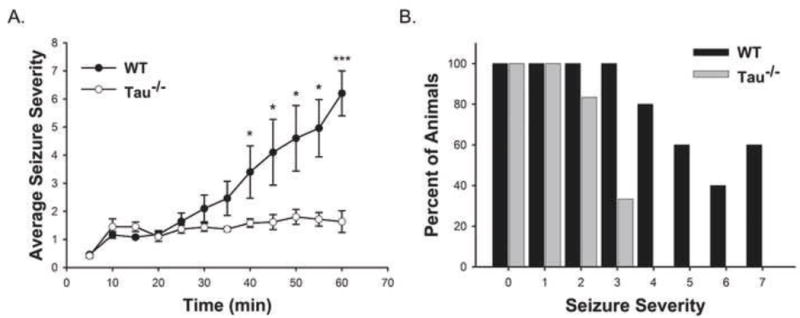
WT (n = 5) and tau−/− (n = 6) mice received 25mg/kg KA (i.p.) prior to 1 hour of video recording of seizure behavior. Seizure severity was determined based on a modified Racine scale. Seizure scores were binned by 5 min for each animal and data are presented as the averages of binned seizure severity scores +/− SEM (A). The graph in (B) represents the percent of WT and tau−/− mice that reached each level of seizure severity over the hour observation period. (** indicates P<0.05; *** indicates P<0.001)
2.2. Tau facilitates ROS production in response to excitotoxic insult in vivo
KA-induced excitotoxicity has previously been shown to increase superoxide production in hippocampi of rats in vivo (Liang et al., 2000; Patel and Li, 2003). Therefore, we investigated whether knocking out tau could ameliorate this effect. For these studies, we followed a previously published paradigm as described in the Methods section (Brennan et al., 2009). Briefly, 5–7 month old male WT and tau−/− mice were injected i.p. with 1mg/kg of the fluorescent superoxide indicator, dihydroethidium (dHE). Thirty minutes later, 25mg/kg KA or equal volumes of sterile PBS vehicle were administered. Seizure behavior was monitored for 1 hour post-KA-injection, after which mice were euthanized via perfusion/fixation and brains were sectioned. Coronal sections encompassing the hippocampus were imaged for dHE fluorescence.
Analysis of dHE fluorescence in fixed hippocampal sections from these mice showed a significant increase in dHE fluorescence in the entire hippocampus of WT animals after one hour treatment with KA compared to their vehicle treated counterparts (Fig 2 A). In contrast, no significant increase in dHE fluorescence was observed in the brain slices from tau−/− mice treated with KA for 1 hour compared to vehicle treated controls (Fig 2 B). Representative images in Fig 2 A and B show only the dentate gyrus (DG). The number of dHE puncta was quantitated from images sampled from the CA1, CA2, CA3, and DG of WT and tau−/− mice with and without 1-hour 25mg/kg KA treatment and data were normalized to the vehicle treated group within each genotype. One hour after 25mg/kg KA treatment, WT mice had significantly greater number of dHE puncta than vehicle treated WT mice, but there was no significant difference in either measure of dHE between vehicle and 1-hour 25mg/kg KA treated tau−/− mice (Fig 2 C). No significant differences were found among CA1, CA2, CA3, and DG within any treatment group, therefore data from the different hippocampal regions were pooled to represent the effect in the entire hippocampus. These data show that the absence of tau also protects mice from KA-induced superoxide production in vivo. Therefore, ablating tau may alleviate oxidative damage caused by excitotoxicity.
Figure 2. Tau facilitates ROS production in response to excitotoxic insult in vivo.
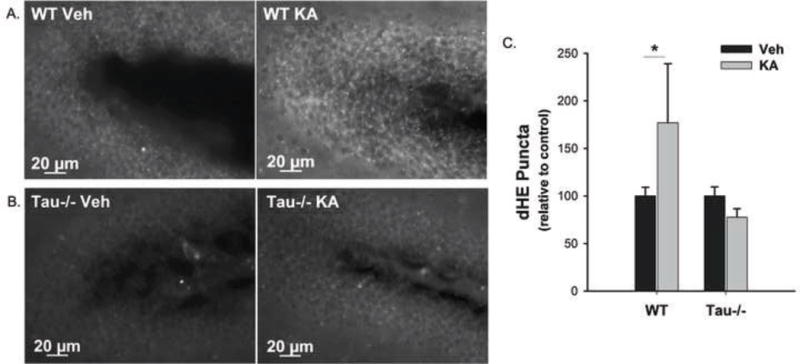
WT and tau−/− mice received 1mg/kg dHE (i.p.) prior to 25mg/kg KA (i.p.). One hour after KA treatment, dHE fluorescence was detected in the hippocampi of the mice as an indicator of KA-induced excitotoxic ROS production. (A) and (B) show representative 40× images of dHE fluorescence in the dentate gyri of WT and tau−/− mice, respectively, injected with vehicle (left) or 25mg/kg KA (right). The number of dHE puncta was quantified from the entire hippocampus (CA1, CA2, CA3, and DG) and data are presented as the percent change from the vehicle treated group for each genotype averaged over all animals +/− SEM (C). (* indicates P<0.05; WT Veh, n = 8; WT KA, n = 10; Tau−/− Veh, n = 6; Tau−/− KA, n = 6).
2.3. Tau does not facilitate KA-induced Ca2+ influx in vitro
To further examine the mechanism by which tau facilitates seizures and ROS production in response to KA excitotoxicity, we moved to an in vitro model. Because excitotoxicity is mediated by an overwhelming influx of Ca2+ into neurons and KA receptors (KARs) have been shown to induce Ca2+cyt increases (Wang et al., 2005), we hypothesized that tau may facilitate KA-induced Ca2+ influx into neurons.
Because we and others have found that complete ablation of tau throughout development causes neuronal abnormalities including aberrant Ca2+ signaling in tau−/− mice and primary cultures derived from these mice (Dawson et al., 2001; Dawson et al., 2010; Pallo and Johnson, 2015), we used a knockdown approach via lentiviruses expressing tau shRNA in rat primary cortical neurons. Rat primary neurons were used in lieu of mouse primary neurons because rat cultures were better able to tolerate the lentiviral and experimental treatments. We achieved 84% and 90% knock down of endogenous tau protein in our rat primary neurons with Tau1-shRNA and Tau2-shRNA, respectively (Fig 3 A).
Figure 3. Tau knockdown does not facilitate KA-induced Ca2+ influx in primary rat cortical neurons.
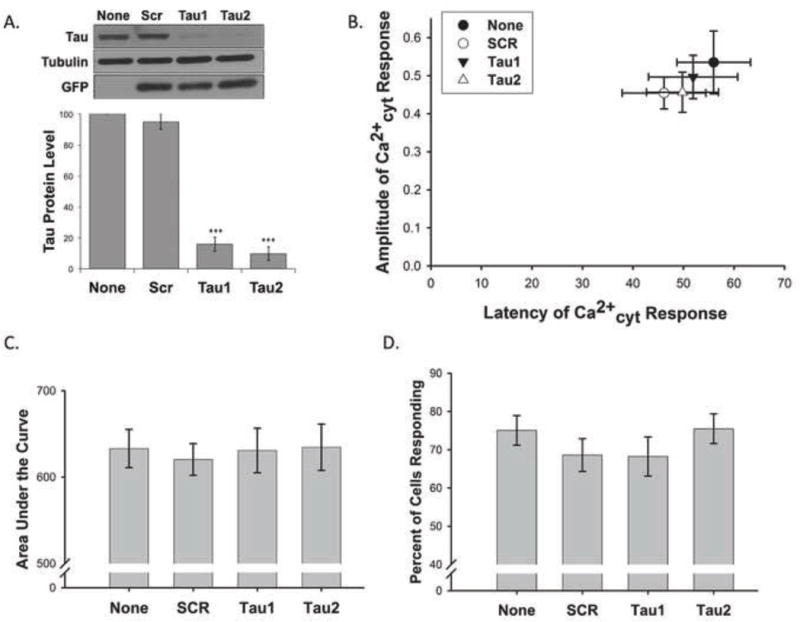
Lentiviral knockdown of tau was optimized in rat primary cortical neurons. Tau protein expression was normalized to a loading control (β-actin or α-tubulin) and is presented as a percentage compared to the no virus (None) control (n = 19, *** indicates P<0.001) (A). Rat primary cortical neurons expressing lentiviral shRNA targeting rat tau (Tau1 and Tau2), an irrelevant scrambled control virus (SCR), or no virus were loaded with Fura2-PE3. The amplitude and latency of the first Ca2+cyt peak after addition of KA were compared to baseline values (0,0) (B). The area under the curve (C) was approximated for the entire interval in which 0.5μM KA was present. The percent of cells per field of view that demonstrated at least a 10% increase in Ca2+cyt fluorescence from baseline in response to 0.5μM KA was calculated (D). Data in B–D are presented as mean +/− SEM from 20 to 32 separate experiments.
We loaded transduced rat primary cortical neurons with 1μM Fura2-PE3, the ratiometric fluorescent Ca2+cyt indicator, to assess Ca2+cyt changes induced by 0.5μM KA. Neurons were treated with 0.5μM KA after establishing a stable baseline measure of Fura2-PE3 fluorescence during which neurons were continually perfused with MEH imaging buffer. KA-induced Ca2+cyt fluxes were assessed for approximately 9 minutes before the membrane ionophore, ionomycin (1μM), was added as a positive control. 340nm/380nm ratio masks were produced from each Fura2-PE3 imaging trace and each was normalized to its baseline. Several specific metrics were quantitated from the portion of the normalized Ca2+cyt trace where KA was present. The amplitude of the first spike after KA treatment was measured in comparison to baseline to establish the immediate Ca2+cyt load. The percent of cells that responded to KA per field of view was also calculated. A “responding cell” was defined as a cell in which the normalized Ca2+cyt level increased by at least 10% from baseline in response to KA. Taken together, data about amplitude and the percent of cells that responded to KA per field of view could indicate the relative abundance or surface availability of KARs. The latency to the first Ca2+ spike induced by KA was measured to elucidate the kinetics of the Ca2+cyt influx. The area under the curve measured the relative Ca2+cyt load over the entire time KA was present. Area under the curve in conjunction with amplitude and latency data could give an impression of whether a Ca2+ response was sustained or transient. Contrary to our hypothesis, we found no statistical differences in any of these measures between rat primary neurons treated with lentiviral tau-shRNA or the scrambled virus or no virus controls (Fig 3 B–D) suggesting that tau knockdown is not sufficient to ameliorate KA-induced Ca2+cyt load.
2.4. Aβ42 biphasically modulates KA-induced Ca2+cyt fluxes in vitro
As mentioned above, tau and Aβ have been shown to act in concert to elicit neuronal damage (Eckert et al., 2010; Quintanilla et al., 2012; Rhein et al., 2009) and tau has been implicated in facilitating Aβ-induced hyperexcitability in mice (Palop et al., 2007; Roberson et al., 2007; Roberson et al., 2011). Therefore, we next investigated if tau requires the concerted activity of Aβ in order to facilitate KA-induced Ca2+ influx. To determine if tau cooperates with Aβ to exacerbate KA-induced Ca2+ influx, we transduced rat primary cortical neurons with tau knock down lentiviruses, then treated with 0.5μM Aβ42 chronically (for 24 hours prior to Ca2+cyt time-lapse imaging) or acutely (for 10 minutes during imaging, prior to treatment with 0.5μM KA).
Before carrying out the Ca2+cyt studies, we investigated the toxicity of Aβ42 in rat primary cortical neurons. Neurons were treated with a range of Aβ42 concentrations (0.5μM – 10μM) for 48 hours prior to cell viability analysis using Calcein AM. These studies confirmed that the low concentrations of Aβ42 used throughout our Ca2+cyt imaging studies did not cause significant neuronal death (Fig 4 A).
Figure 4. Aβ42 has a biphasic effect on KA-induced Ca2+ influx in primary rat cortical neuron cultures.
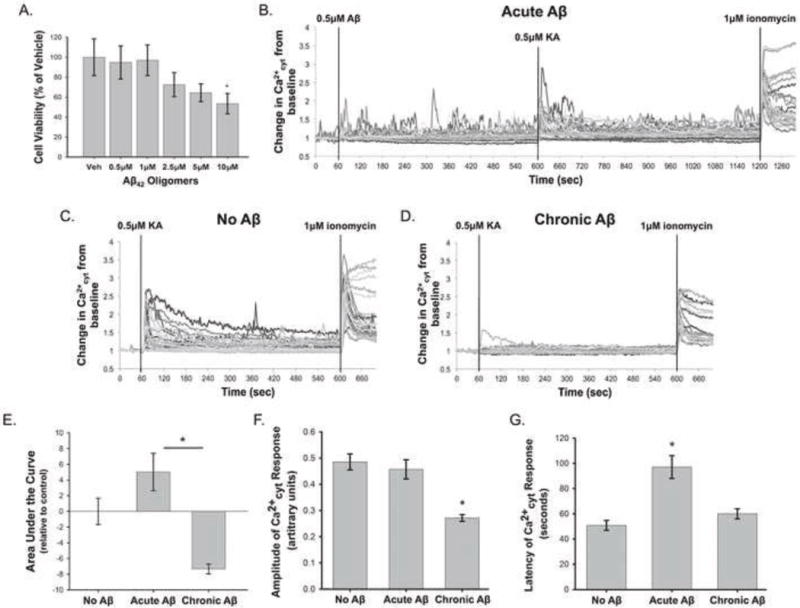
Cell viability assays were performed on rat primary cortical neurons using Calcein AM to investigate the toxicity of Aβ42 oligomers at a range of concentrations (0.5μM, 1μM, 2.5μM, 5μM, and 10μM) after a 48 hour treatment (A). Viability data are normalized to the vehicle treated control and are presented as mean +/− SEM (n = 4, * indicates P<0.05). Rat primary cortical neurons were loaded with Fura2-PE3 and were treated with “Acute Aβ” (0.5μM Aβ42 for 10 minutes) (B), “No Aβ” (C), or “Chronic Aβ” (0.5μM Aβ42 for 24 hours) (D) prior to 0.5μM KA treatment. (B–D) show representative Ca2+cyt traces from individual experiments in each condition. Chronic Aβ42 decreased the average area under the KA-treatment portion of the Ca2+cyt curve, while Acute Aβ42 had the opposite effect (E). Chronic Aβ42 treatment also significantly reduced the amplitude of KA-induced Ca2+ influx (F). Acute Aβ42 increased the latency of the Ca2+cyt response from control (G). Data in (D–F) are presented as mean +/− SEM from 12 to 32 separate experiments (* indicates P<0.05).
In the Ca2+cyt imaging studies that incorporated tau knockdown in conjunction with “Chronic” or “Acute” 0.5μM Aβ42 treatment, tau knockdown still did not have a significant effect on KA-induced Ca2+ influx (data not shown). Statistical analysis also showed no significant interaction between the tau knockdown and Aβ treatment variables on KA-induced Ca2+ influx, suggesting tau and Aβ do not cooperate to modulate KAR activity.
On the other hand, Aβ42 treatment had several significant effects on KA-induced Ca2+ influx independent of tau knockdown, which are shown in representative Ca2+cyt traces from “No Aβ”, “Acute Aβ”, and “Chronic Aβ”–treated rat primary cortical neurons (Fig 4 B–D). Significant differences were found in the area under the curve of the Ca2+cyt traces between the “Acute” and “Chronic” Aβ42 conditions. Chronically treated neurons had an average area under the curve that was reduced from the “No Aβ” condition, while acutely treated neurons exhibited increased area under the curve compared to “No Aβ” (Fig 4 E). “Chronic” 0.5μM Aβ42 pretreatment also caused a significant decrease in the amplitude of the KA-induced Ca2+cyt influx (Fig 4 F) and “Acute” treatment significantly increased the latency of the KA-induced Ca2+cyt response (Fig 4 G). Taken together, these data suggest that Aβ42 modulates KA-induced Ca2+cyt increases in a biphasic manner. Increased latency and area under the curve of the Ca2+cyt response observed with “Acute” Aβ42 suggests that short-term presence of Aβ42 may enhance and/or sustain KA activation. On the other hand, decreased amplitude and area under the curve of the Ca2+cyt response observed with “Chronic” Aβ42 may indicate decreased activation or surface expression of KARs in response to prolonged Aβ42 exposure.
2.5. Group 1 mGluR inhibition does not rescue Aβ42-induced modulation of KAR
Aβ has been shown to activate mGluR5 (a group 1 mGluR), and affect downstream activity of an ionotropic glutamate receptor (Um et al., 2012; Um et al., 2013). Other studies have implicated group 1 mGluRs (mGluR1 and 5) and downstream activation of PKC via a canonical G-protein coupled receptor (GPCR) pathway in modulation of KAR activity and surface expression (Cho et al., 2003; Nasu-Nishimura et al., 2010; Rojas et al., 2013). In fact, one study showed that PKC regulates KAR activity bi-directionally (Chamberlain et al., 2012). Therefore, we investigated whether Aβ42 was activating group 1 mGluRs and their canonical GPCR pathway to cause the biphasic modulation of KAR activity we had observed. Group 1 mGluRs were inhibited prior to Aβ42 administration and the KA-induced Ca2+cyt responses were analyzed. For the chronic paradigm, rat primary cortical neurons were incubated with a mixture of 10μM Bay36-7620 and 10μM MPEP (Bay/MPEP), which are non-competitive inhibitors at mGluR1 and mGluR5, respectively. Bay/MPEP were present for one hour prior to, and during, 24-hour treatment with 0.5μM Aβ42. For the acute paradigm, neurons were incubated with 10μM Bay/MPEP in culture media for one hour, followed by Fura2-PE3 loading and imaging. In both cases, 10μM Bay/MPEP was present throughout all rinses, dye loading, and perfusion during imaging (Fig 5 A).
Figure 5. Group 1 mGluR inhibition does not reverse the effect of Aβ42 on KA-induced Ca2+ entry.
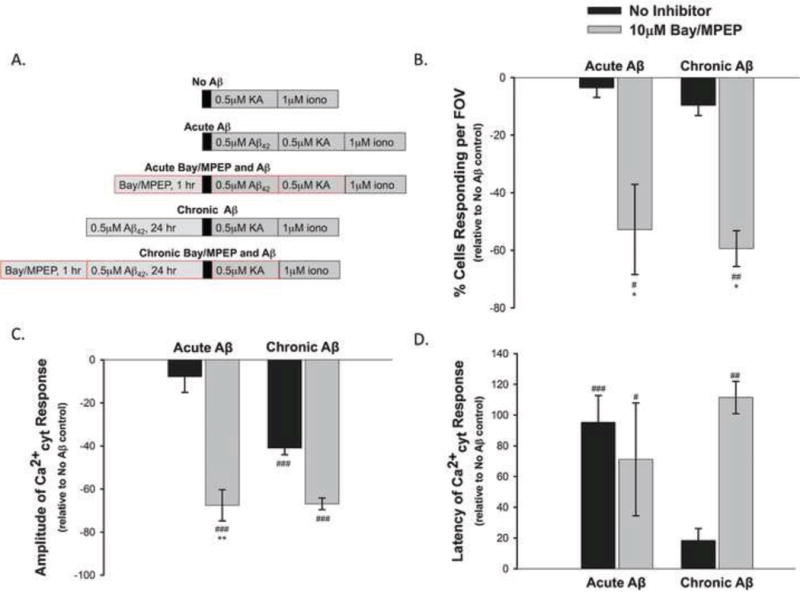
Rat primary cortical neurons were treated with 10μM Bay36-7620 and 10μM MPEP for 1 hour prior to, and throughout, “Chronic” (24 hour) or “Acute” (10 minute) 0.5μM Aβ42 treatment, Fura2-PE3 loading, and imaging (A). Chronic and acute 10μM Bay/MPEP treatment significantly reduced the percent of cells responding per field of view (B) and amplitude (C), while increasing the latency of the KA-induced Ca2+cyt response compared to neurons treated with only 0.5μM KA (D). Data presented as mean percent change from “No Aβ”+/ − SEM from 5 to 99 separate experiments. (# = P<0.05, ## = P<0.01, ### = P<0.001 compared to “No Aβ/KA”; * = P<0.05, ** = P< 0.01, compared to “No Inhibitor” condition within the given treatment paradigm).
We expected inhibition of group 1 mGluRs to block the effect of Aβ42 on the KA-induced Ca2+cyt fluxes. Therefore we expressed all measures as a percent change from the data collected from the “No Aβ” treated neurons. Hence, the zero baseline in all graphs in Fig 5 B–D represents “No Aβ” data. Based on our hypothesis, we expected the 10μM Bay/MPEP treated neurons to yield Ca2+cyt responses similar to those of the “No Aβ”, which would be represented as near zero values on the graphs. Instead, Ca2+cyt responses in neurons pretreated with 10μM Bay/MPEP almost always deviated further from the “No Aβ” baseline than neurons not treated with Bay/MPEP. Overall, 10μM Bay/MPEP tended to dampen the KA-induced Ca2+cyt responses. Both chronic and acute inhibition of group 1 mGluRs significantly decreased the percent of cells that responded to KA per field of view (Fig 5 B) and the amplitude of the Ca2+cyt response (Fig 5 C), while significantly increasing the response latency (Fig 5 D) compared to neurons treated with KA only (“No Aβ”). Group 1 mGluR inhibition failed to ameliorate the effects of chronic or acute Aβ42. This suggests Aβ42 does not modulate KAR via a mechanism involving activation of group 1 mGluRs. The overall dampening effect we observed when neurons were pretreated with 10μM Bay/MPEP was most likely due to inhibition of constitutive activity of group 1 mGluRs as both Bay36-7620 (Carroll et al., 2001) and MPEP (Pagano et al., 2000) have been reported to act as inverse agonists at mGluR1 and 5, respectively (Ango et al., 2001).
2.6. Aβ42 can elicit Ca2+ release from internal stores independent of group 1 mGluR activation
Since inhibition of group 1 mGluRs failed to block Aβ42 modulation of KA-induced Ca2+cyt fluxes, we further investigated whether Aβ42 could activate the group 1 mGluR GPCR pathway. To this end, we performed Ca2+cyt imaging in the absence of external Ca2+ and monitored Ca2+ release from internal stores using Fura2-PE3. We incubated a subset of rat primary cortical neurons with 10μM Bay/MPEP (group 1 mGluR antagonists) for one hour in neurobasal media prior to Ca2+cyt imaging. All rinses, dye loading, and initiation of the imaging protocol were carried out in MEH buffer containing Ca2+. External Ca2+ was then washed out prior to treatment with Aβ42 (0.5μM, 2.5μM, or 5μM) or 10μM DHPG (group 1 mGluR agonist). DHPG was used as a positive control for group 1 mGluR activation. CPA (20μM), which blocks Ca2+ uptake into the endoplasmic reticulum, was also added in the absence of external Ca2+ at the end of each imaging experiment as an internal imaging control as a comparison for Ca2+ release from internal stores. (Fig 6 A).
Figure 6. Aβ42 can elicit release of Ca2+ from internal stores independent of group 1 mGluR activation.
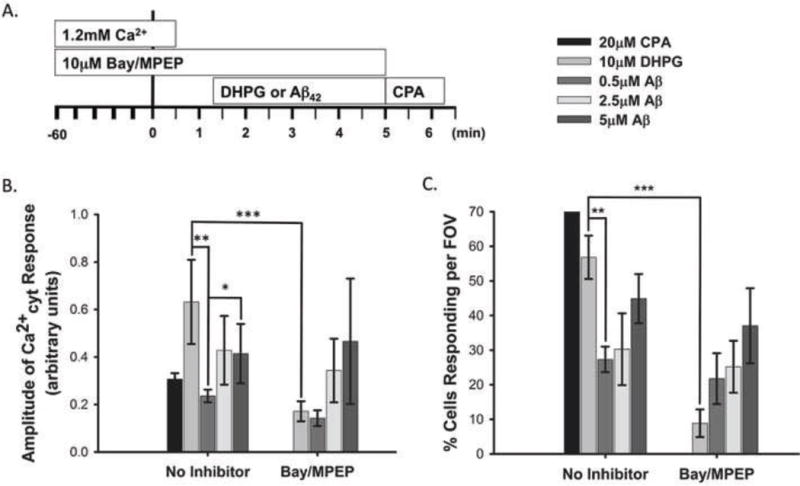
A subset of rat primary cortical neurons were treated with 10μM Bay36-7620 and 10μM MPEP for 1 hour prior to imaging. Neurons were loaded with Fura2-PE3 and imaging began in the presence of 1.2mM external Ca2+. External Ca2+ was washed out 1 minute prior to treatment with 10μM DHPG or Aβ42 (0.5μM, 2.5μM, or 5μM) (A). Graphs show the amplitude of Ca2+ release from internal stores elicited by Aβ42 (0.5μM, 2.5μM and 5μM) or 10μM DHPG (B) and the percentage of the neuron population that responded to these treatments (C). Data are presented as mean +/− SEM from 5 to 41 separate experiments (* indicates P<0.05, ** indicates P< 0.01, *** indicates P< 0.001).
In the absence of extracellular Ca2+, 10μM DHPG elicited Ca2+cyt responses of similar amplitude (Fig 6 B) and latency (data not shown) as we had previously observed in neurons treated with KA (Fig 3 B, None; Fig 4 F, No Aβ) indicating that 10μM DHPG effectively activated the group1 mGluR GPCR pathway causing a large release of Ca2+ from internal stores. In comparison, 0.5μM Aβ42 caused release of internal Ca2+ stores of significantly lower amplitude and in a significantly smaller portion of the neuron population than that elicited by 10μM DHPG treated neurons (Fig 6 B, C). On the other hand, higher concentrations of Aβ42 (2.5μM and 5μM) induced internal Ca2+ store release that did not differ significantly from that of 10μM DHPG in amplitude or the percent of cells that responded (Fig 6 B, C). This suggests that 2.5μM and 5μM Aβ42 can elicit internal Ca2+ store release similar to that of a group 1 mGluR agonist, but 0.5μM Aβ42 does not. In addition, 10μM Bay/MPEP nearly ablated 10μM DHPG induced internal Ca2+ store release amplitude (Fig 6 B) and the percent of neurons that responded (Fig 6 C), but had no affect on internal Ca2+ store release induced by any concentration of Aβ42. This suggests that Aβ42 is capable of releasing Ca2+ from internal stores, but it does so independent of group 1 mGluR activation.
3. Discussion
Excitotoxicity is likely an important factor in AD progression that manifests as abnormal epileptiform activity or seizures in a subset of the AD patient population (Amatniek et al., 2006; Hauser et al., 1986; Hesdorffer et al., 1996; Romanelli et al., 1990; Vossel et al., 2013). It has previously been shown that both tau and Aβ, the main components of the two neuropathological hallmarks of AD, contribute to excitotoxicity in animal and cellular models. The present study confirmed some of these previous findings and investigated a hypothesized mechanism underlying Aβ mediated excitotoxicity.
As discussed above, reducing tau expression protects mice carrying AD-related mutations that increase Aβ pathology from pharmacologically induced seizures, spontaneous non-convulsive epileptiform activity, and early mortality (Palop et al., 2007; Roberson et al., 2007). These and other studies also showed that reduction of tau expression in the absence of other genetic modifications is protective in mouse and Drosophila melanogaster seizure models (DeVos et al., 2013; Holth et al., 2013). Several of these studies induced seizures with KA, which has been shown to induce oxidative stress and hippocampal superoxide production in the brains of mice and rats (Liang et al., 2000; Patel and Li, 2003). Our results showed that tau−/− mice treated with 25mg/kg KA had significantly less severe seizures than WT mice treated with the same dose, which supports earlier findings. We also showed that tau−/− mice were significantly protected from KA-induced hippocampal superoxide production in comparison to WT mice, as predicted. These results suggest that tau facilitates KA-induced seizures and subsequent ROS production in vivo.
Because excitotoxicity underlies seizure production and a main mechanistic component of excitotoxicity is Ca2+cyt overload, we hypothesized that reducing tau expression would attenuate KA-induced Ca2+ influx. However, lentiviral reduction of endogenous tau protein in rat primary cortical neurons had no effect on any measure of KA-induced Ca2+cyt response. It may be that tau knock down is not sufficient (as compared to tau−/−) to ameliorate KA-induced Ca2+cyt load, but this is unlikely as we achieved 84% – 90% knockdown of endogenous tau in our model. In a previous study from our lab, we found that primary cortical neurons from tau−/− mice displayed significantly enhanced Ca2+ responses to treatment with an Aβ42 oligomer/fibril mixture (Pallo and Johnson, 2015). We attributed this unexpected result to developmental abnormalities previously observed in tau−/− mouse neurons related to retardation of neurite outgrowth (Dawson et al., 2001), which is governed by large, frequent L-type Ca2+ channel transients (Tang et al., 2003). We hypothesized that neurons from tau−/− mice would likely exhibit larger Ca2+ transients than their WT counterparts coinciding with slowed neurite outgrowth and expected that tau reduction or transient ablation would not have these effects. However, another study suggests that impaired microtubule homeostasis due to mutations in tau protein may be a primary contributor to the Ca2+ dyshomeostasis in these models (Furukawa et al., 2003). Therefore, it is possible that acute reduction of tau expression may also impair microtubule stabilization leading to Ca2+ dyshomeostasis in neurons. This may mask any possible inhibitory effect tau reduction may have on KAR induced Ca2+ influx.
Because tau and Aβ have been shown to act in concert to elicit downstream neuronal damage (Small and Duff, 2008) and tau appears to facilitate hyperexcitability in Aβ-forming transgenic mice (Palop et al., 2007; Roberson et al., 2007; Roberson et al., 2011), we next tested whether the addition of Aβ was required in order for tau to facilitate KA-induced Ca2+ influx. In this paradigm, tau still had no effect on KA-induced Ca2+ influx. However, an interesting effect of Aβ42 pretreatment emerged. When Aβ42 was added to neurons acutely, it enhanced or prolonged the Ca2+cyt response induced by KA. On the other hand, chronic pretreatment with Aβ42 significantly dampened the KA-induced Ca2+ influx. This biphasic effect suggests that Aβ42 could facilitate over-activation of KARs acutely, but may eventually facilitate KAR endocytosis, which is a hypothesis we need to further explore.
It is well accepted that KAR surface expression and activation is likely regulated by activation of group 1 mGluRs and PKC. For instance, several studies have shown that activation of PKC and mGluR1 and/or mGluR5 potentiated the activation of KARs and KAR mediated Ca2+ influx in rat primary cortical neurons (Cho et al., 2003; Rojas et al., 2013). They provided further evidence that G-protein activation, PLC production, and Ca2+cyt increase led to PKC phosphorylation of a KAR subunit and potentiation of KAR currents (Rojas et al., 2013). On the other hand, PKC phosphorylation of a different subunit of KAR leads to its internalization in HeLa cells and WT mouse primary hippocampal neurons (Nasu-Nishimura et al., 2010). Yet another study suggests that PKC can modulate KAR activity and surface expression bi-directionally depending on subsequent post-translational modifications. In that study, PKC phosphorylation of KAR led to potentiation of its activity in HEK cells and rat hippocampal slices. However, PKC phosphorylation also promoted subsequent sumoylation at a nearby residue on KAR, which led to internalization of KARs and attenuation of their activity (Chamberlain et al., 2012). This suggests that group 1 mGluRs and PKC may regulate KAR activity bidirectionally.
Recently, a link has been established between Aβ42 oligomers and group 1 mGluRs. Aβ42 oligomers form a complex with PrPc and this complex has been successfully purified from postmortem AD brain tissue suggesting it is a pathologically relevant phenomenon (Um et al., 2012). A study recently found that the Aβ42 oligomer/PrPc complex mobilizes intracellular Ca2+ stores by directly activating mGluR5 in Xenopus laevis oocytes. Soluble Aβ42 oligomers from AD patient brain also induced Ca2+ release from the ER that was blocked by direct inhibition of mGluR5 or by blocking Aβ-PrPc binding (Um et al., 2013).
Because we observed that Aβ42 can biphasically modulate KA-induced Ca2+ influx, we hypothesized that Aβ42 activates group 1 mGluRs, leading to PKC activation, which could mediate potentiation of KAR activation acutely, or endocytosis of KAR chronically. Treating neurons with 10μM Bay36-7620 and 10μM MPEP to block mGluR1 and mGluR5, respectively, did not rescue KA-induced Ca2+cyt responses from the effect of Aβ42 pretreatment. Instead, the group 1 mGluR antagonists had an overall dampening effect on Ca2+ influx elicited by KA on both an acute and chronic time scale, but was not significant. Both Bay36-7620 and MPEP have been shown to have inverse agonist activity, suggesting these inhibitors block constitutive activity of group 1 mGluRs as well as agonist activation (Ango et al., 2001; Carroll et al., 2001; Pagano et al., 2000) Therefore, it appears that Aβ42 is not acting through group 1 mGluRs to modulate KAR activity and at least a portion of the Ca2+cyt responses we observed could be attributed to constitutive activity of group 1 mGluRs – independent of Aβ.
Group 1 mGluRs are coupled to GDαq/11 protein, which activates PLC, cleaves phosphatidylinositol 4,5-bisphosphate (PIP2) to diacylglycerol (DAG) and inositol triphosphate (IP3), which causes release of Ca2+ stores from the ER (Wong et al., 2005). We carried out studies to test whether Aβ42 could elicit release of internal Ca2+ stores that could be blocked by group 1 mGluR inhibition. Our results show that Aβ42 is able to elicit release of internal Ca2+ stores, but is unaffected by inhibition of group 1 mGluRs. In addition, the concentration of Aβ42 we used in our previous studies (0.5μM) was not as effective at releasing internal Ca2+ stores as higher concentrations (2.5μM and 5μM). These results suggest that Aβ42 did not activate group 1 mGluRs in our paradigm and further supports the conclusion that the biphasic effect of Aβ42 on KA-induced Ca2+cyt is not mediated by mGluR1 or mGluR5 activation.
4. Conclusion
Our results support previous findings that tau facilitates KA induced seizures and further suggests tau facilitates KA-induced ROS production in mouse hippocampus in vivo. However, we did not find evidence to support the hypothesis that tau achieves this by facilitating KAR Ca2+ influx on its own or by cooperating with Aβ42. Therefore, tau facilitates KA-induced seizures and ROS production via a mechanism that does not involve direct facilitation of KAR Ca2+ influx. On the other hand, pretreatment with Aβ42 biphasically modulated the KA-induced Ca2+ influx. Acute Aβ42 pretreatment enhanced or prolonged the KA-induced Ca2+cyt signal, while chronic Aβ42 significantly reduced it. We hypothesized that this effect may be mediated by activation of group 1 mGluRs, but found that Aβ42 was not able to activate these receptors. Therefore, the biphasic effect of Aβ42 on KA-induced Ca2+cyt is not mediated by mGluR1 or mGluR5 activation.
6. Experimental Procedures
6.1. Animals
This study was carried out in accordance with guidelines of the University of Rochester Committee on Animal Resources with approval from the Institutional Animal Care and Use Committee (protocol # APP-2007-023-100413).
WT, C57BL/6 (000664) and tau−/− (B6.129X1-Mapttm1Hnd/J, 007251) mice used in this study were obtained from Jackson Laboratories. Tau−/− mice were originally made and characterized by Dawson et al. (Dawson et al., 2001). These mice carry a homozygous deletion of the Mapt gene and have been backcrossed at least ten times onto a C57BL/6 background.
Sprague Dawley timed pregnant rats used for rat primary neurons cultures were obtained from Charles River Laboratories.
6.2. KA Seizure Behavioral Assessment
KA (0222, Tocris, Bristol, UK) was reconstituted in DMSO to 20mg/mL with agitation and gentle heating and was further diluted to a working concentration of 4mg/mL in sterile PBS. Five to seven month old male C57BL/6 and tau−/− mice were administered 25mg/kg KA or equal volumes of sterile PBS vehicle via i.p. injection and seizure behavior was monitored via video recording for 1 hour at which point mice were euthanized. Video recordings were analyzed for seizure behavior by a blinded third party using a modified Racine scale (Racine, 1972) as follows: 1 = decreased mobility; 2 = immobility, rigid posture; forelimb and tail extension; 3 = repetitive forelimb movements and head nodding; 4 = forelimb clonus with rearing and falling (limbic motor seizure); 5 = continuous rearing and falling; 6 = severe, whole body convulsion (tonic-clonic seizure); 7 = death. Scores were assigned for 30-second blocks. In order for a score to be assigned, it had to be observed for at least 15 seconds of a given block. Data were then binned by 5 minutes and are presented as mean +/− standard error of the mean (SEM).
6.3. In vivo Superoxide Detection
The methods for superoxide detection were adapted from Brennan et. al., (Brennan et al., 2009). Briefly, stock solutions of dHE (D-1168, Life Technologies, NY, USA) were diluted to 1mg/mL in 1% DMSO and 1mg/kg was administered to 5–7 month old male WT and tau−/− mice via i.p. injection. Thirty minutes later, mice received 25mg/kg KA or equal volumes of sterile PBS vehicle (i.p.) as described above. Seizure behavior was monitored for 1 hour post-KA-injection, after which mice were anesthetized with 2% isoflurane and transcardially perfused with PBS, followed by 4% paraformaldehyde (PFA). Brains were then removed and incubated in 4% PFA overnight at 4°C, followed by 30% sucrose dehydration at 4°C with agitation until brains sank (up to 36 hours). Brains were flash frozen in isopentane on dry ice and 30μm coronal sections were cut using a freezing stage microtome. Sections encompassing the hippocampus were imaged with a 40x oil immersion objective on a Zeiss Axio Observer D1 inverted fluorescent microscope with excitation 530nm and emission 620nm. Because dHE intercalates into DNA, a fluorescent threshold was set to more easily quantitate the number and area of fluorescent puncta per field of view using ImagePro software. The data shown are normalized to the vehicle treated group within each genotype.
6.4. Rat Primary Cortical Neuron Culture
Rat primary cortical neurons were isolated from embryonic day 18 (E18) Sprague Dawley rats. Pregnant dams were euthanized with CO2 followed by decapitation and embryos were extracted immediately. Cortices were aseptically dissected from embryos and were chemically dissociated in 0.05% trypsin at 37°C for 25 minutes followed by mechanical dissociation via trituration with fire polished Pasteur pipettes. Neurons were then plated at a density of 4×10⁵ cells/mL in MEM containing 5% FBS, 20mM glucose, 2mM L-glutamine, 10mM HEPES, and 0.5% penicillin/streptomycin on plates previously coated overnight with 40μg/mL poly-D-lysine and dried. Five hours after plating, MEM was replaced with Neurobasal media containing 400μM L-glutamine and 1x B27. Every 4 days, the neurons received a half volume media change. Neurons were imaged on day in vitro (DIV) 8–11.
6.5. Lentiviral Infection
Lentiviruses were produced as previously published (Tiscornia et al., 2006). Briefly, oligonucleotides were designed containing shRNA sequences targeting rat tau protein (Tau1 shRNA: 5′-gatccccGTGTCCGCCTCTTTGGCCAttcaagagaTGGCCAAAGAGGCGGACACtttttggaaa-3′ (Leugers and Lee, 2010) and Tau2 shRNA: 5′-gtcaggatccccAGGATAGAGTCCAGTCGAAttcaagagaTTCGACTGGACTCTATCCTtttttctcgaggtca-3′ (Jin et al., 2011)). Oligonucleotides were annealed and ligated into BglII and XhoI sites of pSuper-neo+GFP down stream of H1 promoter and their expression was verified. The H1 promoter and silencing cassette were then amplified out of pSuper-neo+GFP and ligated into FG12 lentiviral vector upstream of a ubiquitin promoter driving GFP expression. Viral particles were produced by transfecting HEK293-TN cells with either Tau1 shRNA, Tau2 shRNA, or an irrelevant scrambled control RNA vector with VSVg and pPAX2 viral packaging plasmids (Addgene, MA, USA). Rat primary cortical neurons were transduced with viruses on DIV4 and optimal expression was reached by DIV8 – 10.
6.6. Aβ oligomer preparation
Synthetic human Aβ42 was synthesized and disaggregated in trifluoroacetic acid (TFA) and hexafluoro-2-propanol (HFIP) in house as previously reported (Doran et al., 2012) or was obtained from Calbiochem (PP69, NJ, USA), or American Peptide (62-0-80A, CA, USA). After synthesis and disaggregation, Aβ42 lyophilized powder obtained in house was dissolved in sterile 2mM NaOH MEH buffer (135mM NaCl, 5.4mM KCl, 0.33mM NaH2PO4, 0.4mM KH2PO4, 20mM HEPES, 0.8mM MgCl2, 1.2mM CaCl2, 10mM glucose, pH 7.4) to 1mg/mL and was stored at −80°C. Working solutions were further diluted in sterile MEH to 75μM and were incubated at 4°C overnight without agitation to allow oligomerization.
Aβ42 obtained commercially was disaggregated in HFIP at a concentration of 1mM, aliquoted to 10μL, and were either stored at −80°C until needed or were dried in a sterile culture hood for 2 hours and reconstituted to 75μM in sterile MEH and oligomerized at 4°C overnight without agitation. Oligomers were stored at −20°C and were used within one week.
All three sources of Aβ42 were tested in Ca2+cyt experiments as preparation of the peptides was not appreciably different. No significant differences were found between the three Aβ42 sources (data not shown).
6.7. Cell Viability Assay
Rat primary cortical neurons were treated with 0.5μM, 1μM, 2.5μM, 5μM, and 10μM Aβ42 oligomers or sterile PBS vehicle for 48 hours prior to addition of 2μM Calcein AM (Life Technologies, NY, USA, #C1430). Neurons were incubated in the presence of Calcein AM for 30 minutes and fluorescence was read at 485nm/528nm excitation/emission with a BioTek Synergy HT Multidetection Microplate Reader using Gen5 data analysis software. Data were analyzed by subtracting background fluorescence and normalizing all treatment groups to the vehicle treated control.
6.8. Ca2+cyt Fluorescent Imaging
Rat primary cortical neurons were plated on 12mm #1 thickness coverslips and were loaded with the ratiometric Ca2+cyt dye, Fura-2-PE3 (1μM, 0109, TEFLabs, TX, USA) and 0.5% pluronic F-127 (59004, Biotium, CA, USA) in MEH imaging buffer for 20 minutes at 37°C. Neuron coverslips were then rinsed once with MEH and dye was equilibrated for an additional 20 minutes before being placed in a perfusion chamber on a Nikon Eclipse TE2000-S inverted microscope with a 20× Nikon Plan Fluor oil immersion objective. Coverslips were illuminated with a Polychrome IV monochromator (TILL Photonics) using a filter cube to excite coverslips at 340nm and 380nm. Images were captured every 2 seconds for 10 to 20 minutes with a high-speed charge-coupled device camera (Imago) at emission wavelength of 505nm using TILLvisION software.
TILLvisION was also used to analyze data. First, a 340nm/380nm ratio sequence was produced for each experiment with background fluorescence subtracted. Regions of interest were selected within all cell bodies in the ratio sequence. Calcium fluorescence values were then calculated from the regions of interest at each time point. Raw fluorescence values were subsequently normalized to baseline fluorescence within each region of interest producing “Change in Ca2+cyt from baseline” traces (examples in Fig 4 B–D). The “Percent of Cells Responding per FOV” was calculated by tallying the number of cells in each experiment that experienced at least a 10% increase in Ca2+cyt in response to the experimental treatment (i.e. 0.5μM KA). “Latency” was calculated by subtracting the time at which a treatment was added from the time at which Ca2+cyt increased 10% from baseline. The amplitude of the Ca2+ trace was calculated by subtracting the value at baseline from the value of the first peak in the trace after the experimental treatment. The “Area Under the Curve” was calculated for the entire interval in which a given treatment was present using the Reimann sums approximation.
6.8.1. KA-induced Ca2+ influx
KA (EA-123, Enzo Life Sciences, NY, USA) was diluted to 5mM in MEH containing 10μM NaOH and stored at −20°C for up to one month. Neurons were perfused with room temperature MEH buffer, for several minutes prior to initiation of the TILLvisION imaging protocol. Perfusion flow was stopped after 40 seconds of image capture and the first experimental treatment was added at 60 seconds in all experiments. All experimental treatments were added drop wise in 500μL volumes to the perfusion chamber. In the “No Aβ” set of experiments, 0.5μM KA was added one minute after protocol initiation to elicit an excitotoxic response. Ten minutes after protocol initiation 1μM ionomycin, a plasma membrane ionophore, was added to cause maximal Ca2+ influx and serve as a positive control. The “Chronic Aβ” group followed the same protocol, but was treated with 0.5μM Aβ42 for 24 hours prior to imaging. A third experimental group, “Acute Aβ”, was treated with 0.5μM Aβ42 one minute after protocol initiation, followed by 0.5μM KA ten minutes after initiation, and 1μM ionomycin twenty minutes after initiation. The “Chronic Aβ” and “Acute Aβ” groups were further split into two groups: “No inhibitor” and “Bay/MPEP”. “Bay/MPEP” groups were incubated with 10μM Bay36-7620 and 10μM MPEP, non-competitive antagonists with inverse agonist activity at mGluR1 and mGluR5, respectively. “Bay/MPEP” was added to the neurobasal media 1–1.5 hours prior to imaging for the Acute Aβ paradigm or prior to the 24hr Aβ42 treatment for the Chronic Aβ paradigm. For the “Bay/MPEP” experiments, all buffers used for dye loading, rinsing, perfusion, and experimental treatments during imaging also contained 10μM Bay/MPEP.
6.8.2. Release of Internal Ca2+ Stores
DHPG ((S)-3,5-Dihydroxyphenylglycine, #0805, agonist at both mGluR1 and mGluR5), Bay36-7620 ((3aS,6aS)-Hexahydro-5-methylene-6a-(2-naphthalenylmethyl)-1H-cyclopenta(c)furan-1-one, #2501, mGluR1 antagonist), and MPEP (2-Methyl-6-(phenylethynyl)pyridine hydrochloride, #1212, mGluR5 antagonist) were purchased from Tocris Bioscience (Bristol, UK). CPA (cyclopiazonic acid, BML-CA415- 0010, sarcoplasmic reticulum Ca2+-ATPase inhibitor) was purchased from Enzo Life Sciences (NY, USA). Bay36-7620 and MPEP were reconstituted to 100mM with DMSO, and DHPG was reconstituted to 50mM with DMSO. All stock solutions were stored at −20°C for no more than one month as per suppliers’ recommendations. Stocks were diluted to working concentrations with sterile MEH immediately prior to their use in experiments.
Coverslips were loaded with 1μM Fura2-PE3 and washed with MEH buffer containing 1.2mM CaCl2 as described above. Coverslips were perfused with MEH containing CaCl2 prior to, and until cycle 15 in the imaging protocol (t = 0:30), perfusion of Ca2+ free MEH began and continued until flow was turned off at cycle 80 (t = 2:40). At cycle 100 (t = 3:20), 500μL of 10μM DHPG, or Aβ42 (0.5μM, 2.5μM, or 5μM) was added. Finally, 500μL of 1μM CPA was added at cycle 300 (t = 10:00) as a positive control. For experiments in which mGluR1 and mGluR5 inhibitors were used, 10μM Bay/MPEP was added to neurons in the neurobasal media 1–1.5 hours prior to imaging. All MEH buffers (containing 1.2mM CaCl2 or Ca2+ free) used for dye loading, rinsing, perfusion, and experimental treatments during imaging also contained 10μM Bay/MPEP.
6.9. Statistical Analysis
All statistical analyses (with the exception of the General Estimating Equation (GEE)) were performed using SigmaPlot and InSTAT statistical packages and data are presented as mean +/− SEM.
Statistical analysis of mouse seizure studies included GEE analysis (performed by biostatistician, Changyong Feng, Ph.D.), to compare the slope of the average seizure severity over time between WT and tau−/− mice. Individual t-tests were also performed at each time point to elucidate the time at which WT and tau−/− behavior became significantly different.
Measures of KA-induced ROS production were analyzed via three-way ANOVA examining the effect of genotype, KA treatment, and hippocampal area on aspects of dHE fluorescence. Once it was confirmed that there were no significant differences among different hippocampal areas, the results of genotype and KA treatment were confirmed with two-way ANOVA.
Lentiviral tau knockdown and cell viability in response to 48-hour treatment with Aβ42 were analyzed via One-Way ANOVA with Holm-Sidak post-hoc analysis.
Two-way ANOVA with Holm-Sidak post-hoc tests were used to examine the effect of Aβ42 pretreatment and tau knockdown on KA-induced Ca2+cyt responses. One-way ANOVAs were performed to confirm the effect of only Aβ42 on KA-induced Ca2+cyt responses.
To examine the differences between the KA-induced Ca2+cyt responses with “No Aβ”, “Acute Aβ”, or “Chronic Aβ” pretreatment in the presence or absence of mGluR1 and mGluR5 inhibitors, Bay/MPEP, non-parametric Kruskal-Wallis tests were used with Dunn’s Multiple Comparison post-hoc analyses. The same non-parametric tests were used to analyze the effect of DHPG, Aβ, and CPA, with or without Bay/MPEP, on the release of internal Ca2+ stores. Non-parametric tests were necessary in these cases due to non-Gaussian distribution of the data and non-equality of standard deviations among experimental groups.
Highlights.
Tau facilitates KA-induced seizures and hippocampal superoxide production in mice in vivo.
Tau does not facilitate KA-induced Ca2+ influx in rat primary neurons cultures on its own or in cooperation with Aβ42.
Aβ42 biphasically modulates KA-induced Ca2+ influx in rat neurons: acute Aβ42 enhances, while chronic Aβ42 decreases it.
Aβ42 modulation of KA-induced Ca2+ influx is not mediated by group 1 mGluRs.
Acknowledgments
The authors would like to acknowledge the laboratory of John Olschowka, Ph.D., and Kerry O’Banion, M.D., Ph.D., for assistance with the processing of the mouse brains for analysis of dHE staining; Corey Brizzee for making lentiviruses; Keith Nehrke, Ph.D., for guidance in Ca2+cyt imaging studies and use of his Fura2 imaging equipment; and Changyong Feng, Ph.D., for assistance with statistical analysis of mouse seizure behavior. The research performed herein was funded by NIH grant NS076789.
Footnotes
Publisher's Disclaimer: This is a PDF file of an unedited manuscript that has been accepted for publication. As a service to our customers we are providing this early version of the manuscript. The manuscript will undergo copyediting, typesetting, and review of the resulting proof before it is published in its final citable form. Please note that during the production process errors may be discovered which could affect the content, and all legal disclaimers that apply to the journal pertain.
Contributor Information
Susanne P. Pallo, Email: Susanne_pritchard@urmc.rochester.edu.
Alexis Cook, Email: acook2015@gmail.com.
Bradley Nilsson, Email: nilsson@chem.rochester.edu.
Gail V.W. Johnson, Email: john.dimaio@rochester.edu.
References
- Amatniek JC, et al. Incidence and predictors of seizures in patients with Alzheimer’s disease. Epilepsia. 2006;47:867–72. doi: 10.1111/j.1528-1167.2006.00554.x. [DOI] [PubMed] [Google Scholar]
- Ango F, et al. Agonist-independent activation of metabotropic glutamate receptors by the intracellular protein Homer. Nature. 2001;411:962–5. doi: 10.1038/35082096. [DOI] [PubMed] [Google Scholar]
- Brennan AM, et al. NADPH oxidase is the primary source of superoxide induced by NMDA receptor activation. Nat Neurosci. 2009;12:857–63. doi: 10.1038/nn.2334. [DOI] [PMC free article] [PubMed] [Google Scholar]
- Carroll FY, et al. BAY36-7620: a potent non-competitive mGlu1 receptor antagonist with inverse agonist activity. Mol Pharmacol. 2001;59:965–73. [PMC free article] [PubMed] [Google Scholar]
- Chamberlain SE, et al. SUMOylation and phosphorylation of GluK2 regulate kainate receptor trafficking and synaptic plasticity. Nat Neurosci. 2012;15:845–52. doi: 10.1038/nn.3089. [DOI] [PMC free article] [PubMed] [Google Scholar]
- Cho K, et al. Regulation of kainate receptors by protein kinase C and metabotropic glutamate receptors. J Physiol. 2003;548:723–30. doi: 10.1113/jphysiol.2003.040188. [DOI] [PMC free article] [PubMed] [Google Scholar]
- Dawson HN, et al. Inhibition of neuronal maturation in primary hippocampal neurons from tau deficient mice. J Cell Sci. 2001;114:1179–87. doi: 10.1242/jcs.114.6.1179. [DOI] [PubMed] [Google Scholar]
- Dawson HN, et al. Loss of tau elicits axonal degeneration in a mouse model of Alzheimer’s disease. Neuroscience. 2010;169:516–31. doi: 10.1016/j.neuroscience.2010.04.037. [DOI] [PMC free article] [PubMed] [Google Scholar]
- DeVos SL, et al. Antisense reduction of tau in adult mice protects against seizures. J Neurosci. 2013;33:12887–97. doi: 10.1523/JNEUROSCI.2107-13.2013. [DOI] [PMC free article] [PubMed] [Google Scholar]
- Doran TM, et al. Turn nucleation perturbs amyloid beta self-assembly and cytotoxicity. J Mol Biol. 2012;421:315–28. doi: 10.1016/j.jmb.2012.01.055. [DOI] [PMC free article] [PubMed] [Google Scholar]
- Eckert A, et al. Convergence of Amyloid-beta and Tau Pathologies on Mitochondria In Vivo. Mol Neurobiol. 2010 doi: 10.1007/s12035-010-8109-5. [DOI] [PMC free article] [PubMed] [Google Scholar]
- Furukawa K, et al. Alteration in calcium channel properties is responsible for the neurotoxic action of a familial frontotemporal dementia tau mutation. J Neurochem. 2003;87:427–36. doi: 10.1046/j.1471-4159.2003.02020.x. [DOI] [PubMed] [Google Scholar]
- Hauser WA, et al. Seizures and myoclonus in patients with Alzheimer’s disease. Neurology. 1986;36:1226–30. doi: 10.1212/wnl.36.9.1226. [DOI] [PubMed] [Google Scholar]
- Hesdorffer DC, et al. Dementia and adult-onset unprovoked seizures. Neurology. 1996;46:727–30. doi: 10.1212/wnl.46.3.727. [DOI] [PubMed] [Google Scholar]
- Holth JK, et al. Tau loss attenuates neuronal network hyperexcitability in mouse and Drosophila genetic models of epilepsy. J Neurosci. 2013;33:1651–9. doi: 10.1523/JNEUROSCI.3191-12.2013. [DOI] [PMC free article] [PubMed] [Google Scholar]
- Ittner LM, et al. Dendritic function of tau mediates amyloid-beta toxicity in Alzheimer’s disease mouse models. Cell. 2010;142:387–97. doi: 10.1016/j.cell.2010.06.036. [DOI] [PubMed] [Google Scholar]
- Jin M, et al. Soluble amyloid beta-protein dimers isolated from Alzheimer cortex directly induce Tau hyperphosphorylation and neuritic degeneration. Proc Natl Acad Sci U S A. 2011;108:5819–24. doi: 10.1073/pnas.1017033108. [DOI] [PMC free article] [PubMed] [Google Scholar]
- Leugers CJ, Lee G. Tau potentiates nerve growth factor-induced mitogen-activated protein kinase signaling and neurite initiation without a requirement for microtubule binding. J Biol Chem. 2010;285:19125–34. doi: 10.1074/jbc.M110.105387. [DOI] [PMC free article] [PubMed] [Google Scholar]
- Liang LP, Ho YS, Patel M. Mitochondrial superoxide production in kainate-induced hippocampal damage. Neuroscience. 2000;101:563–70. doi: 10.1016/s0306-4522(00)00397-3. [DOI] [PubMed] [Google Scholar]
- Minkeviciene R, et al. Amyloid beta-induced neuronal hyperexcitability triggers progressive epilepsy. J Neurosci. 2009;29:3453–62. doi: 10.1523/JNEUROSCI.5215-08.2009. [DOI] [PMC free article] [PubMed] [Google Scholar]
- Nasu-Nishimura Y, et al. Differential regulation of kainate receptor trafficking by phosphorylation of distinct sites on GluR6. J Biol Chem. 2010;285:2847–56. doi: 10.1074/jbc.M109.081141. [DOI] [PMC free article] [PubMed] [Google Scholar]
- Pagano A, et al. The non-competitive antagonists 2-methyl-6-(phenylethynyl)pyridine and 7-hydroxyiminocyclopropan[b]chromen-1a-carboxylic acid ethyl ester interact with overlapping binding pockets in the transmembrane region of group I metabotropic glutamate receptors. J Biol Chem. 2000;275:33750–8. doi: 10.1074/jbc.M006230200. [DOI] [PubMed] [Google Scholar]
- Pallo SP, Johnson GV. Tau facilitates Abeta-induced loss of mitochondrial membrane potential independent of cytosolic calcium fluxes in mouse cortical neurons. Neurosci Lett. 2015 doi: 10.1016/j.neulet.2015.04.021. [DOI] [PMC free article] [PubMed] [Google Scholar]
- Palop JJ, et al. Aberrant excitatory neuronal activity and compensatory remodeling of inhibitory hippocampal circuits in mouse models of Alzheimer’s disease. Neuron. 2007;55:697–711. doi: 10.1016/j.neuron.2007.07.025. [DOI] [PMC free article] [PubMed] [Google Scholar]
- Patel M, Li QY. Age dependence of seizure-induced oxidative stress. Neuroscience. 2003;118:431–7. doi: 10.1016/s0306-4522(02)00979-x. [DOI] [PubMed] [Google Scholar]
- Quintanilla RA, et al. Truncated tau and Abeta cooperatively impair mitochondria in primary neurons. Neurobiol Aging. 2012;33:619 e25–35. doi: 10.1016/j.neurobiolaging.2011.02.007. [DOI] [PMC free article] [PubMed] [Google Scholar]
- Racine RJ. Modification of seizure activity by electrical stimulation. II. Motor seizure. Electroencephalogr Clin Neurophysiol. 1972;32:281–94. doi: 10.1016/0013-4694(72)90177-0. [DOI] [PubMed] [Google Scholar]
- Rhein V, et al. Amyloid-beta and tau synergistically impair the oxidative phosphorylation system in triple transgenic Alzheimer’s disease mice. Proc Natl Acad Sci U S A. 2009;106:20057–62. doi: 10.1073/pnas.0905529106. [DOI] [PMC free article] [PubMed] [Google Scholar]
- Roberson ED, et al. Reducing endogenous tau ameliorates amyloid beta-induced deficits in an Alzheimer’s disease mouse model. Science. 2007;316:750–4. doi: 10.1126/science.1141736. [DOI] [PubMed] [Google Scholar]
- Roberson ED, et al. Amyloid-beta/Fyn-induced synaptic, network, and cognitive impairments depend on tau levels in multiple mouse models of Alzheimer’s disease. J Neurosci. 2011;31:700–11. doi: 10.1523/JNEUROSCI.4152-10.2011. [DOI] [PMC free article] [PubMed] [Google Scholar]
- Rojas A, et al. Activation of group I metabotropic glutamate receptors potentiates heteromeric kainate receptors. Mol Pharmacol. 2013;83:106–21. doi: 10.1124/mol.112.081802. [DOI] [PMC free article] [PubMed] [Google Scholar]
- Romanelli MF, et al. Advanced Alzheimer’s disease is a risk factor for late-onset seizures. Arch Neurol. 1990;47:847–50. doi: 10.1001/archneur.1990.00530080029006. [DOI] [PubMed] [Google Scholar]
- Siskova Z, et al. Dendritic structural degeneration is functionally linked to cellular hyperexcitability in a mouse model of Alzheimer’s disease. Neuron. 2014;84:1023–33. doi: 10.1016/j.neuron.2014.10.024. [DOI] [PubMed] [Google Scholar]
- Small SA, Duff K. Linking Abeta and tau in late-onset Alzheimer’s disease: a dual pathway hypothesis. Neuron. 2008;60:534–42. doi: 10.1016/j.neuron.2008.11.007. [DOI] [PMC free article] [PubMed] [Google Scholar]
- Tang F, Dent EW, Kalil K. Spontaneous calcium transients in developing cortical neurons regulate axon outgrowth. J Neurosci. 2003;23:927–36. doi: 10.1523/JNEUROSCI.23-03-00927.2003. [DOI] [PMC free article] [PubMed] [Google Scholar]
- Tiscornia G, Singer O, Verma IM. Design and cloning of lentiviral vectors expressing small interfering RNAs. Nat Protoc. 2006;1:234–40. doi: 10.1038/nprot.2006.36. [DOI] [PubMed] [Google Scholar]
- Um JW, et al. Alzheimer amyloid-beta oligomer bound to postsynaptic prion protein activates Fyn to impair neurons. Nat Neurosci. 2012;15:1227–35. doi: 10.1038/nn.3178. [DOI] [PMC free article] [PubMed] [Google Scholar]
- Um JW, et al. Metabotropic glutamate receptor 5 is a coreceptor for Alzheimer abeta oligomer bound to cellular prion protein. Neuron. 2013;79:887–902. doi: 10.1016/j.neuron.2013.06.036. [DOI] [PMC free article] [PubMed] [Google Scholar]
- Vossel KA, et al. Seizures and epileptiform activity in the early stages of Alzheimer disease. JAMA Neurol. 2013;70:1158–66. doi: 10.1001/jamaneurol.2013.136. [DOI] [PMC free article] [PubMed] [Google Scholar]
- Wang Q, et al. Kainic acid-mediated excitotoxicity as a model for neurodegeneration. Mol Neurobiol. 2005;31:3–16. doi: 10.1385/MN:31:1-3:003. [DOI] [PubMed] [Google Scholar]
- Wong RK, et al. Group I mGluR-induced epileptogenesis: distinct and overlapping roles of mGluR1 and mGluR5 and implications for antiepileptic drug design. Epilepsy Curr. 2005;5:63–8. doi: 10.1111/j.1535-7597.2005.05207.x. [DOI] [PMC free article] [PubMed] [Google Scholar]
- Zilberter M, et al. Dietary energy substrates reverse early neuronal hyperactivity in a mouse model of Alzheimer’s disease. J Neurochem. 2013;125:157–71. doi: 10.1111/jnc.12127. [DOI] [PubMed] [Google Scholar]