Abstract
Adenosine is an important regulator of the immune response and adenosine deaminase (ADA) inhibits this regulatory effect by converting adenosine into functionally inactive molecules. Studies have shown that adenosine receptor (AR) agonists can be either anti- or pro-inflammatory. Clarification of the mechanisms that cause these opposing effects should provide a better guide for therapeutic intervention. In this study, we investigated the effect of ADA on the development of experimental autoimmune uveitis (EAU) induced by immunizing EAU-prone mice with a known uveitogenic peptide, IRBP1–20. Our results showed that the effective time to administer a single dose of ADA to suppress induction of EAU was 8–14 days post-immunization, shortly before EAU expression, but ADA treatment at other time points exacerbated disease. ADA preferentially inhibited Th17 responses and this effect was γδ T cell-dependent. Our results demonstrated that the existing immune status strongly influences the anti- or proinflammatory effects of ADA. Our observations should help improve the design of ADA- and AR-targeted therapies.
Keywords: autoimmunity, adenosine receptors, experimental autoimmune uveitis, γδ T cells, IL-17, Th17, uveitis
Introduction
In inflammatory and ischemic conditions, production of endogenous adenosine in the extracellular environment modulates various biological responses, including immune responses (1–4). Newly formed adenosine is rapidly removed from tissues by adenosine-metabolizing enzymes. The discovery of the potent effects of adenosine on inflammation and immune responses has led to attempts at treatment of immune dysfunction by targeting adenosine receptor (AR) signaling (2; 3; 5; 6). Unfortunately, the successful application of such treatment has been hindered by our incomplete understanding of the sophisticated purinergic signaling events that occur in various cellular components under different pathophysiological circumstances (3; 7).
Adenosine deaminase (ADA) is an adenosine-degrading enzyme that is expressed in almost all animal tissues (8). Exogenous ADA was initially used to treat immune deficiencies involving ADA dysfunction (4; 9–11), but subsequent studies showed enhanced ADA function was associated with increased incidence of autoimmune disease (4; 12) and that suppression of aberrant ADA activity by ADA inhibitors has an anti-inflammatory effect (13; 14). Our interest in the use of ADA to treat autoimmune disease started with our early observation that ligands of adenosine A2A receptors (A2ARs) or adenosine A2B receptors (A2BRs) enhance, rather than suppress, Th17 autoreactive T cell responses (15–17). Since ADA counteracts the effects of adenosine (9; 18; 19), we wished to determine whether ADA could be used to suppress Th17-type autoimmune responses. In this study, we showed that ADA can inhibit the development of experimental autoimmune uveitis (EAU). We also showed that this effect is dependent on γδ T cell function, is significantly reduced in recipient mice with defective γδ T cell function (TCR-δ−/− mice), and is restored if the TCR-δ−/− recipient mice received an injection of γδ T cells before induction of EAU. A kinetic study in which recipient mice were treated during different disease phases confirmed our previous finding (15) that the outcome of AR-targeted treatment is not always consistent and that the effect of treatment can be either pro- or anti-inflammatory, depending upon the immune status of the recipient. The suppressive effect was seen when ADA was administered on day 8–14, shortly before disease expression, whereas disease was exacerbated if ADA was injected either before EAU induction or immediately after EAU expression. We conclude that a single injection of ADA can effectively suppress an ongoing autoimmune response, but, in order to achieve a desirable therapeutic effect and avoid undesired effects, the immune status of the recipients should first be determined.
Materials and Methods
Animals and reagents
Female C57BL/6 (B6) and TCR-δ−/− mice on the B6 background, purchased from Jackson Laboratory (Bar Harbor, ME), were housed and maintained in the animal facilities of the University of California, Los Angeles and were used at 12–16 weeks of age. The experimental protocols were approved by the Institutional Animal Care and Use Committee of the University of California Los Angeles (Protocol number: ARC#2014-029-03A). Recombinant murine IL-12 and IL-23 were purchased from R & D Systems (Minneapolis, MN), fluorescein isothiocyanate (FITC)-, phycoerythrin (PE)-, or allophycocyanin (APC)-conjugated mouse monoclonal antibodies against mouse αβ T cell receptor (TCR, clone H57–597), mouse γδ TCR (clone GL3), mouse IL-17, mouse IFN-γ, mouse MHC class II, or mouse CD25 and isotype control antibodies were purchased from BioLegend (San Diego, CA). ADA was a gift from Sigma-Tau Pharmaceuticals Inc. (Gaithersburg, MD).
Cell preparation
At day 13 post-immunization, CD3+ T cells were purified from the spleen or draining lymph nodes of B6 or TCR-δ−/− mice immunized with peptide IRBP1–20 (amino acids 1–20 of human IRBP, Sigma) by positive selection using a combination of FITC-conjugated anti-CD3 antibodies and anti-FITC antibody-coated Microbeads, followed by separation on an auto-MACS separator according to the manufacturer’s suggested protocol (Miltenyi Biotec, Auburn, CA).
αβ T cells, γδ T cells, and dendritic cells (DCs) were isolated from IRBP1–20-immunized mice at 13 days post-immunization. γδ T cells were separated from the CD3+ T cells from IRBP1–20-immunized B6 mice by positive selection using a combination of FITC-conjugated anti-TCR-δ antibodies and anti-FITC antibody-coated Microbeads, followed by separation using an auto-MACS. αβ T cells were prepared from the spleens or draining lymph nodes of IRBP1–20-immunized B6 or TCR-δ−/− mice by positive selection, using a combination of FITC-conjugated anti-CD3 antibody and anti-FITC antibody-coated Microbeads. The purity of the isolated cells was >95%, as determined by flow cytometric analysis using PE-conjugated antibodies against αβ or γδ T cells. CD11c+ dendritic cells (DCs) were sorted from spleens of ADA-treated or untreated, IRBP1–20-immunized B6 mice.
To test γδ T responses to DCs (Fig. 6), freshly prepared γδ T cells from immunized TCR-δ−/− mice were cultured in cytokine-free medium for 5 days (to assure the resting status of the cells, since γδ T cells freshly isolated from immunized mice are activated), then were incubated with DCs for 48 h at a γδ T cell : DC ratio of 10:1.
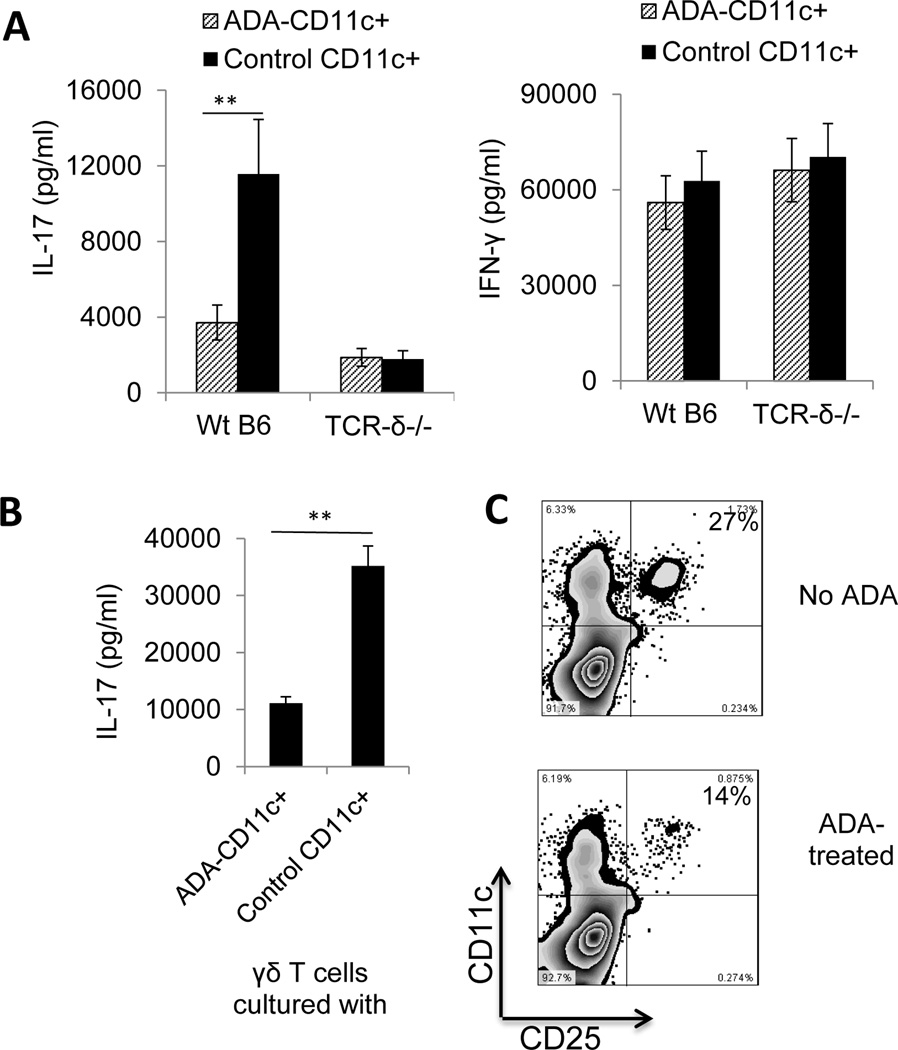
Fig. 6. Effect of ADA injection on day 8 post-immunization on DC activation in vivo.
Two groups of B6 mice (n=6) were immunized with IRBP1–20/CFA and one group was injected i.p. with a single dose of ADA (5U/mouse) and the other with PBS on day 8 post-immunization, then, on day 13 post-immunization, splenic DCs (CD11c+) were prepared using MACS columns.
(A) DCs from ADA-treated and untreated mice were incubated with responder T cells (1 × 10⁶/well) from immunized B6 and TCR-δ−/− mice, then the 48 h culture supernatants were tested for IL-17 (left panel) and IFN-γ (right panel).
(B) DCs from ADA-treated and untreated mice were incubated with γδ T cells from immunized B6 mice and the 48 h culture supernatants tested for IL-17.
(C) DCs from untreated mice (upper panel) or ADA-treated mice (lower panel) were double stained with anti-mouse CD25 and anti-mouse CD11c antibodies and subjected to FACs analysis. Data are from a single experiment, representative of three independent experiments. In A and B, *p < 0.05
EAU induction and evaluation
To induce EAU, B6 mice were injected subcutaneously at 6 spots at the tail base and on the flank with a total of 200 µl of emulsion consisting of equal volumes of 150 µg of peptide IRBP1–20 in PBS and CFA (Difco) and intraperitoneally (i.p.) with 200 ng of pertussis toxin (Sigma). The mice were then randomly grouped and injected i.p. with PBS (vehicle), ADA in PBS (5U/mouse), or erythro-9-(2-hydroxy-3-nonyl) adenine (EHNA) in PBS on day 8 post-immunization. They were then examined three times a week until the end of the experiment (day 30 post-immunization). For adoptive transfer, recipient mice were injected i.p. with 2 × 10⁶ IRBP1–20-specific T cells prepared as described previously (20; 21) in 0.2 ml of PBS.
To examine mice for clinical signs of EAU by indirect fundoscopy, the pupils were dilated using 0.5% tropicamide and 1.25% phenylephrine hydrochloride ophthalmic solutions. Fundoscopic grading of disease was performed using the scoring system described previously (22). For histology, whole eyes were collected at the end of the experiment and prepared for histopathological evaluation. The eyes were immersed for 1 h in 4% phosphate-buffered glutaraldehyde, then transferred to 10% phosphate-buffered formaldehyde until processed. Fixed and dehydrated tissues were embedded in methacrylate, and 5 µm sections were cut through the pupillary-optic nerve plane and stained with hematoxylin and eosin.
Assessment of Th1 and Th17 polarized responses
Responder CD3+ T cells (3 × 10⁶) prepared from IRBP1–20-immunized B6 or TCR-δ−/− mice were co-cultured for 48 h with IRBP1–20 (10 µg/ml) and irradiated spleen cells (2 × 10⁶/well) as antigen-presenting cells (APCs) in a 12-well plate under either Th17 polarized conditions (culture medium supplemented with 10 ng/ml of IL-23) or Th1 polarized conditions (culture medium supplemented with 10 ng/ml of IL-12). IL-17 and IFN-γ levels in the culture medium were then measured using ELISA kits (R & D Systems) and the number of antigen-specific T cells expressing IL-17 or IFN-γ determined by intracellular staining, followed by FACS analysis, as described below (23; 24).
ELISA measurement of cytokine levels in serum and culture supernatants
ELISA was used to measure cytokine (IFN-γ and IL-17) levels in the serum on day 13 post-immunization and in the 48 h culture supernatants of responder T cells isolated from immunized B6 or TCR-γ−/− mice with or without prior injection of γδ T cells.
Immunofluorescence flow cytometry for surface and cytoplasmic antigens
In vivo primed T cells were stimulated with the immunizing antigen and APCs for 5 days, then the T cells were separated using Ficoll gradient centrifugation and stimulated in vitro for 4 h with 50 ng/ml of PMA, 1 µg/ml of ionomycin, and 1 µg/ml of brefeldin A (all from Sigma). Aliquots of cells (2 × 10⁵ cells) were then fixed, permeabilized overnight with Cytofix/Cytoperm buffer (eBioscience, San Diego, CA), and intracellularly stained with PE-conjugated anti-mouse IFN-γ antibodies or FITC-labeled anti-mouse IL-17 antibodies. Data collection and analysis were performed on a FACScalibur flow cytometer using CellQuest software.
Statistical analysis
All experiments were repeated 4–5 times. Experimental groups typically consisted of six mice, and the figures show the data from a representative experiment. The statistical significance of differences between the values for different groups was examined using the Mann Whitney U-test.
Results
ADA injection inhibits EAU induction in B6 mice
We previously demonstrated that Th17 and Th1 autoimmune responses respond differently to treatment with AR agonists, as AR agonists, especially A2AR-specific agonists, suppress Th1 autoimmune responses, but augment Th17 autoimmune responses (15; 16). We were therefore interested in determining whether removal of adenosine by ADA would suppress the Th17 response and inhibit induction of EAU.
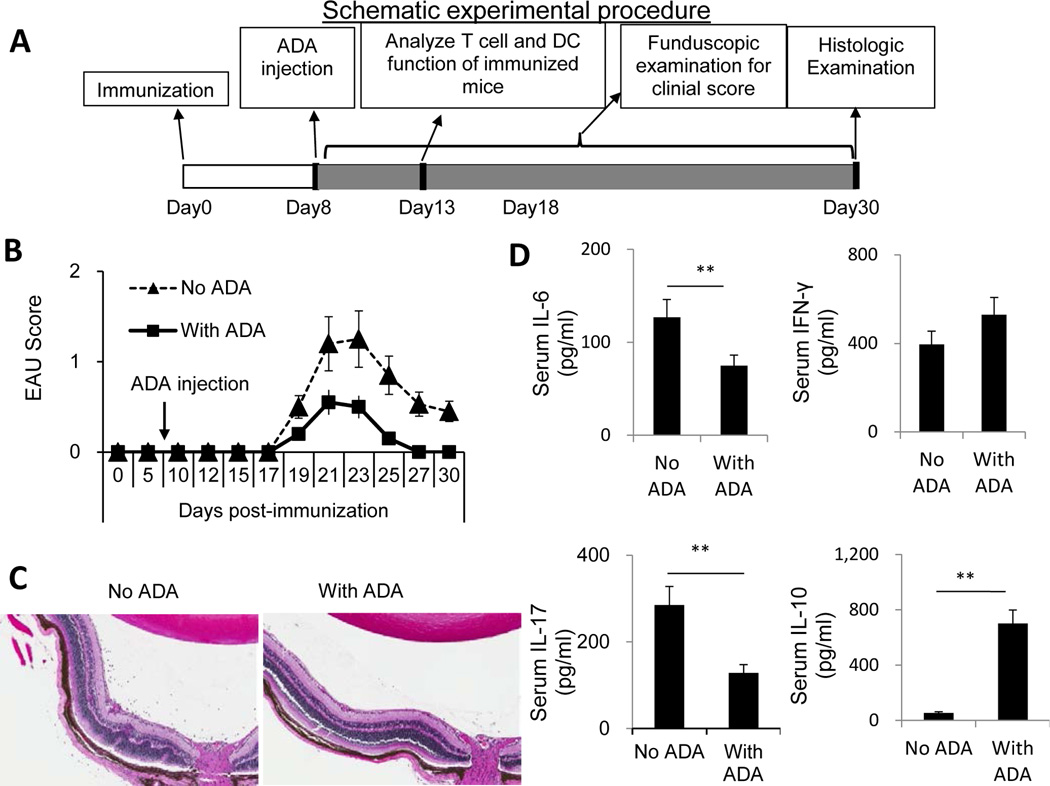
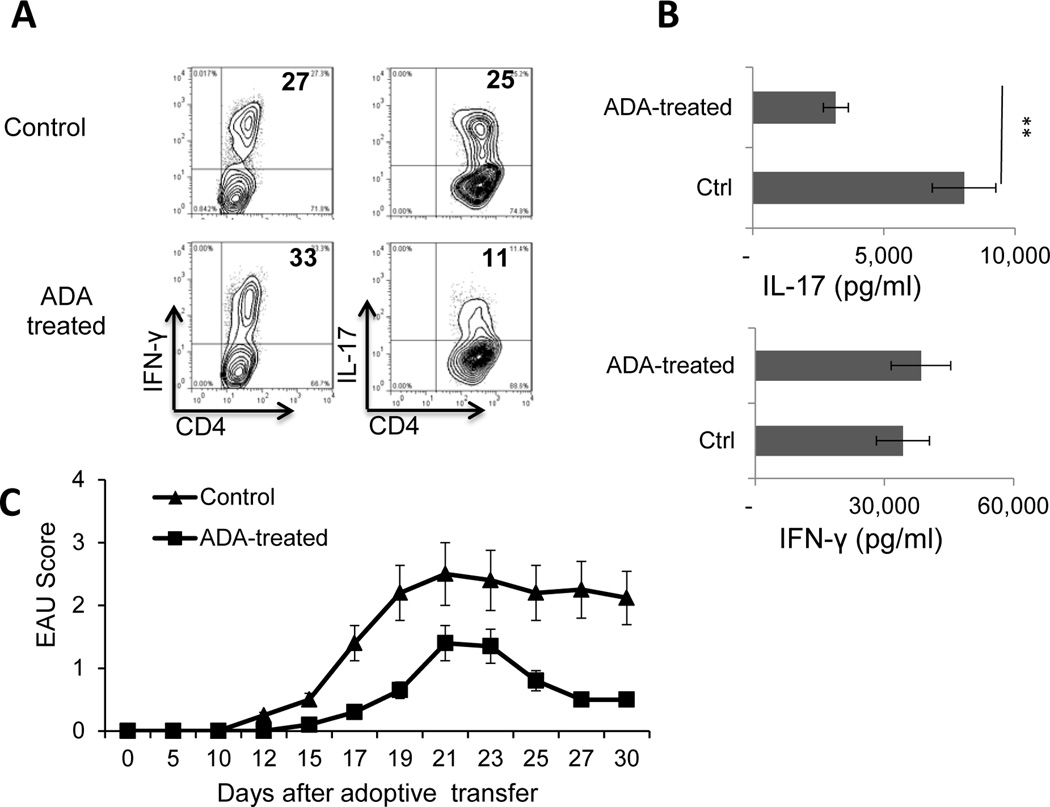
A schematic procedure of disease induction and examination of mice under investigation is demonstrated in Fig.1A. B6 mice were immunized with the uveitogenic peptide IRBP1–20 in CFA, then randomly divided into two groups (n=6), one of which received an i.p. injection of ADA (5U/mouse) at day 8 post-immunization and the other received vehicle. At day 13 post-immunization (the time at which the highest T cell response is seen), serum cytokine levels were measured by ELISA; in addition, responder T cells were purified from the spleen and draining lymph nodes, stimulated in vitro with the immunizing peptide and APCs (irradiated spleen cells) under culture conditions that favor Th17 or Th1 autoreactive T cell expansion (medium containing 10 ng/ml of, respectively, IL-23 or IL-12) (24; 25) and the T cells separated by Ficoll gradient centrifugation and stained intracellularly with FITC-labeled anti-IFN-γ or anti–IL-17 antibodies. The results showed that the mice that received ADA had significantly milder disease, as shown by fundoscopy (Fig. 1B) and pathologic examination (Fig. 1C), and recovered significantly earlier than the untreated mice (Fig. 1B). Measurement of serum cytokines showed that, compared to controls, ADA treatment caused a significant decrease in serum IL-6 and IL-17 levels but a slight increase in serum IFN-γ and IL-10 levels (Fig. 1D). The Th1 and Th17 responses, assessed by intracellular staining of IRBP-specific T cells after 5 days of in vitro stimulation with the immunizing antigen and APCs, showed that T cells from ADA recipients generated significantly fewer IL-17+ αβ T cells than those from the control mice, whereas the number of IFN-γ+ T cells was slightly increased (Fig. 2A). IL-17 and IFN-γ double positive cells are not abundantly seen in this mouse model. The cytokine production results measured at 48 h after in vitro stimulation agreed with those obtained by intracellular staining; as shown in Fig. 2B, responder T cells from ADA-treated mice produced significantly less IL-17 than T cells from non-treated mice when activated under Th17-polarizing conditions (culture medium containing 10 ng/ml IL-23) (top panel), whereas there was little difference in the amount of IFN-γ produced by the two sets of responder T cells under Th1-polarizing conditions (culture medium containing 10 ng/ml IL-12) (bottom panel). We also compared the pathogenic activity of the IRBP-specific T cells isolated from treated and untreated mice when transferred into naive recipients and found that T cells from ADA-treated mice had decreased EAU-inducing activity (Fig. 2C).
Fig. 1. ADA injection of EAU-prone B6 mice on day 8 post-immunization reduces EAU induction by inhibiting Th17 autoimmune responses.
Two groups of B6 mice (n=6) were immunized with IRBP1–20/CFA, then, on day 8 post-immunization, one group was injected i.p. with a single dose of ADA (5U/mouse) and the other with PBS.
(A) A schematic procedure of disease induction and examination
(B) Time-course of the EAU clinical score.
(C) Eye samples from each group were taken on day 25 post-immunization and sections subjected to pathological examination by H&E staining.
(D) Serum was collected on day 13 post-immunization and IL-6, IL-10, IFN-γ, and IL-17 levels measured by ELISA. The data are from a single experiment, representative of three independent experiments **, p < 0.05.
Fig. 2. ADA injection suppresses Th17 responses in IRBP1–20-immunized mice and IRBP-specific T cells isolated from ADA-treated mice are less pathogenic.
Immunized B6 mice (n=6) were left untreated or were injected with ADA or PBS on day 8 post-immunization as in Fig. 1, then CD3+ splenic T cells were isolated on day 13 post-immunization using a MACS sorter, and stimulated with the immunizing peptide and APCs for 5 days.
(A) Th17 response evaluated by treating the cells with PMA, ionomycin, and brefeldin, then staining them with FITC-conjugated anti-CD4 antibodies and PE-conjugated anti-IFN-γ antibodies (left panels) or anti-IL-17 antibodies (right panels), followed by FACS analysis. Data are from a single experiment, representative of three independent experiments.
(B). IL-17 and IFN-γ levels in 48 h culture supernatants of in vitro activated autoreactive T cells measured by ELISA. **p < 0.01.
(C) Comparison of EAU-inducing ability of IRBP-specific T cells from ADA-treated and untreated mice. The IRBP-specific T cells were collected 48 h after in vitro stimulation and adoptively transferred into naive B6 mice (2 × 10⁶/recipient mouse). EAU was clinically scored by fundoscopy.
An ADA inhibitor enhances the Th17 response in EAU
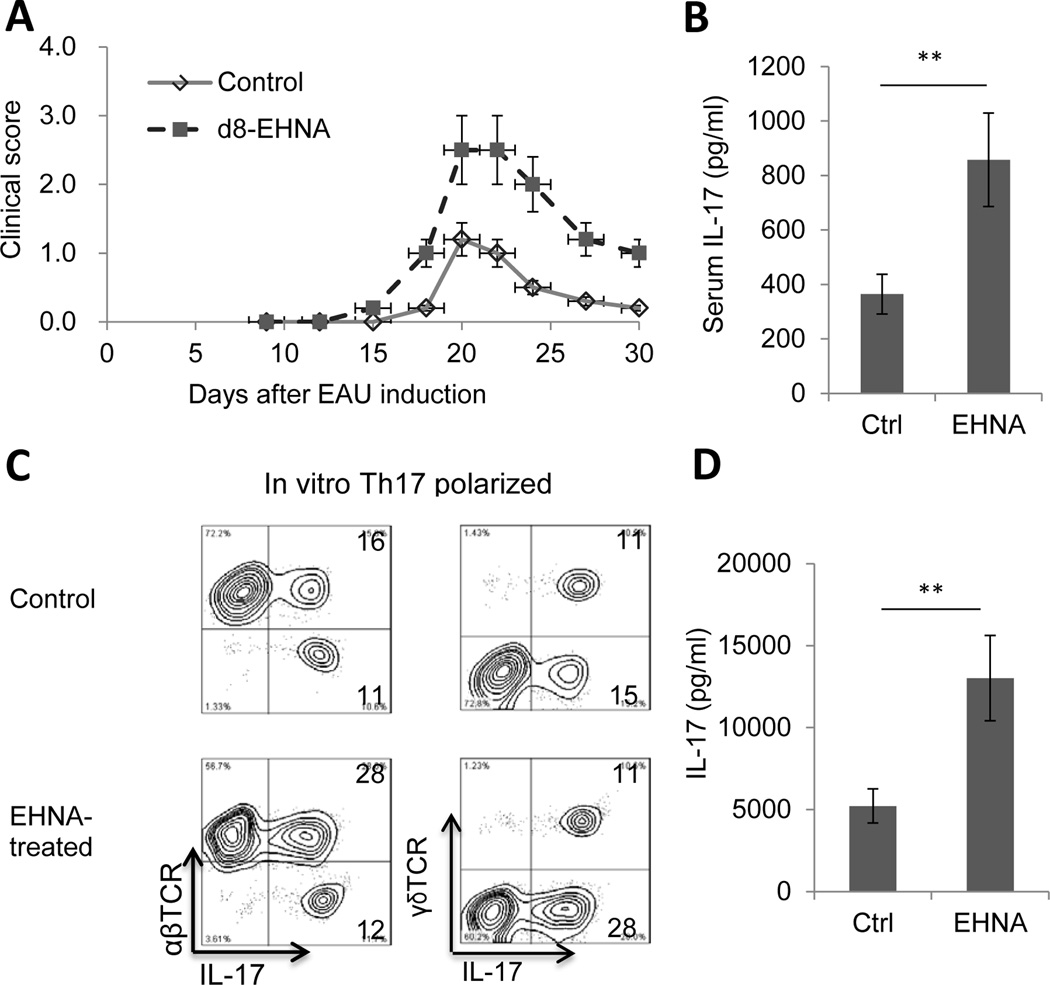
Erythro-9-(2-hydroxy-3-nonyl) adenine (EHNA) is a reversible inhibitor of ADA (26; 27). To determine the effect of injecting EHNA into mice after the start of the EAU induction process, two groups (n=6) of B6 mice were injected with IRBP1–20, then, on day 8 post-immunization, one group received a single i.p. injection of ENHA in PBS (10 mg/kg) and the other PBS. In contrast to the results with ADA treatment, compared to controls, ENHA-treated mice had a significantly higher EAU clinical score (Fig. 3A), significantly higher serum IL-17 levels (Fig. 3B), and a significantly higher percentage of IL-17+ αβ T cells among the in vivo primed responder T cells after 5 days’ in vitro stimulation with immunizing peptide and APCs (28% compared to 16% in controls; Fig. 3C), with little difference in the percentage of IFN-γ+ T cells (data not shown), and responder T cells produced significantly higher levels of IL-17 than those from non-treated mice when activated under Th17-polarizing conditions (Fig. 3D).
Fig. 3. An ADA inhibitor (EHNA) enhances the Th17 response in EAU.
Two groups (n=6) of B6 mice were immunized with IRBP1–20, then, on day 8 post-immunization, one group received a single i.p. injection of ENHA (10 mg/kg) and the other PBS.
(A) Clinical score up to day 30.
(B) Serum was collected on day 13 post-immunization and IL-17 measured by ELISA.
(C) CD3+ T cells were prepared on day 13 post-immunization and stimulated for 5 days in vitro with the immunizing peptide and APCs, then the percentage of IL-17+ cells among responder T cells was measured. Data are from a single experiment, representative of three independent experiments.
(D) IL-17 levels in the 48 h culture supernatants of in vitro activated autoreactive T cells assessed by ELISA. **p < 0.05.
Role of γδ T cells in the effect of ADA treatment
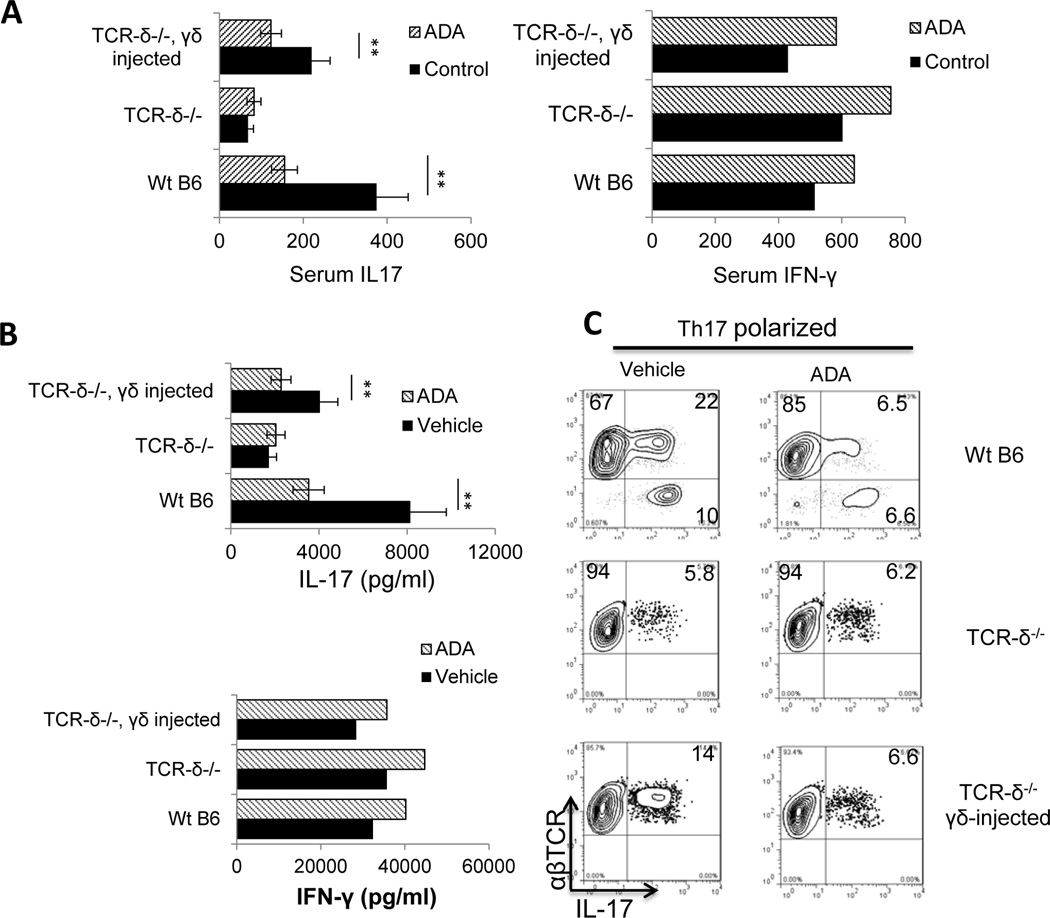
We previously reported that γδ T cells are important in enhancing Th17 autoimmune responses (15; 24; 28; 29) and that the effect of an AR agonist on EAU is γδ T cell-dependent (15; 16). To determine whether the ADA effect was also affected by γδ T cell function, groups (n=6) of wild type (wt) B6 and TCR-δ−/− mice, with or without transfer of γδ T cells (2 × 10⁶/recipient) from immunized B6 mice, were immunized with IRBP1–20/CFA and injected with ADA or PBS on day 8 post-immunization. Samples taken at day 13 post-immunization showed that the immunized TCR-δ−/− mice had significantly lower serum levels of IL-17 than immunized B6 mice, whereas serum IFN-γ levels were the same in both groups (Fig. 4A). Moreover, TCR-δ−/− mice did not respond to ADA treatment, as assessed by serum IL-17 levels (Fig. 4A), the amount of IL-17 secreted by in vitro activated Th17 cells (Fig. 4B), or the number of IL-17+ T cells generated (Fig. 4C). However, after injection of γδ T cells before immunization, TCR-δ−/− mice produced increased levels of IL-17 in the serum and this effect was inhibited by ADA injection (Fig. 4A). The results of intracellular staining for IL-17+ αβ T cells among the responder T cells (Fig. 4C) agreed with the serum cytokine study, showing that ADA treatment suppressed the generation of IL-17+ T cells in B6 mice, but not in TCR-δ−/− mice, and that TCR-δ−/− mice that received an i.p injection of γδ T cells before immunization showed an increased ability to generate IL-17+ T cells that was inhibited by ADA.
Fig. 4. The effect of ADA is γδ T cell-dependent.
One group of B6 mice and two groups of TCR-δ−/− mice (n=6 for each) were set up and mice in one of the TCR-δ−/− groups were injected with γδ T cells from immunized B6 mice (2 × 10⁶/mouse) immediately before immunization. All groups were then immunized with IRBP1–20/CFA, and ADA or PBS was injected i.p. on day 8 post-immunization.
(A) On day 13-post immunization, serum IL-17 levels (left panel) and IFN-γ levels (right panels) were measured by ELISA
(B) T cells isolated from each group of mice on day 13 post-immunization were stimulated in vitro with immunizing peptide and APCs under Th1-polarizing conditions (upper panel) or Th17-polarizing conditions (lower panel) and the 48 h culture supernatants assessed for IL-17 and IFN-γ by ELISA.
(C) The percentage of IL-17+ cells among the proliferating T cells was assessed after 5 days’ in vitro stimulation of CD3+ T cells taken on day 13 post-immunization with the immunizing peptide and APCs under Th17-polarizing conditions. Data are from a single experiment, representative of three independent experiments. In A and B, **p < 0.05.
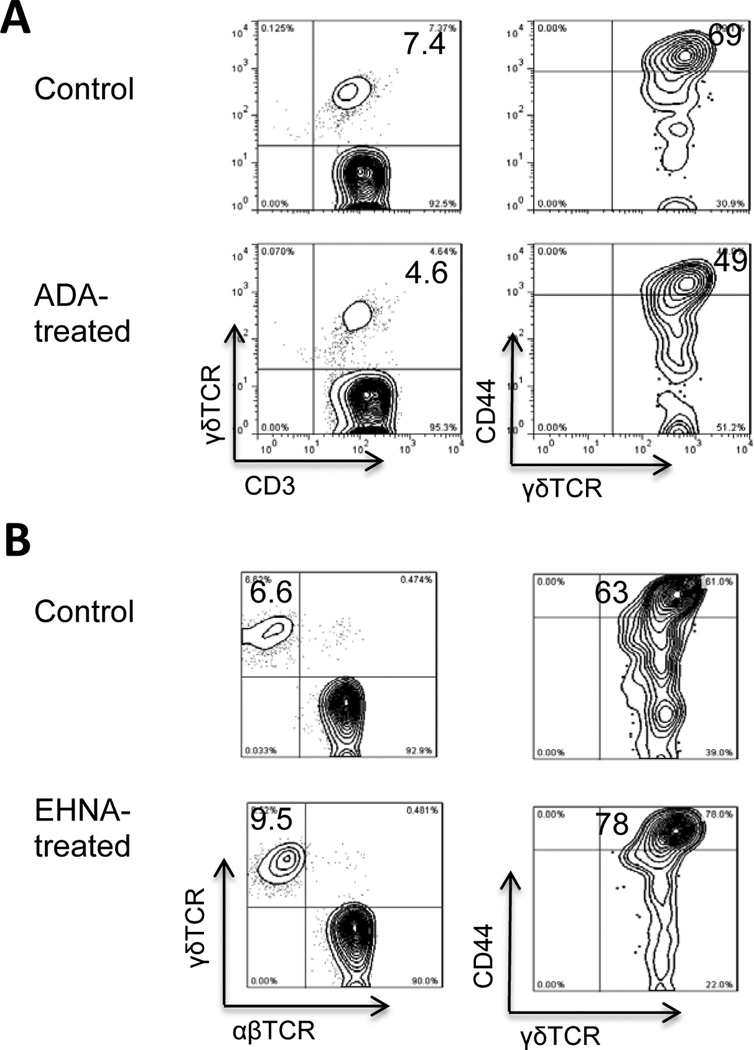
Mechanistic studies showed that in ADA-treated immunized B6 mice, γδ T cell activation was inhibited, as demonstrated by the smaller percentage (4.6 versus 7.4%) of γδ TCR-expressing T cells among the CD3+ T cells in ADA-treated mice and the smaller percentage of γδ T cells expressing the T cell activation marker CD44 (Fig. 5A). In contrast, mice treated with the ADA inhibitor (EHNA) showed a higher percentage (9.5 versus 6.6%) of γδ T cells among the CD3+ T cells, and a higher percentage (78 versus 63%) of γδ T cells expressing CD44 (Fig. 5B).
Fig. 5. Injection of ADA on day 8 post-immunization suppresses γδ T cell activation and injection of an ADA inhibitor (EHNA) on day 8 post-immunization enhances γδ T cell activation in vivo.
Four groups (n=6) of B6 mice were immunized with IRBP1–20, then one group was injected with ADA (A) and another with EHNA (B) on day 8 post-immunization, while the two control groups were injected with PBS, then CD3+ T cells were isolated at day 13 post-immunization.
(A) The percentage of γδ T cells among the CD3+ T cells was immediately estimated by FACS staining after double staining with anti-mouse CD3 and anti-mouse γδTCR antibodies (left panel) and the activation status of the γδ T cells was evaluated after double staining with antibodies against mouse γδTCR and mouse CD44, an activation marker of mouse T cells (right panel).
(B) The percentage of γδ T cells among the CD3+ T cells was immediately estimated by FACS staining.
Data are from a single experiment, representative of three independent experiments
Effect of ADA on DC activation
Previous studies have shown that ADA promotes T cell activation by affecting DC function (12; 14; 19). To determine whether ADA modulates the Th17 autoimmune response in EAU by its effect on DC functions, we compared the Th1 and Th17 stimulatory activity of DCs isolated from ADA-treated or untreated mice. As shown in Fig. 6A, when splenic DCs isolated from the spleen of ADA-treated and untreated immunized B6 mice were incubated for 48 h with responder CD3+ T cells from untreated immunized B6 or TCR-δ−/− mice and cytokine levels in the supernatants measured by ELISA, the results showed that DCs isolated from ADA-treated mice were less able to stimulate IL-17 production (Fig. 6A). We also compared the γδ T cell-stimulating effect of splenic DCs isolated from ADA-treated and untreated immunized B6 mice by incubating them with γδ T cells from immunized B6 mice and measuring IL-17 levels in the 48 h culture supernatants and found that γδ T cells produced significantly less IL-17 after incubation with DCs from ADA-treated mice than after incubation with DCs from untreated mice (Fig. 6B). Given our previous finding that the CD25+ DC subset has a strong stimulatory effect on Th17 autoreactive T cells (28; 30), we examined whether ADA treatment would suppress the differentiation of CD25+ DCs, leading to decreased Th17 activation. ADA administration did not change the total numbers of splenic CD11c+ cells; but it significantly reduced both absolute and relative numbers of splenic CD25+CD11c+ cells (data not shown). As shown in Fig. 6C, the percentage of splenic CD11c+ cells from ADA-treated immunized B6 mice that expressed CD25 was much smaller (14%) than that for untreated immunized B6 mice (27%).
The anti- and pro-inflammatory effects of ADA injection depend on timing of treatment
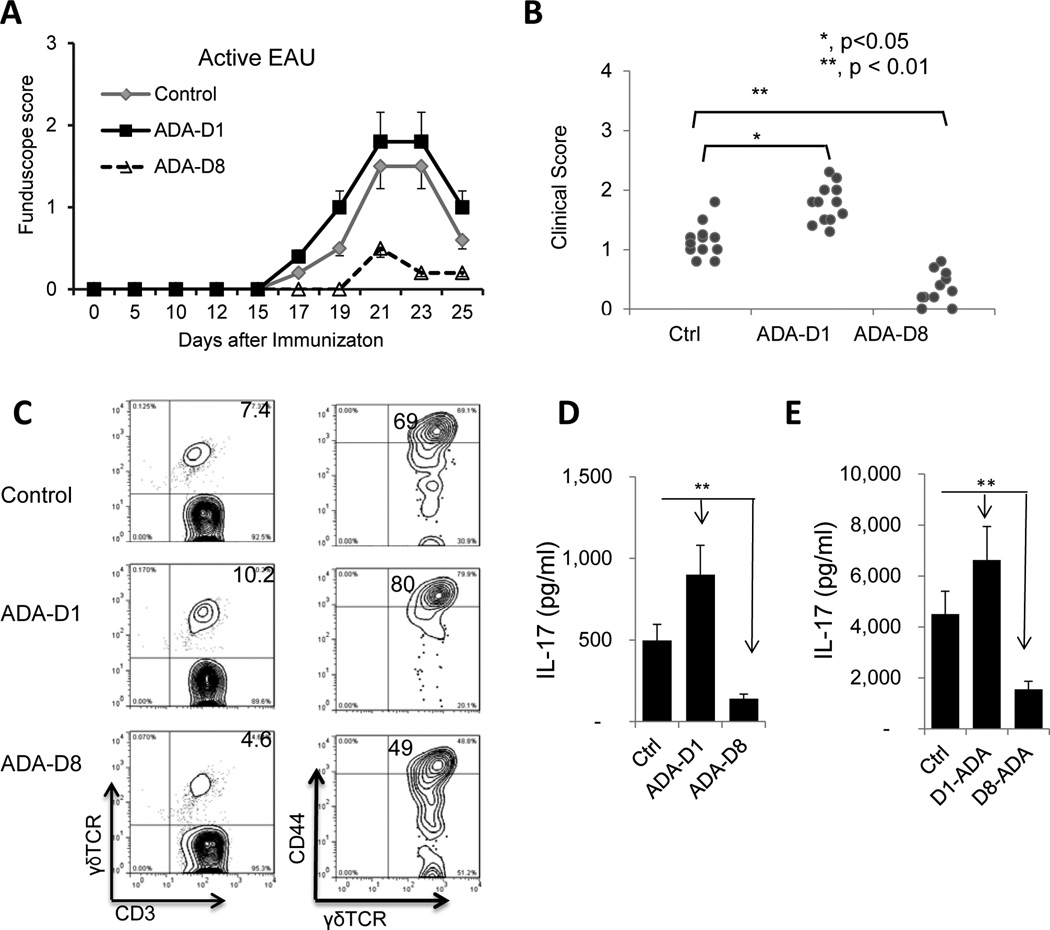
We have previously reported that administration of an AR agonist to mice immunized with IRBP1–20 can have either an enhancing or inhibitory effect on EAU induction, depending on the timing of treatment (15). To determine whether the timing of ADA treatment was important for its effect, we performed a kinetic study in which ADA was administered to mice at different days after immunization with IRBP1–20 and found that ADA administration on day 8 post-immunization significantly ameliorated EAU, whereas administration on day 1 significantly enhanced EAU (Fig. 7A and B). This enhancing effect was seen when ADA was injected between day 1 and 5 post-immunization, while an inhibitory effect was seen when ADA was administered between day 8 and 14 post-immunization (data not shown).
Fig. 7. Anti- and proinflammatory effects of ADA treatment.
Three groups of B6 mice (n=6) were immunized with IRBP1–20/CFA, then two of the groups were injected with a single dose of ADA (5U/mouse) either on day 1 post-immunization (ADA-D1) or on day 8 day post-immunization (ADA-D8).
(A&B) EAU was scored clinically by fundoscopy up to day 25 post-immunization. A single experiment is shown in (A) and data compiling two experiments are shown in (B).
(C) On day 13 post-immunization, the percentage of γδ T cells among freshly prepared total CD3+ cells (left panels) and the activation status of the γδ T cells (right panels) were compared among the ADA untreated group (top panels), ADA treatment on D1 post-immunization group (middle panels) and ADA treatment on D8 post-immunization group (bottom panels). The freshly prepared CD3+ cells were stained with anti-mouse γδTCR and anti-mouse CD3 antibodies (left panels) or stained with anti-mouse γδTCR and anti-mouse CD44, an activation marker of mouse T cell (right panels).
(D) ELISA assay of serum IL-17 on day 13 post-immunization in the three groups
(E) ELISA assay comparing IL-17 and IFN-γ production at 48 h by in vitro stimulated CD3 cells isolated on day 13 post-immunization from the 3 groups. Data are from a single experiment, representative of three independent experiments. *p < 0.05; **p < 0.01.
To determine how ADA treatment at different time points resulted in opposite effects on EAU, we examined the effect of ADA on γδ T cell activation in vivo, IL-17 levels in the serum, and IL-17 production by autoreactive T cells after in vitro stimulation. Our results showed that the enhancing effect of ADA treatment on day 1 was associated with increased γδ T cell activation in the treated mice, with an increase in the percentage of γδ T cells among the CD3+ T cells (10.2 versus 7.4%) and in the percentage of γδ T cells from treated mice that expressed CD44 (80 versus 69%) (Fig. 7C, middle panels). The suppressive effect of ADA treatment on day 8 was associated with decreased γδ T cell activation in the treated mice (Fig. 7C, bottom panels). Measurement of serum IL-17 levels (Fig. 7D) and IL-17 production (Fig. 7E) by in vitro activated autoreactive T cells supported the conclusion that the Th17 response was significantly enhanced by treatment with ADA on day 1 and significantly inhibited by treatment on day 8.
Discussion
We have previously reported that, in EAU, AR agonists enhance Th17 responses, but suppress Th1 autoimmune responses (15–17). To determine how adenosine metabolism regulates Th17 autoimmune responses and whether adenosine-degrading enzymes would reverse the pro-inflammatory effect of AR agonists, we tested the effect of ADA.
Studies have shown that extracellular adenosine damps down excessive inflammatory responses (31–34), ADA reduces extracellular adenosine levels (9; 35) and generates proinflammatory effects (12; 19), and treatment with an ADA inhibitor is immunosuppressive (11; 13; 36). Evidence supporting a proinflammatory effect of ADA includes the observations that in vitro treatment with ADA promotes human and mouse T cell responses (12; 19) and that an ADA inhibitor reduces tissue injury in a mouse model of enteritis (13). Therapeutic use of exogenous ADA has also been applied in bone marrow transplantation and hematopoietic stem cell gene therapy and resulted in suppression of the graft rejection response (9). In the present study, we demonstrated that ADA treatment at day 8–14 post-immunization suppressed development of EAU by inhibiting the Th17 autoimmune response. Our results demonstrate that diseases that preferentially involve Th17 responses are more responsive to ADA treatment.
We have previously reported that the CD25+CD11c+ DC subset has an enhanced stimulating effect on γδ T cells, leading to augmented Th17 response (28; 30; 37). In study of determining possible mechanisms leading to increased activation of the CD25+ DC subset, we were able to show that A2B adenosine receptor ligation is an important promoting factor for activation of the CD25+ CD11c+Gr-1+ DC subset (17; 37). We therefore hypothesize that degradation of adenosine by ADA may restrain differentiation and activation of CD25+ DCs and thereby inhibit autoreactive Th17 responses. However, further investigations on the mechanism by which ADA differentially affects Th1 and Th17 responses are required.
We have previously reported that AR agonists can either inhibit or enhance an autoimmune response, depending on when the agonist was administered, with the suppressive effect prevailing if the agonist is administered before the beginning of inflammatory response and the enhancing effect prevailing if it is administered after inflammatory response is established (15). To determine whether such a time-dependent effect was also seen with ADA treatment, we injected mice with ADA either before the start of inflammation (within a few days after EAU induction; days 0–5) or after the start of inflammatory response (one week after disease induction; days 8–14) and found that the timing was important in determining the effect of ADA treatment, as ADA administration immediately before, or just after, immunization with IRBP1–20 caused exacerbation of EAU. We conclude that, like the effect of adenosine (15), the effect of ADA is dependent on the immune status of the recipient and environmental factors.
The different effects of ADA in different disease models were previously attributed to binding of adenosine to cell type-specific ARs (33; 38–41) and to different concentrations of adenosine produced in the local environment (2–4). It has been suggested (2–4) that extracellularly accumulated adenosine could be either anti-, or proinflammatory. Lower levels of extracellular adenosine are preferentially bound by high-affinity A2ARs, leading to an inhibitory outcome, but, as tissue damage develops and local adenosine levels increase, the binding of adenosine by low-affinity A2BRs that are mainly pro-inflammatory, leads to exacerbation of inflammation and damage (2–4). Such a scenario is supported by this study showing that elimination of adenosine by ADA in the induction phases of the disease generates a pro-inflammatory effect when the existing adenosine is low; but the effect may become anti-inflammatory when the existing adenosine levels are exceedingly high, such as when the disease approaches its peak.
Our previous studies demonstrated that Th17 responses are compromised under conditions in which γδ T cells are functionally defective (15; 16; 24; 30; 42; 43). In the present study, we showed that suppression of EAU by ADA was closely associated with decreased γδ T cell activation, further suggesting that modulation of γδ T cell function might be an effective means of controlling Th17 autoimmune responses. We attempted to address the question of why both ADA and an ADA inhibitor have different effects on Th1 and Th17 responses. Our unpublished results showed that ADA has a suppressive effect on Foxp3+ T cell; conceivably, a low Foxp3+ T cell activity offsets the suppressive effect of ADA on Th1 responses. These results agree with previous reports showing that both adenosine and ADA interfere with regulatory T cell function (35; 44; 45). Because of previous concerns that prolonged ADA treatment is more likely to cause immune dysregulation (4), we looked at the therapeutic effect of a single injection of ADA and found that a single, appropriately timed injection could be effective.
A complete understanding of the functional diversity of adenosine requires further intensive investigations. The knowledge acquired will allow us to design improved therapeutics or combined treatments.
Abbreviations
- ADA
adenosine deaminas
- A2AR
adenosine A2A receptor
- A2BR
adenosine A2B receptor
- AR
adenosine receptor
- EAU
experimental autoimmune uveitis
- EHNA
erythro-9-(2-hydroxy-3-nonyl) adenine
- IRBP
interphotoreceptor retinoid-binding protein
Footnotes
This work was supported by NIH grants EY0022403 and EY018827
References
- 1.Fredholm BB, IJzerman AP, Jacobson KA, Linden J, Müller CE. International Union of Basic and Clinical Pharmacology. LXXXI. Nomenclature and Classification of Adenosine Receptors—An Update. Pharmacol reviews. 2011;63:1–34. doi: 10.1124/pr.110.003285. [DOI] [PMC free article] [PubMed] [Google Scholar]
- 2.Jacobson KA, Gao Z-G. Adenosine receptors as therapeutic targets. Nat Rev Drug Discov. 2006;5:247–264. doi: 10.1038/nrd1983. [DOI] [PMC free article] [PubMed] [Google Scholar]
- 3.Hasko G, Linden J, Cronstein B, Pacher P. Adenosine receptors: therapeutic aspects for inflammatory and immune diseases. Nat Rev Drug Discov. 2008;7:759–770. doi: 10.1038/nrd2638. [DOI] [PMC free article] [PubMed] [Google Scholar]
- 4.Sauer AV, Brigida I, Carriglio N, Aiuti A. Autoimmune dysregulation and purine metabolism in adenosine deaminase (ADA)-deficiency. Front.Immunol. 2012;3:265–275. doi: 10.3389/fimmu.2012.00265. [DOI] [PMC free article] [PubMed] [Google Scholar]
- 5.Chen JF, Eltzschig HK, Fredholm BB. Adenosine receptors as drug targets--what are the challenges? Nat Rev Drug Discov. 2013;12:265–286. doi: 10.1038/nrd3955. [DOI] [PMC free article] [PubMed] [Google Scholar]
- 6.Ibrahim AS, El-shishtawy MM, Zhang W, Caldwell RB, Liou GI. A2A Adenosine Receptor (A2AAR) as a Therapeutic Target in Diabetic Retinopathy. Am.J.Pathol. 2011;178:2136–2145. doi: 10.1016/j.ajpath.2011.01.018. [DOI] [PMC free article] [PubMed] [Google Scholar]
- 7.Junger WG. Immune cell regulation by autocrine purinergic signalling. Nat Rev Immunol. 2011;11:201–212. doi: 10.1038/nri2938. [DOI] [PMC free article] [PubMed] [Google Scholar]
- 8.Franco R, Valenzuela A, Lluis C, Blanco J. Enzymatic and extraenzymatic role of ecto-adenosine deaminase in lymphocytes. Immunol.Rev. 1998;161:27–42. doi: 10.1111/j.1600-065x.1998.tb01569.x. [DOI] [PubMed] [Google Scholar]
- 9.Hershfield MS, Buckley RH, Greenberg ML, Melton AL, Schiff R, Hatem C, Kurtzberg J, Markert ML, Kobayashi RH, Kobayashi AL, Abuchowski A. Treatment of Adenosine Deaminase Deficiency with Polyethylene Glycol-Modified Adenosine Deaminase. New Eng.J.Med. 1987;316:589–596. doi: 10.1056/NEJM198703053161005. [DOI] [PubMed] [Google Scholar]
- 10.Ozsahin H, Arredondo-Vega FX, Santisteban I, Fuhrer H, Tuchschmid P, Jochum W, Aguzzi A, Lederman HM, Fleischman A, Winkelstein JA, Seger RA, Hershfield MS. Adenosine Deaminase Deficiency in Adults. Blood. 1997;89:2849–2855. [PubMed] [Google Scholar]
- 11.Blackburn MR. Too much of a good thing: adenosine overload in adenosine-deaminase-deficient mice. Trends Pharmacol Sci. 2003;24:66–70. doi: 10.1016/S0165-6147(02)00045-7. [DOI] [PubMed] [Google Scholar]
- 12.Ghaemi Oskouie F, Shameli A, Yang A, Desrosiers MD, Mucsi AD, Blackburn MR, Yang Y, Santamaria P, Shi Y. High Levels of Adenosine Deaminase on Dendritic Cells Promote Autoreactive T Cell Activation and Diabetes in Nonobese Diabetic Mice. J.Immunol. 2011;186:6798–6806. doi: 10.4049/jimmunol.1004222. [DOI] [PubMed] [Google Scholar]
- 13.de Araújo Junqueira AFT, Dias AAM, Vale ML, Spilborghs GMGT, Bossa AS, Lima BB, Carvalho AF, Guerrant RL, Ribeiro RA, Brito GA. Adenosine Deaminase Inhibition Prevents Clostridium difficile Toxin A-Induced Enteritis in Mice. Infect.Imm. 2011;79:653–662. doi: 10.1128/IAI.01159-10. [DOI] [PMC free article] [PubMed] [Google Scholar]
- 14.Desrosiers MD, Cembrola KM, Fakir MJ, Stephens LA, Jama FM, Shameli A, Mehal WZ, Santamaria P, Shi Y. Adenosine Deamination Sustains Dendritic Cell Activation in Inflammation. J.Immunol. 2007;179:1884–1892. doi: 10.4049/jimmunol.179.3.1884. [DOI] [PubMed] [Google Scholar]
- 15.Liang D, Zuo A, Shao H, Chen M, Kaplan HJ, Sun D. Anti- or pro-inflammatory effect of an adenosine receptor agonist on the Th17 autoimmune response is inflammatory environmental-dependent. J.Immunol. 2014;193:5498–5505. doi: 10.4049/jimmunol.1401959. [DOI] [PMC free article] [PubMed] [Google Scholar]
- 16.Liang D, Zuo A, Shao H, Chen M, Kaplan HJ, Sun D. Roles of the Adenosine Receptor and CD73 in the Regulatory Effect of γδ T Cells. PLoS ONE. 2014;9:e108932. doi: 10.1371/journal.pone.0108932. [DOI] [PMC free article] [PubMed] [Google Scholar]
- 17.Chen M, Liang D, Zuo A, Shao H, Kaplan HJ, Sun D. An A2B Adenosine Receptor Agonist Promotes Th17 Autoimmune Responses in Experimental Autoimmune Uveitis (EAU) via Dendritic Cell Activation. PLoS ONE. 2015;10:e0132348. doi: 10.1371/journal.pone.0132348. [DOI] [PMC free article] [PubMed] [Google Scholar]
- 18.Martinez-Navio JM, Casanova V, Pacheco R, Naval-Macabuhay I, Climent N, Garcia F, Gatell JM, Mallol J, Gallart T, Lluis C, Franco R. Adenosine deaminase potentiates the generation of effector, memory, and regulatory CD4+ T cells. J.Leuk.Biol. 2011;89:127–136. doi: 10.1189/jlb.1009696. [DOI] [PubMed] [Google Scholar]
- 19.Casanova V, Naval-Macabuhay I, Massanella M, Rodríguez-García M, Blanco J, Gatell JM, García F, Gallart T, Lluis C, Mallol J, Franco R, Climent N, McCormick PJ. Adenosine Deaminase Enhances the Immunogenicity of Human Dendritic Cells from Healthy and HIV-Infected Individuals. PLoS ONE. 2012;7:e51287. doi: 10.1371/journal.pone.0051287. [DOI] [PMC free article] [PubMed] [Google Scholar]
- 20.Shao H, Song L, Sun SL, Kaplan HJ, Sun D. Conversion of monophasic to recurrent autoimmune disease by autoreactive T cell subsets. J.Immunol. 2003;171:5624–5630. doi: 10.4049/jimmunol.171.10.5624. [DOI] [PubMed] [Google Scholar]
- 21.Shao H, Liao T, Ke Y, Shi H, Kaplan HJ, Sun D. Severe chronic experimental autoimmune uveitis (EAU) of the C57BL/6 mouse induced by adoptive transfer of IRBP1-20-specific T cells. Exp Eye Res. 2006;82:323–331. doi: 10.1016/j.exer.2005.07.008. [DOI] [PubMed] [Google Scholar]
- 22.Thurau SR, Chan CC, Nussenblatt RB, Caspi RR. Oral tolerance in a murine model of relapsing experimental autoimmune uveoretinitis (EAU): induction of protective tolerance in primed animals. Clin.Exp.Immunol. 1997;109:370–376. doi: 10.1046/j.1365-2249.1997.4571356.x. [DOI] [PMC free article] [PubMed] [Google Scholar]
- 23.Peng Y, Han G, Shao H, Wang Y, Kaplan HJ, Sun D. Characterization of IL-17+ Interphotoreceptor Retinoid-Binding Protein-Specific T Cells in Experimental Autoimmune Uveitis. Invest.Ophthal.Vis.Sci. 2007;48:4153–4161. doi: 10.1167/iovs.07-0251. [DOI] [PMC free article] [PubMed] [Google Scholar]
- 24.Liang D, Zuo A, Shao H, Born WK, O’Brien RL, Kaplan HJ, Sun D. IL-23 Receptor Expression on γδ T Cells Correlates with Their Enhancing or Suppressive Effects on Autoreactive T Cells in Experimental Autoimmune Uveitis. J.Immunol. 2013;191:1118–1125. doi: 10.4049/jimmunol.1300626. [DOI] [PMC free article] [PubMed] [Google Scholar]
- 25.Zuo A, Liang D, Shao H, Born WK, Kaplan HJ, Sun D. In vivo priming of IL-17+ uveitogenic T cells is enhanced by Toll ligand receptor (TLR)2 and TLR4 agonists via γδ T cell activation. 2012;50:125–133. doi: 10.1016/j.molimm.2011.12.013. [DOI] [PMC free article] [PubMed] [Google Scholar]
- 26.Ullman B, Cohen A, Martin DW., Jr Characterization of a cell culture model for the study of adenosine deaminase- and purine nucleoside phosphorylase-deficient immunologic disease. Cell. 1976;9:205–211. doi: 10.1016/0092-8674(76)90111-2. [DOI] [PubMed] [Google Scholar]
- 27.North TW, Cohen SS. Erythro-9-(2-hydroxy-3-nonyl)adenine as a specific inhibitor of herpes simplex virus replication in the presence and absence of adenosine analogues. Pro.Nat.Acad.Sci.USA. 1978;75:4684–4688. doi: 10.1073/pnas.75.10.4684. [DOI] [PMC free article] [PubMed] [Google Scholar]
- 28.Liang D, Zuo A, Shao H, Born WK, O’Brien RL, Kaplan HJ, Sun D. Retinoic Acid Inhibits CD25+ Dendritic Cell Expansion and γδ T-Cell Activation in Experimental Autoimmune Uveitis. Invest.Ophthal.Vis.Sci. 2013;54:3493–3503. doi: 10.1167/iovs.12-11432. [DOI] [PMC free article] [PubMed] [Google Scholar]
- 29.Nian H, Shao H, O’Brien BA, Born WK, H.J K, Sun D. Activated γδ cells promote the activation of uveitogenic T cells and exacerbate EAU development. Invest.Ophthal.Vis.Sci. 2011;52:5920–5927. doi: 10.1167/iovs.10-6758. [DOI] [PMC free article] [PubMed] [Google Scholar]
- 30.Liang D, Zuo A, Shao H, Born WK, O’Brien RL, Kaplan HJ, Sun D. Role of CD25+ Dendritic Cells in the Generation of Th17 Autoreactive T Cells in Autoimmune Experimental Uveitis. J.Immunol. 2012;188:5785–5791. doi: 10.4049/jimmunol.1200109. [DOI] [PMC free article] [PubMed] [Google Scholar]
- 31.Flogel U, Burghoff S, van Lent PL, Temme S, Galbarz L, Ding Z, El-Tayeb A, Huels S, Bonner F, Borg N, Jacoby C, Muller CE, van den Berg WB, Schrader J. Selective activation of adenosine A2A receptors on immune cells by a CD73-dependent prodrug suppresses joint inflammation in experimental rheumatoid arthritis. Sci Transl Med. 2012;4:146ra108. doi: 10.1126/scitranslmed.3003717. [DOI] [PubMed] [Google Scholar]
- 32.Frick J-S, MacManus CF, Scully M, Glover LE, Eltzschig HK, Colgan SP. Contribution of Adenosine A2B Receptors to Inflammatory Parameters of Experimental Colitis. J.Immunol. 2009;182:4957–4964. doi: 10.4049/jimmunol.0801324. [DOI] [PMC free article] [PubMed] [Google Scholar]
- 33.Ohta A, Sitkovsky M. Role of G-protein-coupled adenosine receptors in downregulation of inflammation and protection from tissue damage. Nature. 2001;414:916–920. doi: 10.1038/414916a. [DOI] [PubMed] [Google Scholar]
- 34.Linden J. Molecular appraoch to adenosine receotrs: Receptor-Mediated Mechanisms of Tissue Protection. Ann.Rev.Pharmacol.Toxicol. 2001;41:775–787. doi: 10.1146/annurev.pharmtox.41.1.775. [DOI] [PubMed] [Google Scholar]
- 35.Mandapathil M, Hilldorfer B, Szczepanski MJ, Czystowska M, Szajnik M, Ren J, Lang S, Jackson EK, Gorelik E, Whiteside TL. Generation and Accumulation of Immunosuppressive Adenosine by Human CD4+CD25highFOXP3+ Regulatory T Cells. The J Biol Chem. 2010;285:7176–7186. doi: 10.1074/jbc.M109.047423. [DOI] [PMC free article] [PubMed] [Google Scholar]
- 36.O’brien WJ, Taylor JL, Brotman SJ. Adenosine deaminase in herpes simplex virus induced corneal stromal disease. Curr Eye Res. 1987;6:13–18. doi: 10.3109/02713688709020062. [DOI] [PubMed] [Google Scholar]
- 37.Liang D, Zuo A, Shao H, Chen M, Kaplan HJ, Sun D. A2B adenosine receptor activation switches differentiation of bone marrow cells to a CD11c+Gr-1+ dendritic cell subset that promotes the Th17 response. Immunity, Infection and Disease. 2015;3:360–373. doi: 10.1002/iid3.74. [DOI] [PMC free article] [PubMed] [Google Scholar]
- 38.Sitkovsky MV, Ohta A. The ‘danger’ sensors that STOP the immune response: the A2 adenosine receptors? Trend.Immunol. 2005;26:299–304. doi: 10.1016/j.it.2005.04.004. [DOI] [PubMed] [Google Scholar]
- 39.Fredholm BB, AP IJ, Jacobson KA, Klotz KN, Linden J. International Union of Pharmacology. XXV. Nomenclature and classification of adenosine receptors. Pharmacol reviews. 2001;53:527–552. [PMC free article] [PubMed] [Google Scholar]
- 40.Hasko G, Csoka B, Nemeth ZH, Vizi ES, Pacher P. A2B adenosine receptors in immunity and inflammation. Trend Immunol. 2009;30:263–270. doi: 10.1016/j.it.2009.04.001. [DOI] [PMC free article] [PubMed] [Google Scholar]
- 41.Kolachala VL, Ruble BK, Vijay-Kumar M, Wang L, Mwangi S, Figler HE, Figler RA, Srinivasan S, Gewirtz AT, Linden J, Merlin D, Sitaraman SV. Blockade of adenosine A2B receptors ameliorates murine colitis. Brit.J.Pharmacol. 2008;155:127–137. doi: 10.1038/bjp.2008.227. [DOI] [PMC free article] [PubMed] [Google Scholar]
- 42.Cui Y, Shao H, Lan C, Nian H, O’Brien RL, Born WK, Kaplan HJ, Sun D. Major Role of γδ T Cells in the Generation of IL-17+ Uveitogenic T Cells. J.Immunol. 2009;183:560–567. doi: 10.4049/jimmunol.0900241. [DOI] [PMC free article] [PubMed] [Google Scholar]
- 43.Nian H, Shao H, Zhang G, Born WK, O’Brien R, Kaplan HJ, Sun D. Regulatory effect of γδ T cells on IL-17+ uveitogenic T cells. Invest.Ophthalmol.Vis.Sci. 2010;51:4661–4667. doi: 10.1167/iovs.09-5045. [DOI] [PMC free article] [PubMed] [Google Scholar]
- 44.Sauer AV, Brigida I, Carriglio N, Hernandez RJ, Scaramuzza S, Clavenna D, Sanvito F, Poliani PL, Gagliani N, Carlucci F, Tabucchi A, Roncarolo MG, Traggiai E, Villa A, Aiuti A. Alterations in the adenosine metabolism and CD39/CD73 adenosinergic machinery cause loss of Treg cell function and autoimmunity in ADA-deficient SCID. Blood. 2012;119:1428–1439. doi: 10.1182/blood-2011-07-366781. [DOI] [PMC free article] [PubMed] [Google Scholar]
- 45.Luning Prak ET. Restoring balance to B cells in ADA deficiency. J.Clin.Invest. 2012;122:1960–1962. doi: 10.1172/JCI63782. [DOI] [PMC free article] [PubMed] [Google Scholar]


