Abstract
Objective
We describe the development, implementation, and evaluation of a model to preemptively select patients for genotyping based on medication exposure risk.
Study Design and Setting
Using de-identified electronic health records (EHR), we derived a prognostic model for the prescription of statins, warfarin, or clopidogrel. The model was implemented into a clinical decision support (CDS) tool to recommend preemptive genotyping for patients exceeding a prescription risk threshold. We evaluated the rule on an independent validation cohort, and on an implementation cohort, representing the population in which the CDS tool was deployed.
Results
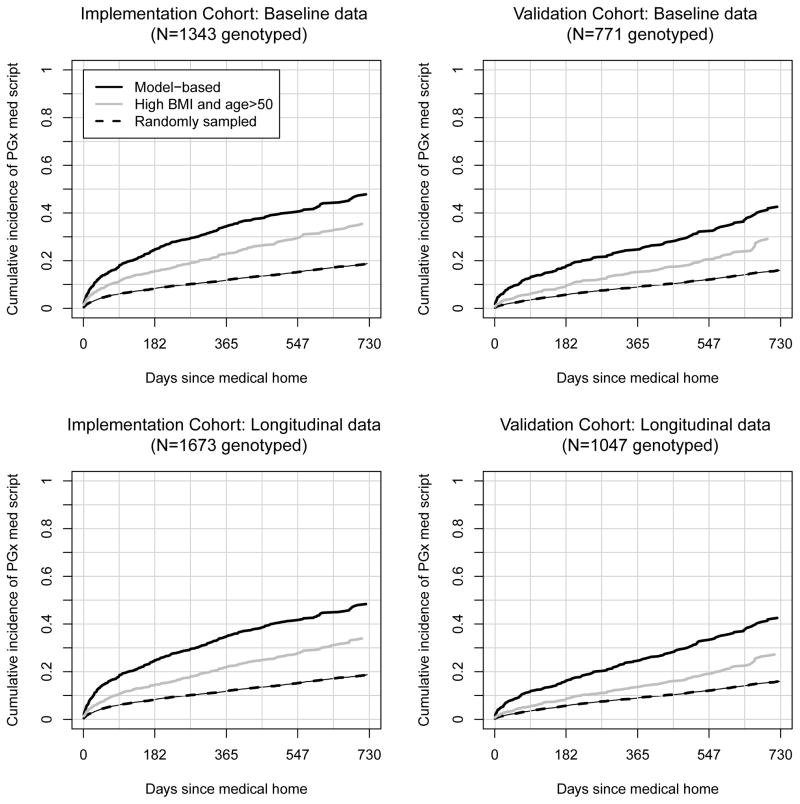
The model exhibited moderate discrimination with area under the receiver operator characteristic curves ranging from 0.68 to 0.75 at one and two years following index dates. Risk estimates tended to underestimate true risk. The cumulative incidences of medication prescriptions at one and two years were 0.35 and 0.48, respectively, among 1673 patients flagged by the model. The cumulative incidences in the same number of randomly sampled subjects were 0.12 and 0.19, and in patients over 50 years with the highest body mass indices, they were 0.22 and 0.34.
Conclusion
We demonstrate that prognostic algorithms can guide preemptive pharmacogenetic testing towards those likely to benefit from it.
Keywords: Clopidogrel, Computer Decision Support, Electronic Health Records, Precision Medicine, Statin, Warfarin
INTRODUCTION
A growing body of literature relates human genetic variation to drug response. Currently, more than 100 drugs have pharmacogenomic (PGx) information that affects prescribing in Food and Drug Administration (FDA) labels 1. Such evidence was the impetus behind Vanderbilt University Medical Center’s Pharmacogenomic Resource for Enhanced Decisions in Care & Treatment (PREDICT) program, a quality improvement initiative utilizing preemptive, panel-based genotyping to deliver genotype-tailored prescribing guidance at the point of care 2.
Previously, we observed the potential for pharmacogenomic testing efficiency gains by using a multiplexed genotyping approach. Such gains are possible due to the sufficiently high fraction of patients prescribed multiple PGx medications 3. In a cohort of 53,000 medical home patients at our institution, we estimated, over a 5 year period, approximately 65% of patients would be prescribed at least one medication with an FDA PGx label, and 40% would be prescribed multiple PGx medications. Presently, the panel-based genotyping platform used for PREDICT covers 184 functional polymorphisms on 34 genes 2, and genetic test results are coupled with computerized decision support (CDS) to guide prescribers toward the genetically-tailored medications 4.
Ideally, patients could be prescribed genetically-tailored therapy without delay. Towards this aim, we sought a predictive model to identify patients likely to be prescribed a therapy that would benefit from preemptively recorded genomic information in the electronic health record (EHR). Our model identified subjects who were at high risk for being prescribed a statin, clopidogrel, or warfarin (medications implemented in PREDICT) over three years. See the Clinical Pharmcogenetics Implementation Consortium5 guidelines and webpage (https://www.pharmgkb.org/page/cpic) for our rationale for choosing these medications. We implemented the model into a CDS tool that alerted physicians if a patient was at high risk for being prescribed one of these medications. In this way, individuals could have genetic information embedded in their EHR before a prescribing event occurs and could be directed towards modified therapy (if necessary) by appropriate CDS. We then examined the model’s performance in two, overlapping validation cohorts by calculating the extent to which the model enriched genotyped patients with those eventually be prescribed one of the medications. In this report, we describe our approach to model construction, some considerations for CDS implementation, and the model’s performance as an initial approach for prospective, personalized medicine.
This work is an initial step towards understanding the challenges, considerations, and potential for using readily available EHR data towards model driven CDS systems that guide patient treatment.
MATERIALS AND METHODS
We developed a predictive model using training data abstracted from EHRs recorded between January 1, 2005 and June 30, 2010. We validated this model in two cohorts of patients establishing longitudinal care between July 1, 2010 and March 31, 2013.
Study Cohorts
Training cohort
We selected patient records from the Vanderbilt Synthetic Derivative (SD) 6 and restricted the analysis to patients who met a definition for Vanderbilt University Medical Center as being their ‘medical home’ (MH) between January 1, 2005 and June 30, 2010, using the definition of having at least three outpatient clinic visits within a two-year timeframe. Eligible clinics included: internal medicine and ten subspecialties: cancer, hematology, hypertension, rheumatology, nephrology, cardiology, diabetes, neurology, nutrition and pulmonary medicine. To be included, we required a patient age, height, and weight to be present in the medical record on or before the MH designation date, as this served as a marker of having a visit outside of the acute care clinic. Patients were also required to have no evidence of statin, warfarin, and clopidogrel prior to the MH date (via either electronic prescribing tools or natural language processing 7) so that the prescriptions represented new therapy decisions within the EHR. Patients were then followed until their last observation prior to June 30, 2010.
Validation and Implementation cohorts
The validation cohort inclusion criteria were identical to the training dataset except that patients must have met MH criteria for the first time between July 1, 2010 and March 31, 2013. Patients were then followed until their last documented clinical encounter prior to March 31, 2013. The implementation cohort inclusion criteria were the same as the validation cohort except at the following clinics: internal medicine, cardiology, hypertension, diabetes, anticoagulation, ophthalmology, nephrology, renal transplant and urology. While several of the clinics between the validation and implementation cohort overlapped, many were different and far more were included in the implementation cohort due to ongoing reorganization of clinic services and PREDICT.
Model construction strategy
We constructed a predictive model based on clinical variables that were readily available in the EHR and coded in a consistent form so it could be easily deployed in a CDS tool. Because follow-up times were variable, we used a Cox proportional hazards regression8 to model the time to a statin, clopidogrel, or warfarin prescription from the MH date, and in so doing, we were able to estimate medication exposure risk in the presence of censoring. We used the following independent variables: age, gender, BMI, and race, weight, height, and chronic medical comorbidities (type 2 diabetes, coronary artery disease, atrial fibrillation, hypertension, atherosclerosis, congestive heart failure, previous blood clot, and dialysis). All comorbidities were determined based on ICD-9 codes prior to the MH date, and two codes instantiated a diagnosis 9. Continuous covariate effects were modeled with restricted cubic splines to capture non-linear relationships. To examine internal validity, we used a non-parametric bootstrap10,11.
Evaluation on validation and implementation datasets
To evaluate model performance, we applied training set model results to baseline data (applied once at each patient’s MH date) and longitudinal data (applied at each clinic visit when covariate data changed) for the validation and implementation sets. Though the training set model was constructed with information available at the MH date (i.e., a static model), the longitudinal data reflect implementation in practice where each encounter represented an opportunity for genotyping. We used a derived, residual time scale to translate the static model results to the dynamic longitudinal data 12,13. See Appendix A.1 for predicted risk calculations from a Cox model and A.2 for residual time scale calculations. Time-dependent, area under the ROC curve, AUROC(t), was used to quantify model discrimination, and model calibration was assessed graphically. Analyses were performed with the R programming language 14, specifically rms() 15 and survivalROC() 16 libraries.
Enrichment of the genotyped population
We examined the extent to which a real-time algorithm enriched genotyped patients with those eventually prescribed a target medication during follow-up. For the baseline validation and implementation data sets, we identified patients that exceeded 40% risk of a target drug prescription within three years. For the longitudinal datasets, we identified patients who exceeded 40% risk at least once within three years from baseline. The 40% risk target was set as the clinical target by the PREDICT team early in the program. We then calculated the cumulative incidence of a medication prescription during the two years following the MH date to estimate time-specific, positive predictive values (PPVs) through two years following the MH date. To capture enrichment, we took the difference between model-based PPVs and PPVs based on 1) random sampling and 2) applying a rule that flags those over 50 years with the highest BMIs. According to the estimated Cox model baseline hazard, 40% risk at three years translates to 16.5% and 28% risk at one and two years, respectively.
RESULTS
Demographic and other characteristics of the training, validation, and implementation cohorts are shown in Table 1. There were a total of 16020 patients in the training dataset and 12794, 18950, and 6647 patients in the validation, implementation, and both validation and implementation datasets, respectively. Importantly, since there was a longer observation period for the training dataset than for the other two datasets, observed follow-up was longer (median = 1182 days versus 361 and 316 days) and the probability of being prescribed a target medication during follow-up was higher (23.6% versus 9.6% and 11.5%). Patients in the training dataset tended to be older (median=51 years) and to have higher rates type 2 diabetes (17.8%), coronary artery disease (CAD; 4.3%), and atherosclerosis (8.1%) at baseline than those in the other two sets; however, they also had a low rate of atrial fibrillation (0.1%), presumably reflecting the fact that patients who had been prescribed warfarin by the time of the MH date were not included in analyses. Disease prevalence in the validation cohorts increased during the observation time as shown in square brackets. For example, in the implementation cohort, we observed 18950 patients at 61847 unique opportunities for genotyping. At baseline (end of follow-up), 8.1% (9.8%) had a Type II diabetes history.
Table 1.
Demographics and Patient Medical History for the Training, Validation and Implementation Datasets. Continuous variables are reported with the 50th (10th, 90th) percentiles and categorical variables are reported with percentages. Values inside square brackets correspond to the longitudinal follow-up data.
| Variable | Training | Validation | Implementation |
|---|---|---|---|
| N | 16020 | 12794 [55344] | 18950 [61847] |
| Baseline Age (years) | 51 (29, 70) | 48 (26, 68) | 46 (26, 69) |
| Male | 37.6 | 38.5 | 36.9 |
| Race | |||
| Black | 13.8 | 11 | 10.5 |
| Other | 3.1 | 4.5 | 4.8 |
| White | 83.2 | 84.5 | 84.7 |
| Baseline BMI (kg/m2) | 28 (21, 39) | 27 (21, 38) | 27 (21, 38) |
| Follow-up (days) | 1182 (148, 1720) | 361 (47, 812) | 316 (23, 774) |
| Diagnostic history | |||
| Type II Diabetes | 17.8 | 10.6 [12.8] | 8.1 [9.8] |
| CAD | 4.3 | 1.3 [2.0] | 2.9 [3.9] |
| Atrial Fibrillation | 0.1 | 1.4 [2.2] | 3.6 [4.5] |
| Hypertension | 32.7 | 26.2 [31.9] | 32.1 [37.3] |
| Atherosclerosis | 8.1 | 2.9 [4.2] | 4.5 [6.1] |
| Congestive Heart Failure | 3.4 | 2.0 [2.5] | 2.4 [3.1] |
| Previous Clot | 1.0 | 1.2 [2.2] | 0.8 [1.2] |
| Dialysis | 0.7 | 0.5 [0.7] | 1.3 [1.5] |
| Prescriptions after medical home date | |||
| Statin | 19.4 | 6.5 | 8.5 |
| Warfarin | 5.0 | 3.6 | 3.7 |
| Clopidogrel | 2.8 | 2.0 | 2.4 |
| Any Medication | 23.4 | 9.6 | 1.5 |
All Kruskal –Wallis tests for differences in continuous variables at baseline and Chi-square tests for differences in categorical variables at baseline were significant at the 0.05 level, and all but gender and previous clot were significant at the 0.001 level.
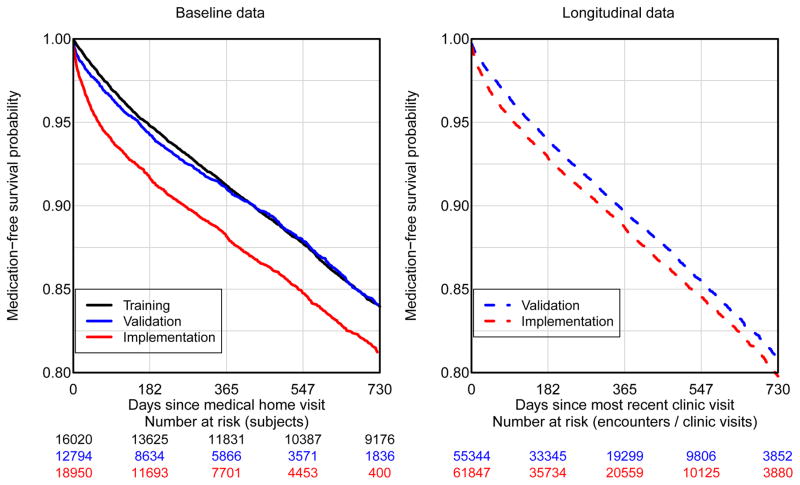
Figure 1 shows the Kaplan-Meier plots using the baseline data for the three cohorts (left panel) and using the longitudinal data for the validation and implementation cohorts (right panel). Overall, the implementation cohort was prescribed medications at a higher rate than the training and validation cohorts, which is likely explained by including proportionately more high-risk clinics (e.g., cardiology). One-year prescription risk estimates were 0.088 (95% CI: 0.083 – 0.093) for the training set, 0.090 (95% CI: 0.084, 0.096) and 0.118 (95% CI: 0.084 – 0.096) for the baseline validation and implementation sets, respectively, and 0.103 (95% CI: 0.100 – 0.107) and 0.113 (95% CI: 0.110 – 0.116) for the longitudinal validation and implementation sets, respectively.
Figure 1.
Medication-free survival: Kaplan-Meier based estimates of medication free survival. The left panel corresponds to baseline data obtained at the medical home date. The right panel corresponds to longitudinal data where the x-axis is the time since last participating clinic visit.
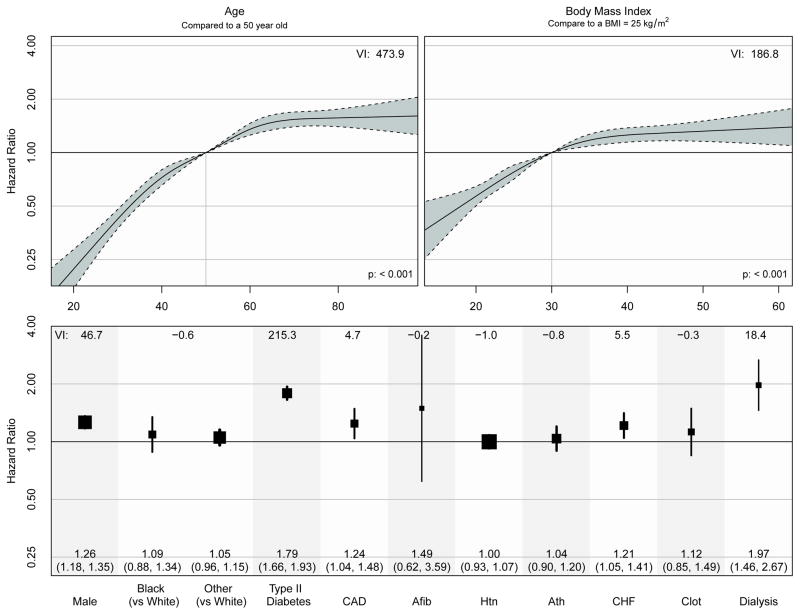
The fitted proportional hazards model from the training dataset is shown in figure 2. Covariate risk factors associated with higher rates of medication prescription included: older age, higher BMI, male gender, and history of type 2 diabetes, CAD, CHF and dialysis. The impact of age and BMI on the rate of medication prescription was clearly non-linear with larger effects at lower ages and BMI and much smaller effects at higher ages and BMI. Figure 2 also shows variable importance (VI) scores that are defined as the likelihood ratio Chi-square statistic minus the degrees of freedom17.
Figure 2.
The Cox proportional hazards model estimates from the training dataset based on data from 2005 to 2010. We include a measure of variable importance (VI) that is defined as the likelihood ratio Chi-square statistic minus the degrees of freedom used to estimate the variable construct.
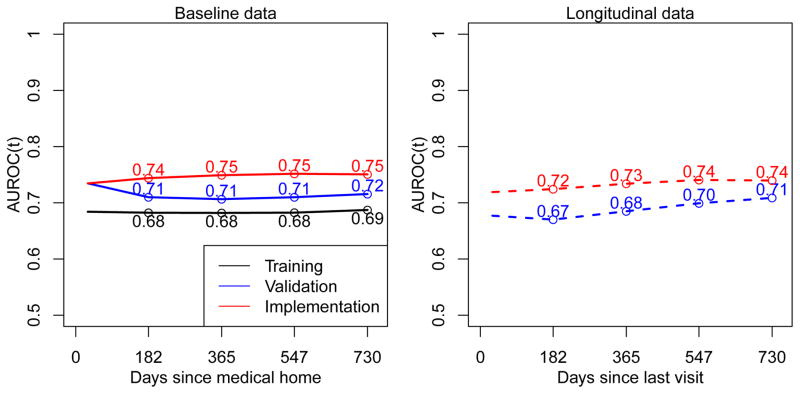
Using a non-parametric bootstrap approach, we observed that the overall AUROC for the training dataset model showed no evidence of model over-fitting with the estimated optimism being 0.01 and the corrected AUROC being 0.67. Applying the results from the training data model to the baseline validation, baseline implementation, longitudinal validation and longitudinal implementation datasets, we estimated AUROCs at the one-year to be 0.71, 0.75, 0.68, and 0.73, respectively. Figure 3 shows AUROCs as a function of the time since the MH date for baseline sets and time since the most recent clinic visit for longitudinal sets. Interestingly, the model constructed from the training dataset ordered subjects’ risk at least as well in the validation and implementation sets as it did in the training set. Thus, for the purposes of discrimination, the model exhibited strong external validity. We speculate on explanations in the Discussion.
Figure 3.
Time-dependent AUROC(t) calculated by applying the training data model to the training dataset across bootstrap replicates (black line), and the training data model to the baseline and longitudinal validation and implementation datasets.
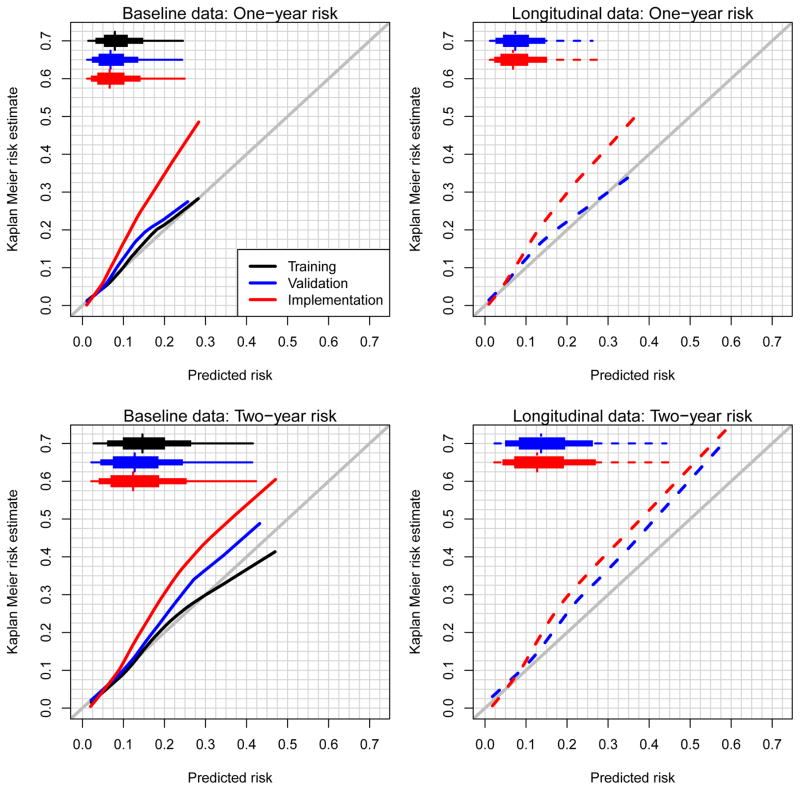
Figure 4 shows the calibration curves for predicting risk at 365 and 730 days from the MH date (baseline data) or the most recent clinic visit (longitudinal data). Using the non-parametric bootstrap on the training dataset model, we observed high internal validity (black lines). One-year model predictions performed reasonably well in the validation cohort; however, they were underestimated severely in the implementation cohort. For two-year risk predictions, the training data model underestimated risks in both the validation and implementation cohorts.
Figure 4.
Calibration plots for one- and two-year risk estimates. Estimates were calculated by applying the training set model to itself across bootstrap replicates and the resulting training set model to the validation and implementation datasets. Modified boxplots highlight the 1st, 10th, 25th, 50th, 75th, 90th, and 99th percentiles of the predicted risk distributions.
For PREDICT, we deployed the training set model to flag those who were estimated to have at least a 40% risk of being prescribed a target medication within three years via CDS at outpatient clinics represented by the implementation set. Figure 5 shows the cumulative incidences of PGx medication prescriptions over the time since the MH date for the model-based rule, for a random sampling rule, and the simple rule of ‘genotype patients who are over 50 years with the highest BMIs’. Using the longitudinal data for implemented PREDICT clinics (lower left panel), 1673 patients were identified for genotyping using the model-based rule. Among those, by one and two years following the MH date, the cumulative incidences for medication prescriptions were 0.35 and 0.48. With random sampling of the same number of patients, the cumulative incidences were 0.12 and 0.19, and flagging the 1673 highest BMIs among those over 50 years of age, yielded cumulative incidences of 0.22 and 0.34. In the absence of censoring we would therefore estimate that the pool of genotyped patients identified by the model would be enriched by 495 (~1673*(0.484-0.188)) and 238 (~1673*(0.484-0.342)) compared to random sampling and the high age/high BMI rule, respectively. It is worth noting that at one year following the MH date, the sensitivity and specificity of the model-based decision rule was estimated to be 0.23 and 0.93, respectively.
Figure 5.
Cumulative proportion of pre-emptively genotyped patients prescribed target medications over time since the medical home date.
Training model portability
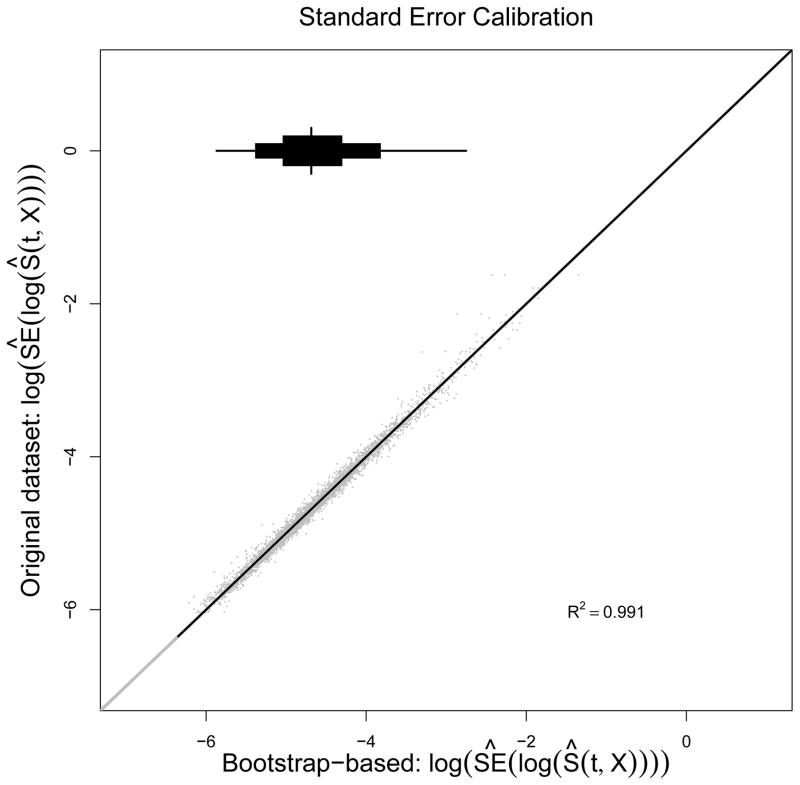
Software packages used for model construction are often different from those used to support CDS tools, and all analyses described here were conducted using the R programming language 18. Using this software, we were able to obtain and port to the implementation team the predicted risk at any timepoint t. However, because CDS does not use R and because the log survivor function, log[S(t;X)], contains non-parametric and parametric components, real-time standard error calculations were not feasible. 19 As a workaround, we fit a linear regression of the estimated value of log[SE{log[S(t;X)]}] on covariates X to obtain an easy to port estimate of standard errors. See Appendix for a description of our approach to validate this model. As can be seen in Figure 6, the model for the standard errors appears to reproduce extremely well with the median R2 across 25 bootstrap replicates being 0.99. We were therefore able to port a simple standard error function that accurately estimates prediction uncertainty in real time.
Figure 6.
Calibration plots for log-estimated standard error of the log-survivor function based on 25 bootstrap replicate. The y-axis shows the log of the estimated standard error from the original dataset, and the x-axis shows the bootstrapped based predictions of those values.
DISCUSSION
We discussed development and implementation of a statistical model within a CDS tool to identify patients likely to receive target medications for prospective genotyping. In comparison to a strategy of randomly selecting patients to genotype, use of the predictive model was estimated to enrich the pool of 1673 patients identified for genotyping by 495 patients over the course of two years (in the absence of censoring). Our model also outperformed a simpler strategy of using an age and BMI cutoff alone. The model ordered patient risk (using AUROC) at least as well in the validation and implementation datasets as it did in the training dataset. Though the training data model was well calibrated to the validation cohort at one year from the MH date (baseline analysis) and at one year from the most recent clinic visit (longitudinal analysis), it underestimated risk in the validation dataset at two years and it severely underestimated risk in the implementation cohort.
We speculate that the increase in AUROCs when applying the training set model to the validation and implementation sets was likely due to either of both of: 1) exposure/covariate data improving over time with less misclassification and measurement error, and 2) physicians unintentionally learning from the CDS tool and being more inclined to prescribed one of the medications once the CDS tool flags a patients for genotyping. We also speculate that the reason for the substantial underestimation of risk in the implementation cohort is due to deployment in specialty clinics where physicians are more inclined to prescribe one of the target medications (e.g., cardiology). We did not collect such clinic information at the outset of this project.
Given increased financial pressures on medicine, movement to a paradigm of predictive medicine may lead to improved outcomes and reduced costs. This project represents not only model development, but also its real-world application within an EHR. While significant efforts have been made with risk prediction models in research settings, few complex models have found their way into the EHR. Pharmacogenomics, genomics, and predictive medicine are enabled by EHRs but will likely also require their advancement 20.
The success of the PREDICT model relies on multiplexed genetic testing. Multiplexed, prospective testing will unnecessarily genotype some people but will also improve the probability that a relevant medication will be prescribed. Reactive single gene testing will miss people who could have benefitted from having their genetic data available in the EHR at the time of prescribing. It also leads to multiple tests being performed when multiple medications are prescribed. Indeed, a recent study within the PREDICT population (which includes patients selected by the prognostic algorithm) calculated that the number of total tests performed was 35% lower in PREDICT than if patients were reactively genotyped on a medication by medication basis 21.
This study has several limitations. We required that patients adhere to our definition of MH and have age, height, and weight information, which could inhibit generalizability of the results. To enable rapid calculation within a real-time EHR, we derived medication exposures and past diagnoses using readily-available EHR data which can suffer from missing information 22 and misclassification 23,24. While a growing body of work with secondary use of EHR data has shown the value of multimodal algorithms to define exposures 25–27, many of these algorithms would not be practical for real-time execution within most EHR systems. Additionally, patients included in these analyses may represent a sicker population due to the requirement of three outpatient clinic visits in a two-year time frame.
The model building and validation approach could have been improved in several ways. For example, we constructed a model for being prescribed one of three target medications that was dominated by statin prescriptions. Fitting separate models for the three indications and then combining risks into a single, weighted risk score to determine whom to genotype is an alternative and more flexible approach. We used baseline data from the training dataset to predict risk in the longitudinal datasets. Risk predictions might have been improved if we had constructed the training model using longitudinal data. We could improve predictions if time trends were captured in the model and if we had used use specialty clinics (e.g., cardiology) as risk factors. We may also be able to improve predictions with more complex models (random forests), though such models may be challenging to implement within EHRs. Finally, it is very likely that the non-informative censoring assumption for the Cox model was violated during model construction; however such violations are likely to be reflected in validation summary measures.
Supplementary Material
Acknowledgments
Funding: This project was funded by Vanderbilt University, the Centers for Disease Control and Prevention (U47CI000824), the National Heart, Lung, And Blood Institute (U01HL122904, U19HL065962, R01HL094786), the National Institute for General Medical Sciences (U19HL065962, RC2GM092318), the National Human Genome Research Institute (U01HG006378), and the National Center for Advancing Translational Sciences (UL1TR000445). The analyses described herein are solely the responsibility of the authors alone and do not necessarily represent official views of the Centers for Disease Control and Prevention or the National Institutes of Health.
Footnotes
Author contributions: JSS, JMP, JFP, WG, DMR, and JCD developed the study concept and design. ID, EB, MB, JRF, and JC acquired data; JSS, YS, and FEH analyzed data and generated tables and figures. All authors contributed to data interpretation. JSS, YS, JFP, and JCD drafted the report, and all authors contributed to the final version.
Competing interests: The authors declare no competing interests related to publication of this paper. Additionally, the funding sources had no role in the study design, the collection, analysis, and interpretation of data, manuscript preparation, or the decision to submit the paper for publication.
Publisher's Disclaimer: This is a PDF file of an unedited manuscript that has been accepted for publication. As a service to our customers we are providing this early version of the manuscript. The manuscript will undergo copyediting, typesetting, and review of the resulting proof before it is published in its final citable form. Please note that during the production process errors may be discovered which could affect the content, and all legal disclaimers that apply to the journal pertain.
References
- 1.Pharmacogenomic Biomarkers in Drug Labels. doi: 10.2217/pgs.13.198. at < http://www.fda.gov/Drugs/ScienceResearch/ResearchAreas/Pharmacogenetics/ucm083378.htm>. [DOI] [PubMed]
- 2.Pulley JM, et al. Operational implementation of prospective genotyping for personalized medicine: the design of the Vanderbilt PREDICT project. Clin Pharmacol Ther. 2012;92:87–95. doi: 10.1038/clpt.2011.371. [DOI] [PMC free article] [PubMed] [Google Scholar]
- 3.Schildcrout JS, et al. Optimizing drug outcomes through pharmacogenetics: a case for preemptive genotyping. Clin Pharmacol Ther. 2012;92:235–242. doi: 10.1038/clpt.2012.66. [DOI] [PMC free article] [PubMed] [Google Scholar]
- 4.Peterson JF, et al. Electronic health record design and implementation for pharmacogenomics: a local perspective. Genet Med Off J Am Coll Med Genet. 2013;15:833–841. doi: 10.1038/gim.2013.109. [DOI] [PMC free article] [PubMed] [Google Scholar]
- 5.Relling MV, Klein TE. CPIC: Clinical Pharmacogenetics Implementation Consortium of the Pharmacogenomics Research Network. Clin Pharmacol Ther. 2011;89:464–467. doi: 10.1038/clpt.2010.279. [DOI] [PMC free article] [PubMed] [Google Scholar]
- 6.Roden DM, et al. Development of a large-scale de-identified DNA biobank to enable personalized medicine. Clin Pharmacol Ther. 2008;84:362–369. doi: 10.1038/clpt.2008.89. [DOI] [PMC free article] [PubMed] [Google Scholar]
- 7.Xu H, et al. MedEx: a medication information extraction system for clinical narratives. J Am Med Inform Assoc JAMIA. 2010;17:19–24. doi: 10.1197/jamia.M3378. [DOI] [PMC free article] [PubMed] [Google Scholar]
- 8.Cox DR. Regression models and life-tables. J R Stat Soc Ser B Methodol. 1972:187–220. [Google Scholar]
- 9.Denny JC, et al. Systematic comparison of phenome-wide association study of electronic medical record data and genome-wide association study data. Nat Biotechnol. 2013;31:1102–1111. doi: 10.1038/nbt.2749. [DOI] [PMC free article] [PubMed] [Google Scholar]
- 10.Efron B. Bootstrap Methods: Another Look at the Jackknife. Ann Stat. 1979;7:1–26. [Google Scholar]
- 11.Efron B. An introduction to the bootstrap. Chapman & Hall; 1993. [Google Scholar]
- 12.Shi M, et al. Replacing time since human immunodeficiency virus infection by marker values in predicting residual time to acquired immunodeficiency syndrome diagnosis. Multicenter AIDS Cohort Study. J Acquir Immune Defic Syndr Hum Retrovirology Off Publ Int Retrovirology Assoc. 1996;12:309–316. doi: 10.1097/00042560-199607000-00013. [DOI] [PubMed] [Google Scholar]
- 13.Zheng Y, Heagerty PJ. Partly conditional survival models for longitudinal data. Biometrics. 2005;61:379–391. doi: 10.1111/j.1541-0420.2005.00323.x. [DOI] [PubMed] [Google Scholar]
- 14.Team, R. C. R: A Language and Environment for Statistical Computing. R Foundation for Statistical Computing; 2013. < http://www.R-project.org/>. [Google Scholar]
- 15.FEH rms: Regression Modeling Strategies. 2013 at < http://CRAN.R-project.org/package=rms>.
- 16.Heagerty PJ, Saha-Chaudhuri packaging by PsurvivalROC: Time-dependent ROC curve estimation from censored survival data. 2013 at < http://CRAN.R-project.org/package=survivalROC>.
- 17.Harrell FE. Regression modeling strategies: with applications to linear models, logistic regression, and survival analysis. Springer; 2001. [Google Scholar]
- 18.R Core Team. R: A language and environment for statistical computing. 2013 at < http://www.R-project.org/>.
- 19.Tsiatis AA. The asymptotic joint distribution of the efficient scores test for the proportional hazards model calculated over time. Biometrika. 1981;68:311–315. [Google Scholar]
- 20.Starren J, Williams MS, Bottinger EP. Crossing the omic chasm: a time for omic ancillary systems. JAMA J Am Med Assoc. 2013;309:1237–1238. doi: 10.1001/jama.2013.1579. [DOI] [PMC free article] [PubMed] [Google Scholar]
- 21.Van Driest SL, et al. Clinically actionable genotypes among 10,000 patients with preemptive pharmacogenomic testing. Clin Pharmacol Ther. 2013 doi: 10.1038/clpt.2013.229. [DOI] [PMC free article] [PubMed] [Google Scholar]
- 22.Wei WQ, et al. Impact of data fragmentation across healthcare centers on the accuracy of a high-throughput clinical phenotyping algorithm for specifying subjects with type 2 diabetes mellitus. J Am Med Inform Assoc JAMIA. 2012;19:219–224. doi: 10.1136/amiajnl-2011-000597. [DOI] [PMC free article] [PubMed] [Google Scholar]
- 23.Benesch C, et al. Inaccuracy of the International Classification of Diseases (ICD-9-CM) in identifying the diagnosis of ischemic cerebrovascular disease. Neurology. 1997;49:660–664. doi: 10.1212/wnl.49.3.660. [DOI] [PubMed] [Google Scholar]
- 24.Li L, Chase HS, Patel CO, Friedman C, Weng C. Comparing ICD9-encoded diagnoses and NLP-processed discharge summaries for clinical trials pre-screening: a case study. AMIA Annu Symp Proc AMIA Symp. 2008:404–8. [PMC free article] [PubMed] [Google Scholar]
- 25.Kho AN, et al. Electronic Medical Records for Genetic Research: Results of the eMERGE Consortium. Sci Transl Med. 2011;3:79re1. doi: 10.1126/scitranslmed.3001807. [DOI] [PMC free article] [PubMed] [Google Scholar]
- 26.Newton KM, et al. Validation of electronic medical record-based phenotyping algorithms: results and lessons learned from the eMERGE network. J Am Med Inform Assoc. 2013;20:e147–e154. doi: 10.1136/amiajnl-2012-000896. [DOI] [PMC free article] [PubMed] [Google Scholar]
- 27.Carroll RJ, et al. Portability of an algorithm to identify rheumatoid arthritis in electronic health records. J Am Med Inform Assoc. 2012;19:e162–e169. doi: 10.1136/amiajnl-2011-000583. [DOI] [PMC free article] [PubMed] [Google Scholar]
Associated Data
This section collects any data citations, data availability statements, or supplementary materials included in this article.


