

Abstract
We report a novel configuration of a two-stage VIPA spectrometer that enables high-throughput sub-GHz spectroscopy at a high finesse (>750). Two etalons with different free spectral range and different dispersion are arranged in orthogonal directions and spread the spectrum in two dimensions with a greatly improved rejection ratio of white-light background noise. A proof-of-concept application for Brillouin spectroscopy is demonstrated.
Ultrahigh-resolution spectrometers with a resolving power better than 1 GHz (0.03 cm−1) are essential for many applications including Brillouin spectroscopy, low-frequency Raman spectroscopy, and comb-resolved analysis1,2. Fabry-Perot (FP) interferometers have been widely used to achieve sub-GHz spectral resolutions3. More recently, angle-dispersed virtually-imaged phased array (VIPA)4 have been introduced to attain similar resolutions with much higher throughput efficiencies5. Both FP and VIPA spectrometers achieve high spectral dispersion through the interference of multiple reflections between either two parallel mirrors, or two interfaces of a solid etalon. An important figure of merit of a spectrometer is the finesse. Finesse, which is defined as the ratio of adjacent fringes and the linewidth, practically expresses the number of resolvable frequency components in a spectrometer and can be computed by the ratio between the frequency range that can be analyzed without ambiguity, termed Free Spectral Range (FSR), and the spectral resolution of the spectrometer. The finesse of a spectrometer using free-space etalons is limited by the reflectivity and flatness of the reflecting surfaces. Practically, it is very difficult to surpass a finesse of 50.
Here, we present a sub-GHz spectrometer based on the principle of cross-axis spectrometry6, but employing etalons of different spectral dispersion. Due to the different FSR of the two orthogonal etalons, the spectral signatures are spread in two dimensions rather than on the conventional single axis. As a result, sub-GHz resolution is achieved together with a finesse greater than 750, an order of magnitude improvement over previously attainable values and more than 10-fold improved rejection of white-light background noise. We demonstrated the advantageous features of such a spectrometer in the context of Brillouin spectroscopy7-11.
A solid VIPA etalon has three different coating areas. The front surface has a highly reflective coating (R1) with a narrow anti-reflection coating strip. The back surface has a partially reflective coating (R2). In order to use the VIPA as a spectrometer, a cylindrical lens is used to focus a light beam onto a tilted VIPA etalon through the narrow anti-reflection coating. Within the etalon, the beam is reflected and split into several sub-components with fixed phase differences. The interference among these components introduces high spectral dispersion, and different frequency components are emitted at different angles. Passing the dispersed beam through another lens spatially separates the different frequency components of the beam in the focal plane of the lens. For higher spectral extinction, a two-stage VIPA spectrometer, where two VIPAs are aligned in orthogonal directions has been developed (Fig. 1)5.
Fig.
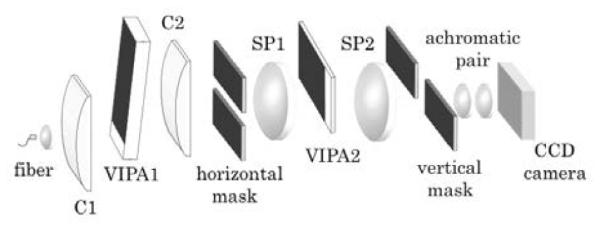
Schematic of two-stage VIPA spectrometer setup. The cylindrical lens C1 (f = 200mm) inputs light into the VIPA (FSR=20GHz, R1=100%; R2=95%). The beam is focused by C2 (f = 200mm) and a spatial mask blocks the undesired frequencies. In the second stage, a spherical lens (f=200mm) inputs light into VIPA2 (FSR=13GHz, R1=100%, R2=95%), aligned in orthogonal direction; another spherical lens (f=200mm) focuses light onto a spatial mask. Finally, an achromatic pair (f = 30mm) images the spectral pattern onto the CCD camera.
Figure 2 illustrates cartoons of typical spectral patterns of a two-stage VIPA spectrometer. In these cartoons the point o represents the position of the laser beam or the unshifted elastic scattering; all other signals are dispersed in the two-dimensional plane due to their frequency shift with respect to the laser. The length of the square represents the value of the FSR in corresponding direction. The two VIPAs disperse incoming light along their spectral axis in sequence, and since the spectral axes of them are orthogonal, the overall spectral axis lies along a diagonal direction. Employing two VIPAs of the same FSR yields a single spectral dispersion axis oo', and the effective FSR is the same as that of single VIPA (Fig. 2a). However, the situation is different if two VIPAs have different FSRs. An example of this situation is shown in Fig. 2b where a spectral signal within the pattern is determined by equations (2a) and (2b) we have taken FSRx/FSRy =2/3. If fCGD is the greatest common divider (GCD) frequency of the two FSRs, we can write FSRx= 2fCGD and FSRy= 3fCGD (in unit of GHz). In this case, the dispersed signal will lie along the spectral axis oa (blue diagonal line). When the frequency shift equals FSRx the signal will be at point a . For frequency shifts higher then FSRx but smaller than FSRy, the dispersed signal will move along spectral axis ab: in fact, the signal falls into next diffraction order of the horizontal VIPA (and it is thus “folded” onto the previous order) but in the same order of the vertical VIPA. For higher frequency shifts, the signal will go through multiple spectral axes until it arrives at point o', where the frequency shift will be a multiple of both FSRx and FSRy. Thus, the effective FSR (Fig.2c) can be understood graphically by unfolding the multiple spectral axes. In the previous example, the effective FSRs will be FSReff = 3FSRx= 2FSRy= 6fCGD (in units of GHz). In general, the effective FSR of this configuration is given by the lowest-common-multiple of the single VIPA’s FSRs:
| (1) |
where fCGD has a value of GCD of FSRx and FSR, and all of the parameters in Eq.(1) have unit of GHz.
Fig. 2.
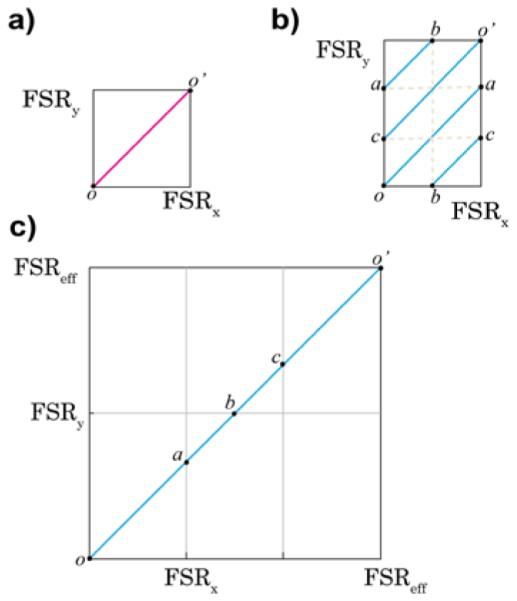
a) Dispersion pattern of conventional two-stage VIPA spectrometer (FSRx/FSRy=1); the spectrum is spread along one axis on the diagonal (pink line). b) If the FSRs are different (e.g. FSRx/FSRy = 2/3), several spectral axes (blue lines) are observed. c) The effective FSR after unfolding the spectral axes is FSReff = 3FSRx = 2FSRy.
Reading the spectrum in the new configuration requires a straightforward calculation: the spatial location (x,y) of a spectral signal within the pattern is determined by equations (2a) and (2b)
| (2a) |
| (2b) |
where ν is the frequency shift, nx and ny are even integers, FSRx and FSRy are the values of the FSR of respective direction, and η is spatial dispersion factor with units of GHz/pixel. Equations (2a) and (2b) can be graphically solved to find the frequency shift ν.
In practice, a much larger range of frequencies can be differentiated because the spectral signatures are located on separate dispersion axes. Without changing the spectral resolution of the spectrometer, the effective FSR is increased significantly. This leads to an effective increase of the overall number of resolvable frequency components without affecting the throughput of the spectrometer.
To illustrate the principle and features of the spectrometer, experimental measurements of Brillouin scattering of several materials were performed using a standard epi-detection Brillouin microscope5. Briefly, a 532-nm single-frequency laser light passed through a neutral density filter and a beam splitter. It was then focused onto the sample via an aspheric lens (focal length 11 mm). The same lens collected the backward scattered light. An objective lens (f = 6 mm) coupled the light into a single mode fiber, which served as confocal pinhole and delivered the light into the VIPA spectrometer. The illumination power at the sample was around 3 mW and typical acquisition times were less than a second. The traditional spectrometer had a FSRx and FSRy of 20 GHz, which resulted in an effective FSR of 20 GHz. The new spectrometer had FSRx of 13 GHz and FSRy of 20 GHz, which resulted in an effective FSR of 260 GHz. This dramatic increase in the effective FSR of the spectrometer was particularly advantageous for Brillouin scattering analysis, where the frequency shift of the Stokes peak is the negative of the Anti-Stokes peak, as shown in Figure 3.
Fig. 3.
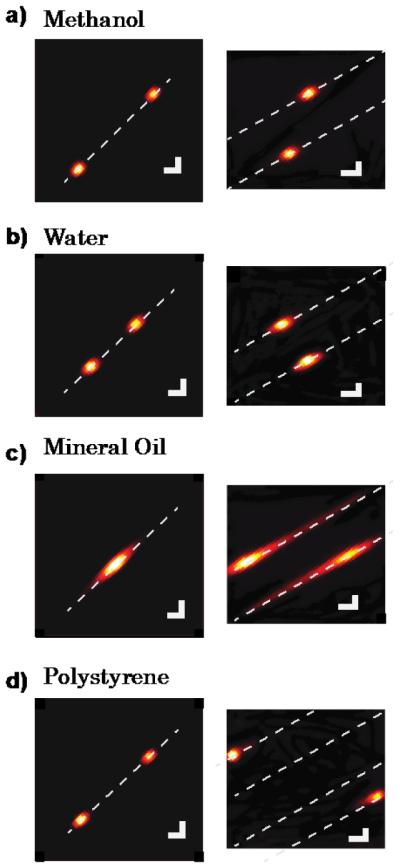
Comparison of the conventional (left panels) vs new spectrometer configuration (right panels) Brillouin spectral patterns are shown for several materials, a) Methanol; b) Water; c) Mineral oil; d) Polystyrene. For illustration purposes we drew a line (white, dashed) to indicate the spectral dispersion axis and enhanced the spectral coloring with a Gaussian low-pass filter. Scale bars, 2 GHz.
The Brillouin spectra of methanol (~5.6 GHz) and water (~7.5 GHz) are shown in Fig. 3a-b. As their Brillouin shift is less than half of the etalon FSR, a standard two-stage spectrometer had no issue in the analysis of their spectra. The situation was different in Figure 3c, where the Brillouin shift of mineral oil (~9.7 GHz) is shown. In the traditional setup, the Stokes and anti-Stokes peaks overlapped, which made it impossible to determine the Brillouin shift of oil with accuracy. Instead, in the new setup, the two peaks were spatially separated within the two-dimensional plane and could be easily resolved.
Figure 3d shows the Brillouin spectrum of Polystyrene (~14.2 GHz). In the traditional setup, the reading of the Polystyrene shift along the single spectral axis was ambiguous as the Brillouin shift is bigger than half of FSR; in the new setup the shift was easily identifiable as the location of the spectral signature within the two-dimensional plane was unique. Due to the expanded effective spectral range of FSReff, a unique position for Brillouin frequency shifts up to FSReff /2, i.e. 130 GHz (the factor of two comes from the existence of Stokes and Anti-Stokes peaks) became possible.
To estimate finesse, we divided the spacing between the laser signatures of adjacent diffraction orders by their linewidth. The traditional spectrometer featured finesse of 30. The new spectrometer featured a finesse of 780, made up by single-stage finesses of 26 and 30. An important consequence of the high spectrometer finesse of great practical value is the superior rejection of noise coming from spectrally-broad sources, such as white light or fluorescence. This is important, because while traditional double-VIPA spectrometer provides sufficient (~60 dB) rejection of laser-related noise sources, they cannot deal with noise sources featuring a broad spectrum. To quantify this improvement, white light was applied from a microscope lamp directly onto the sample. Figure 4a shows two representative images of a Brillouin signal from methanol in the presence of white light noise. By spreading the broad noise source in two dimensions, the background noise was clearly reduced. The drop in background noise level was measured to be 11 dB in the new spectrometer (Fig. 4b). To characterize this feature in terms of signal-to background-ratio (SBR), the intensity of the white light was quantified using a separate camera while blocking the laser. Figure 4c displays the inverse of the SBR versus the intensity of the illumination. The x-axis was normalized to the maximum illumination used, which corresponds to about 75% of the full power of a standard lamp on a bright field microscope. The SBR was determined by dividing the half width integral of the actual signal by its background, where the actual signal is the measured signal minus background. The error bar was estimated by the standard deviation of repeated measurements. The background below the signal was estimated by curve fitting. Since the Brillouin signal remained constant, as expected, we observed a linear behavior of 1/SBR in Fig. 4c.
Fig. 4.

a) CCD images of Brillouin spectral patterns of methanol in the presence of white light background in a traditional two-stage VIPA spectrometer, i.e. same FSR (top) vs our novel configuration featuring etalons of different FSRs (bottom). Scale bars, 2 GHz. b) Brillouin spectrum of methanol in same FSR (blue) vs different FSR (red) configuration. c) Inverse of the signal-to-background ratio vs. illumination shows an improvement in background suppression by a factor of 16. The x-axis is normalized to the maximum illumination used.
Also the increased rejection ratio agreed with expectations. If we look at the upper limit of the background illumination that the spectrometer can handle (SBR=1), it is evident that the new configuration rejects background much more effectively than the conventional spectrometer. Experimentally, a factor of 16 was obtained from the ratio of the slopes from the two curves displayed in Figure 4c. This is about half the value of the single stage finesse. The finesse of the second stages is what determines the signal spread in the opposite directions; the factor of two is due to folding of negative and positive frequency shifts of white light around the Brillouin signal.
In conclusion, we have developed a novel two-stage VIPA spectrometer with etalons of different FSRs which yield a high finesse, greater than 750, and more than 10-fold improved background extinction compared to two-stage VIPA spectrometers with etalons of equal FSR. For Brillouin spectroscopy applications, this novel configuration greatly improves the number of unambiguously resolvable frequency components, allows to perform Brillouin spectral measurements of fluorescent samples and enables the combination with other imaging modalities, such as bright-field or fluorescence microscopy.
Acknowledgements
This work was supported in part by the National Institutes of Health (P41-EB015903, K25EB015885); Human Frontier Science Program (Young Investigator Grant) and the Ministry of Science of Korea, under the “ICT Consilience Creative Program” (IITP-2015-R0346-15-1007).
References (longlist)
- 1.Diddams SA, Hollberg L, Mbele V. Molecular fingerprinting with the resolved modes of a femtosecond laser frequency comb. Nature. 2007;445:627–630. doi: 10.1038/nature05524. [DOI] [PubMed] [Google Scholar]
- 2.Scarcelli G, Yun S. Confocal Brillouin microscopy for three-dimensional mechanical imaging. Nature Photonics. 2008;2:39–43. doi: 10.1038/nphoton.2007.250. [DOI] [PMC free article] [PubMed] [Google Scholar]
- 3.Sandercock JR. Some recent developments in Brillouin scattering. Rca Review. 1975;36:89–107. [Google Scholar]
- 4.Shirasaki M. Large angular dispersion by a virtually imaged phased array and its application to a wavelength demultiplexer. Opt. Lett. 1996;21:366–368. doi: 10.1364/ol.21.000366. [DOI] [PubMed] [Google Scholar]
- 5.Scarcelli G, Yun S. Multistage VIPA etalons for high-extinction parallel Brillouin spectroscopy. Optics Express. 2011;19:10913–10922. doi: 10.1364/OE.19.010913. [DOI] [PMC free article] [PubMed] [Google Scholar]
- 6.Scarcelli G, Kim P, Yun S. Cross-axis cascading of spectral dispersion. Optics Letters. 2008;33:2979–2981. doi: 10.1364/ol.33.002979. [DOI] [PMC free article] [PubMed] [Google Scholar]
- 7.Scarcelli G, Kim P, Yun S. In Vivo Measurement of Age-Related Stiffening in the Crystalline Lens by Brillouin Optical Microscopy. Biophysical Journal. 2011;101:1539–1545. doi: 10.1016/j.bpj.2011.08.008. [DOI] [PMC free article] [PubMed] [Google Scholar]
- 8.Scarcelli G, Besner S, Pineda R, Kalout P, Yun S. In vivo Biomechanical mapping of Normal and Keratoconus Corneas. JAMA ophthalmology. 2015;133:480–482. doi: 10.1001/jamaophthalmol.2014.5641. [DOI] [PMC free article] [PubMed] [Google Scholar]
- 9.Reiss S, Burau G, Stachs O, Guthoff R, Stolz H. Spatially resolved Brillouin spectroscopy to determine the rheological properties of the eye lens. Biomedical Optics Express. 2011;2:2144–2159. doi: 10.1364/BOE.2.002144. [DOI] [PMC free article] [PubMed] [Google Scholar]
- 10.Meng Z, Traverso A, Yakovlev V. Background clean-up in Brillouin microspectroscopy of scattering medium. Optics Express. 2014;22:5410–5415. doi: 10.1364/OE.22.005410. [DOI] [PMC free article] [PubMed] [Google Scholar]
- 11.Antonacci G, Foreman M, Paterson C, Torok P. Spectral broadening in Brillouin imaging. Applied Physics Letters. 2013;103 [Google Scholar]
- 12.Supradeepa V, Huang C, Leaird D, Weiner A. Femtosecond pulse shaping in two dimensions: Towards higher complexity optical waveforms. Optics Express. 2008;16:11878–11887. doi: 10.1364/oe.16.011878. [DOI] [PubMed] [Google Scholar]
- 13.Goda K, Tsia KK, Jalali B. Serial time-encoded amplified imaging for real-time observation of fast dynamic phenomena. Nature. 2009;458:1145–1149. doi: 10.1038/nature07980. [DOI] [PubMed] [Google Scholar]
- 14.Wang C, Ding Z, Mei S, Yu H, Hong W, Yan Y, Shen W. Ultralong-range phase imaging with orthogonal dispersive spectral-domain optical coherence tomography. Optics Letters. 2012;37:4555–4557. doi: 10.1364/OL.37.004555. [DOI] [PubMed] [Google Scholar]