Abstract
Aflatoxin B1 (AFB1) is produced by Aspergillus flavus growing in feedstuffs. Early detection of maize contamination by aflatoxigenic fungi is advantageous since aflatoxins exert adverse health effects. In this study, we report the development of an optimized conventional PCR for AFB1 detection and a rapid, sensitive and simple screening Real-time PCR (qPCR) with SYBR Green and two pairs of primers targeting the aflR genes which involved aflatoxin biosynthesis. AFB1 contaminated maize samples were divided into three groups by the toxin concentration. Genomic DNA was extracted from those samples. The target genes for A. flavus were tested by conventional PCR and the PCR products were analyzed by electrophoresis. A conventional PCR was carried out as nested PCR to verify the gene amplicon sizes. PCR-RFLP patterns, obtained with Hinc II and Pvu II enzyme analysis showed the differences to distinguish aflatoxin-producing fungi. However, they are not quantitative and need a separation of the products on gel and their visualization under UV light. On the other hand, qPCR facilitates the monitoring of the reaction as it progresses. It does not require post-PCR handling, which reduces the risk of cross-contamination and handling errors. It results in a much faster throughout. We found that the optimal primer annealing temperature was 65°C. The optimized template and primer concentration were 1.5 μL (50 ng/μL) and 3 μL (10 μM/μL) respectively. SYBR Green qPCR of four genes demonstrated amplification curves and melting peaks for tub1, afIM, afIR, and afID genes are at 88.0°C, 87.5°C, 83.5°C, and 89.5°C respectively. Consequently, it was found that the four primers had elevated annealing temperatures, nevertheless it is desirable since it enhances the DNA binding specificity of the dye. New qPCR protocol could be employed for the determination of aflatoxin content in feedstuff samples.
Keywords: Polymerase chain reaction, Aflatoxin-producing fungus, Nested PCR, PCR-RFLP, SYBR Green real-time PCR
INTRODUCTION
Thailand is a humid tropical country thus various kinds of food and feedstuffs such as peanuts, maize, rice and other cereals are frequently contaminated with aflatoxins, which are mycotoxin produced by Aspergillus flavus (A. flavus) and Aspergillus parasiticus (A. parasiticus) (1). Aflatoxin B1 (AFB1) is a potent hepatotoxic and hepatocarcinogenic mycotoxin affecting humans and several animal species (2–7). The conventional methods for identifying and detecting fungi in foods and feedstuffs rely on morphological characteristics and the outcomes can be highly variable depending on the media and culture conditions. Furthermore, they are time consuming, labor intensive and require the expertise of mycologists. The disadvantages of highly advanced chemical methods for the analysis of aflatoxins, such as thin-layer chromatography, high performance liquid chromatography, gas liquid chromatography, and gas chromatography/mass spectrometry, include the requirement for highly sophisticated cleanup and/or derivatization procedures. Much simpler and faster immunological methods are available, but they, in turn, have the disadvantage of “one substance-one assay” setup. These methods include the immunoaffinity column chromatography, the radioimmunoassay, and ELISA (8–12). Recently, PCR-based methods have emerged as major tools for detection of aflatoxin-producing fungi in foods (13–15). In this direction, a DNA-based detection method such as PCR, Nested PCR, PCR-RFLP, qPCR are more sensitive, specific and have been employed for the detection of aflatoxigenic fungi. Therefore, the development of an optimized method for detection and identification of aflatoxigenic fungi in foods and feedstuffs is needed for the estimation and neutralization of the associated potential health risks. Accordingly, this research was undertaken to develop an optimized DNA-based conventional PCR for the detection of AFB1 and develop a rapid, sensitive and simple screening qPCR with SYBR Green.
MATERIALS AND METHODS
Preparation of maize samples
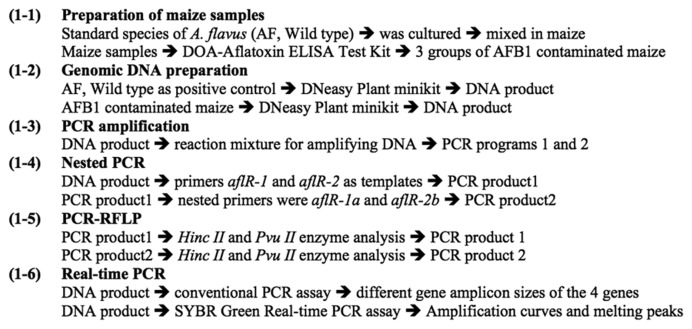
Standard species of A. flavus, which is a local strain obtained from the Department of Agriculture, Ministry of Agriculture and Cooperatives, Thailand (AF, wild type as positive control), was cultured on potato dextrose agar medium for seven days. The cultures were washed in distilled water, mixed with 30% moisture commercial Thai maize and kept in burlap or gunny bags for one to two weeks for AFB1 production (16). The inoculated maize samples were then evaporated and adjusted to 14% moisture. The maize samples were ground and analyzed for AFB1 by ELISA (DOA-Aflatoxin ELISA Test Kit) (17). The AFB1 contaminated maize samples were divided into three groups by the differences between toxin concentration (A, B & C) of 100, 20 and 0 μg/kg, respectively (Fig. 1).
Fig. 1.
Scheme of the experimental protocol.
Genomic DNA preparation and PCR amplification
Genomic DNA, extracted from maize using DNeasy Plant minikit (Geneaid, USA) (Fig. 1) was used for conventional and Real-time PCR. Maize samples contaminated with AFB1 were ground and the extracted fungal DNA was analyzed by electrophoresis on 2% agarose gel with ethidium bromide. The gel image was then documented using UV transilluminator. DNA was stored at −20°C until PCR amplification (18). PCR was performed to amplify the target fragments of aflatoxin-producing and control fungal genes. The reaction mixtures consisted of DNA template, dNTPs, Taq DNA polymerase, forward primer (F), and reverse primer (R). Amplification of the fungal DNA was performed in a total reaction volume of 25 μL and different PCR conditions for optimized PCR reaction (T1–T9), which contained extracted DNA from maize samples (Table 1 and Fig. 1). PCR amplification reactions for PCR programs 1 and 2 of each cycle consisted of pre-denaturation, denaturation, primer annealing, and extension, and followed by final extension. Subsequently, a total of 35 amplification cycles were carried out in a programmable thermocycler (Table 2 and Fig. 1).
Table 1.
The reaction mixture for amplifying DNA extracted from maize samples
| Mixture | Ref. | T1 | T2 | T3 | T4 | T5 | T6 | T7 | T8 | T9 |
|---|---|---|---|---|---|---|---|---|---|---|
| 10xbuffer | 2.5 μL | 2.5 μL | 2.5 μL | 2.5 μL | 2.5 μL | 2.5 μL | 2.5 μL | 2.5 μL | 2.5 μL | 2.5 μL |
| dNTP | 4 μL | 4 μL | 4 μL | 4 μL | 4 μL | 4 μL | 4 μL | 4 μL | 4 μL | 4 μL |
| Primer F | 0.5 μL | 1 μM | 1 μM | 1 μM | 1 μM | 5 μM | 5 μM | 10 μM | 10 μM | 20 μM |
| Primer R | 0.5 μL | 1 μM | 1 μM | 1 μM | 1 μM | 5 μM | 5 μM | 10 μM | 10 μM | 20 μM |
| Taq DNA | 0.5 μL | 0.5 μL | 0.5 μL | 0.5 μL | 0.5 μL | 0.5 μL | 0.5 μL | 0.5 μL | 0.5 μL | 0.5 μL |
| Template | 1 μL | 1 μL | 2 μL | 3 μL | 5 μL | 1 μL | 2 μL | 1 μL | 2 μL | 2 μL |
| Dist.water | 16 μL | 16 μL | 15 μL | 14 μL | 12 μL | 16 μL | 15 μL | 16 μL | 15 μL | 15 μL |
| Total | 25 μL | 25 μL | 25 μL | 25 μL | 25 μL | 25 μL | 25 μL | 25 μL | 25 μL | 25 μL |
Ref., Reference standard; T1–T9, different PCR conditions; Taq DNA, Taq DNA polymerase; Dist. water, Distilled water.
Table 2.
PCR amplification reactions for PCR programs 1 and 2
| PCR cycle | Program 1 | Program 2 |
|---|---|---|
| Pre-denaturation | 95°C, 10 min | 94°C, 5 min |
| Denaturation | 94°C, 30 sec | 94°C, 30 sec |
| Annealing | 50°C, 45 sec | 50°C, 1.25 min |
| Extension | 72°C, 1.15 min | 72°C, 1.40 min |
| Final extension | 72°C, 10 min | 72°C, 10 min |
Nested PCR
The nested PCR amplification was performed in two steps. The first step of PCR amplification was the reaction between primers aflR-1 and aflR-2 (Table 3 and Fig. 1). Then, PCR products from the first step were used as templates for the second step. The nested primers were aflR-1a and aflR-2b with the same reaction conditions as the first step. Electrophoretic analysis of the PCR products 1 and 2 were performed at 100 V for 40 min.
Table 3.
The oligonucleotide primers used for conventional PCR
| No | Primers | Gene | Primer sequence (5′-3′) | Amplicon size (bp) |
|---|---|---|---|---|
| 1 | First PCR |
aflR-1 aflR-2 |
AAC CGC ATC CAC AAT CTC AT AGT GCA GTT CGC TCA GAA CA |
800 bp |
| 2 | Nested PCR |
aflR-1a aflR-2b |
GCA CCC TGT CTC CCC TAA CA ACG ACC ATG CTC AGC AAG TA |
400 bp |
The first primers aflR-1 and aflR-2 and the nested primers aflR-1a and aflR-2b were used.
PCR-RFLP
The PCR products from conventional PCR in this study were subjected to restriction endonuclease Hinc II and Pvu II enzyme analysis to look for RFLP (Fig. 1). The DNA fragment amplified with primers was digested with a restriction enzyme in the buffer recommended by the manufacturer with 20~40 U of enzyme per sample at 37°C for 4 hrs, with 10 μL of PCR product in 50 μL total volume. Electrophoretic analysis of all products was performed at 100 V for 40 min.
Real-time PCR
Real time PCR is a technique used to monitor the progress of a PCR reaction in real time. The procedure was based on SYBR Green Supermix protocol. The target genes for A. flavus, their oligonucleotide primer pairs and their respective amplicon sizes were shown in Table 4 and Figs. 1~6. Specificity of set was tested by conventional PCR before detected by SYBR Green. The PCR product (10 μL) was analyzed by electrophoresis on 2% agarose gel with ethidium bromide and the gel image was documented. A 100 bp size ladder was used as a marker to indicate the size of amplicons in SYBR Green qPCR assay. Evaluation of the optimized annealing template of DNA (1.5 μL and 2.5 μL, different each condition) and primer concentration (1.5 μL and 3 μL, different each condition) was carried out using an iQtm SYBR Green Supermix (BioRad Laboratories, Hercules, CA), according to the manufacturer’s instructions. Amplification reactions were performed with 12.5 μL of SYBR Green Supermix, 1 μL of primers, 1.5 or 2.5 μL of template DNA, 1.5 or 3 μL of primer of each condition and deionized water was used to make up the total volume to 25 μL. The MiniOpticon Real-Time PCR detection system (BioRad Laboratories, Hercules, CA) was performed at 95°C for 10 min followed by 35 cycles of initial denaturation at 94°C for 20 sec, primer annealing of 65°C for 30 sec and primer extension of 72°C for 30 sec with the final holding temperature of 4°C. Fluorescence was measured during the annealing step of each cycle.
Table 4.
The oligonucleotide primer pairs used for SYBR green real-time PCR amplifications
| No | Primer pairs | Gene | Primer sequence (5′-3′) | Annealing temperature |
|---|---|---|---|---|
| 1 |
Tub1-F Tub1-R |
tub1 | GTC CGG TGC TGG TAA CAA CT GGA GGT GGA GTT TCC AAT GA |
65 |
| 2 |
Ver1 Ver2 |
aflM | GCC GCA CGC GGA GAA AGT GGT GGG GAT ATA CTC CCG CGA CAC AGC C |
65 |
| 3 |
aflR 660 aflR 1249 |
aflR | CGC GCT CCC AGT CCC CTT CAT T CTT GTT CCC CGA GAT GAC CA |
59 |
| 4 |
nor1 nor2 |
aflD | ACC GCT ACG CCG GCA CTC TCG GCA C GTT GGC CGC CAG CTT CGA CAC TCC G |
65 |
The oligonucleotide primer pairs were used to target the specific fungal genes: Tub1-F and Tub1-R for tub1; Ver1 and Ver2 for aflM (versicolorin A); aflR 660 and aflR 1249 for aflR; nor1 and nor2 (norsolorinic acid) for aflD.
RESULTS
Genomic DNA preparation from contaminated material and PCR amplification
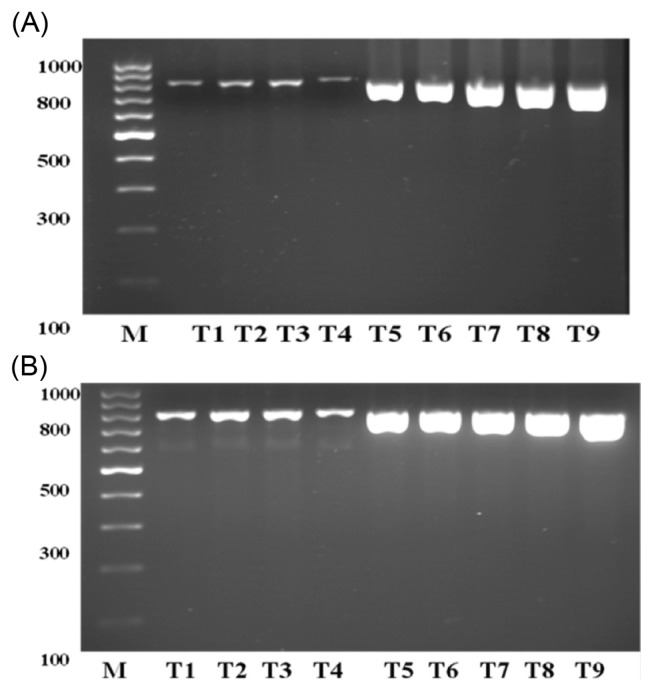
The DNA was assessed and quantified using 2% agarose gel then the good genomic DNA was isolated from all groups (AF, A, B & C). The PCR amplification conditions of programs 1 and 2 were compared based on the electrophoretic banding patterns of PCR products (Table 1 and 2). The optimal PCR conditions in T1–T9 were shown in Fig. 2A and 2B. In this study, the PCR condition of program 2 gave the best results and the PCR conditions T5–T9 can be used as good PCR conditions.
Fig. 2.
Electrophoresis banding pattern after PCR amplification with program 1 (A) and program 2 (B). Lane M, 100 bp DNA ladder standard; T1–T9, different PCR conditions. The amplified DNA fragment sizes (830 bp) were estimated after comparison with a commercial 100 bp DNA ladder. The PCR amplification program 2 gave the best results.
Analysis of fungal genes by nested PCR
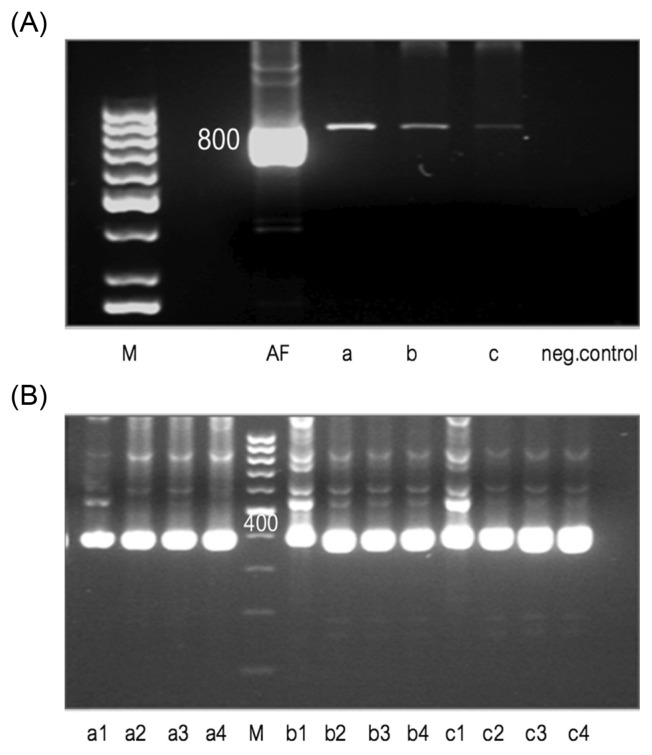
Nested PCR was performed using primers aflR-1a and aflR-2b. The PCR product from amplification with primers aflR-1 and aflR-2 was used as template. Electrophoretic analysis of the PCR products was performed at 100 V for 40 min. The results were shown that the DNA could be detected PCR product 1 from wild type (AF) and group A, B & C (Table 3 and Fig. 3A). Electrophoretic banding patterns of nested PCR products obtained after amplification with primers aflR-1a and aflR-2b are given in Fig. 3B. The sizes of the resulting DNA fragments were estimated after comparing with a commercial 100 bp DNA ladder.
Fig. 3.
Electrophoresis banding pattern of PCR product 1 after amplification with primers aflR-1 and aflR-2 (A) and PCR product 2 after the nested PCR amplification with primers aflR-1a and aflR-2b (B). (A) Lane M, 100 bp DNA ladder standard; AF, positive control; a, b & c, sample groups A, B & C respectively. The amplified DNA fragment sizes (800 bp) were estimated after comparison with a commercial 100 bp DNA ladder. (B) Lane M, 100 bp DNA ladder standard; a1–a4, b1–b4, c1–c4, sample groups A, B & C respectively. The amplified DNA fragment sizes (400 bp) were estimated after comparison with a commercial 100 bp DNA ladder.
PCR-RFLP analysis
Restriction fragment length polymorphism (RFLP) based analysis was a technique used for genotyping. DNA sequence polymorphisms display different migration profiles from wild-type fragment patterns when DNA was digested with restriction fragments in product 1, nested PCR (product 2) and separated by electrophoresis. The DNA fragment sizes were estimated after comparison with a commercial 100 bp DNA ladder.
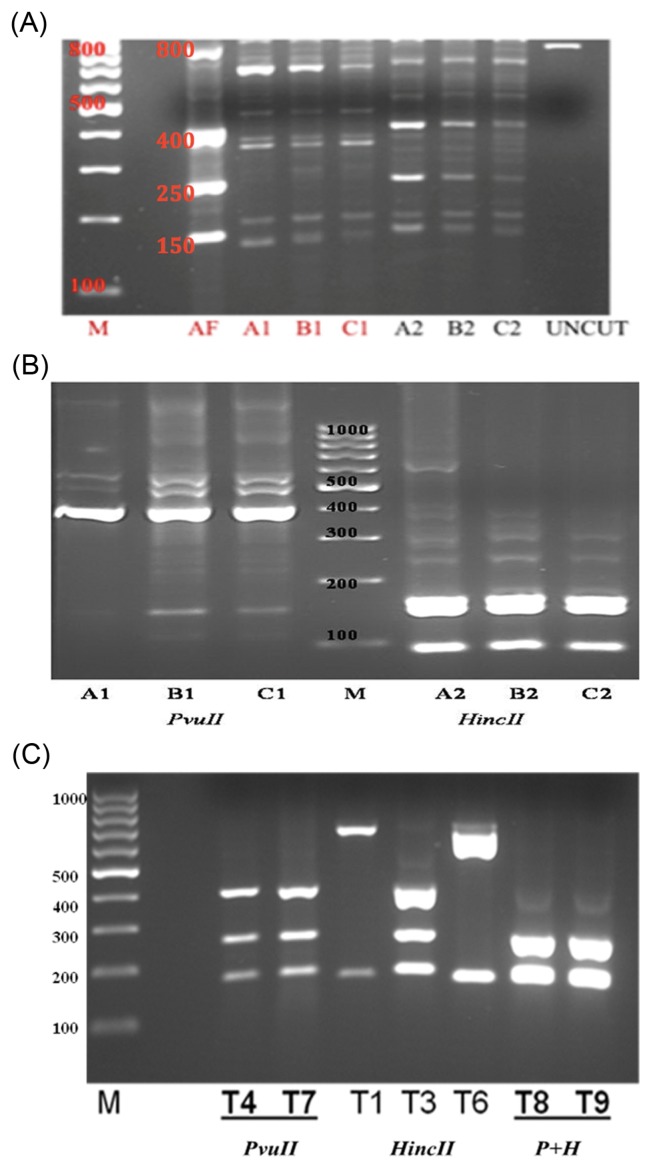
PCR product 1 digestions with Hinc II and Pvu II was performed to enable restriction site distribution analysis, were shown 5 (150, 200, 250, 400, 800 bp) and 4 (150, 200, 380, 700 bp) PCR-based detection, respectively (Fig. 4A). The resulting fragments were separated by electrophoresis from PCR product 2 digestions with Hinc II and Pvu II were shown specific banding of 2 (100, 150 bp) and 3 (100, 150, 400 bp) PCR-based detection, respectively (Fig. 4B). PCR-RFLP patterns obtained with these two enzymes showed adequate differences to distinguish the aflatoxin-producing fungus from controls. The conditions for double digestion reactions were essentially the same for both enzymes, except that 20 units of Hinc II and 40 units of Pvu II were used in 2 × concentrated buffer, T8 and T9 (Fig. 4C). The sizes of the resulting DNA fragments were estimated after comparing with a commercial 100 bp DNA ladder.
Fig. 4.
Electrophoresis banding pattern after PCR product 1 (A), PCR product 2 (B) and double (C) digestions with Hinc II and Pvu II. (A) Lane M, 100 bp DNA ladder standard; AF, positive control (4 PCR-based detection); A1, B1 & C1, products of digestion with Pvu II (4 PCR-based detection); A2, B2 & C2, products of digestion with Hinc II (5 PCR-based detection); UNCUT, native PCR product. (B) Lane M, 100 bp DNA ladder standard; A1, B1 & C1, products of digestion with Pvu II (3 PCR-based detection); A2, B2 & C2, products of digestion with Hinc II (2 PCR-based detection). (C) Lane M, 100 bp DNA ladder standard; T4 & T7, products of digestion with Pvu II; T1, T3 & T6, products of digestion with Hinc II. The digestion conditions were essentially the same as for single digests, except that 20 units of Hinc II and 40 units of Pvu II were used in 2 × concentrated buffer, T8 and T9 (2 PCR-based detection).
Real-time PCR (qPCR) analysis
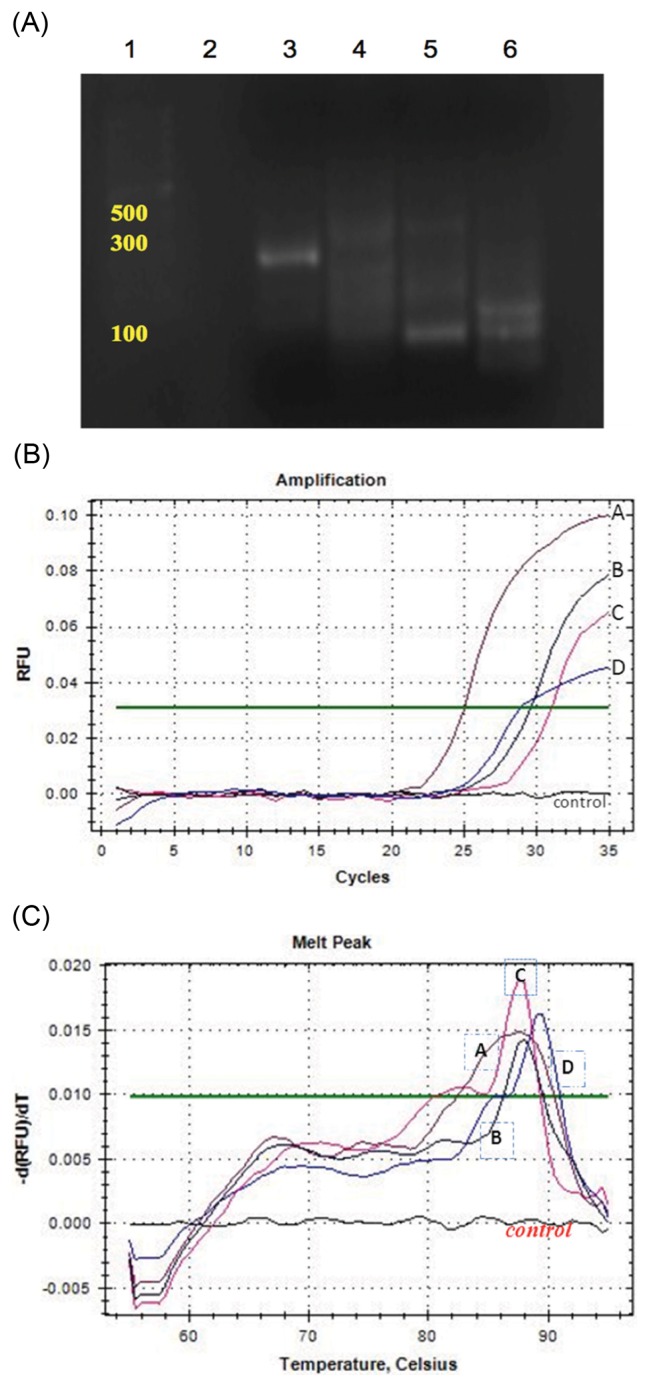
Sample DNA concentrations were determined using Genesys 10 series spectrophotometer (Thermo Fisher Scientific). The purity of the extracted DNA was between 1.6 and 1.9. The samples were then diluted to a final DNA concentration of 50 ng/μL. The target genes for A. flavus, the specific oligonucleotide primer pairs, and their respective amplicon sizes are shown in Table 4. Primer set specificity was tested by conventional PCR, which was carried out to assess the different gene amplicon sizes (Fig. 5A). PCR products (about 10 μL) were analyzed by electrophoresis on 2% agarose gel with ethidium bromide, and the gel image was then documented. A commercial 100 bp DNA ladder was used as a marker to determine the amplicon sizes. Evaluation of the optimal volume of the annealing DNA template (1.5 μL or 2.5 μL) and optimal primer concentrations (1.5 μL or 3 μL) was carried out using iQtm SYBR Green Supermix (BioRad Laboratories, Hercules, CA), according to the manufacturer’s instructions. Amplification reactions were performed with 12.5 μL SYBR Green Supermix, 1 μL primers, 1.5 or 2.5 μL template DNA, 1.5 or 3 μL primers for each condition, and deionized water added to a final volume of 25 μL. MiniOpticon Real-Time PCR detection system (BioRad Laboratories, Hercules, CA) was used and the PCR reaction was performed at 95°C for 10 min, followed by 35 cycles of initial denaturation at 94°C for 20 sec, primer annealing of 65°C for 30 sec, and primer extension of 72°C for 30 sec, with the final holding temperature of 4°C. Fluorescence was measured during the annealing step of each cycle. The aflatoxin regulatory gene (aflR) was involved in the regulation of aflatoxin biosynthesis and the gene sequence has been published (19). We herein adapted and validated a Real-time PCR procedure based on the SYBR Green protocol with two primer pairs that targeted the aflR genes. We found that the optimal annealing primer temperature was 65°C. SYBR Green Real-time PCR for the quantification of the four genes gave reproducible amplification curves. The melting curves for the individual genes are given in Fig. 5B and 5C. The melting peak temperature for tub1 was 88.0°C, 87.5°C for aflM, 83.5°C for aflR, and 89.5°C for aflD, respectively.
Fig. 5.
Electrophoresis banding patterns of the amplified gene products after electrophoresis on 2% agarose gel (A), amplification curves (B) and melting peaks (C) for the four genes, (tub1, aflM, aflR, and aflD) after Real-time PCR with SYBR Green. (A) Lane 1, 100 bp DNA ladder standard; Lane 2, no template; Lane 3, tub1 (the fungal β-tubulin gene as a positive fungal control); Lane 4, aflM; Lane 5, aflR; Lane 6, aflD. Primer set specificity was tested by conventional PCR before detected by SYBR Green. (B,C) A, aflM; B, tub1 (positive control); C, aflR; D, aflD and control, no template as negative control.
DISCUSSION
Early detection of contamination of maize by aflatoxigenic fungi is extremely useful because aflatoxins exert adverse health effects (20). In this report, we developed highly specific methods that allow the detection of A. flavus in Thai maize samples. Conventional PCR was carried out as nested PCR to describe the gene amplicon size of all 4 groups (Fig. 3A, 3B and Table 3). PCR-RFLP patterns obtained with these two enzymes showed sufficient differences to distinguish aflatoxin-producing fungi, that patterns might show the genetic similarly among the other groups of this section (Fig. 4A, 4B and 4C). We found that, there are several limitations in conventional PCR assays. For example, they are not quantitative and need a separation of the products on gel and their visualization under UV light. Real-time PCR is a technique used to monitor the progress of a PCR reaction in real time. It can be used to quantify a relatively small amount of a PCR product obtained from DNA, cDNA or RNA templates. Real-time PCR is based on the detection of fluorescence of a reporter molecule, which increases as the reaction proceeds. This increase in the fluorescent signal occurs due to the accumulation of the PCR product with each amplification cycle. Fluorescent reporter molecules include dyes that bind to the double-stranded DNA (i.e. SYBR® Green). Real-time PCR facilitates the monitoring of a reaction as it progresses (21). It does not require post-PCR handling, which reduces the risk of cross-contamination and handling errors. These features result in a much higher throughout than other detection methods (22).
The present study was designed to optimize the detection of aflatoxin-producing fungi in maize. The detection of the amplified template was accomplished with SYBR Green. This revealed that the four primers had a high annealing temperature. This high annealing temperature is desirable because it enhances DNA dye binding specificity, prevents inhibition and primer-dimer formation (23). The amplification of the PCR product is detected by monitoring the fluorescence of non-specific stains, such as SYBR Green, which bind double stranded DNA (24). The melting profile of the PCR products is then checked at the end of the reaction to verify the specificity of the amplification reaction (25). We optimized the Nested PCR, PCR-RFLP and Realtime PCR assays for the detection of the aflatoxin-producing fungi in Thai maize. We developed highly specific methods that allow the detection of aflatoxigenic fungi species, i.e., A. flavus in sample maize feedstuffs. In addition, we developed and optimized a Real-time PCR assay with SYBR Green (Table 4, Fig. 5A, 5B and 5C). The key steps of the PCR reaction optimization included the adjustment of primer and template concentrations, and the reaction performance with the annealing temperature of 65°C. We found that the optimal template concentration was 1.5 μL (50 ng/μL) and the optimal primer concentration was 3 μL (10 μM/μL), respectively.
The PCR methods outlined in this study may play an important role in the future quality and safety procedures in the food and feed industry.
ACKNOWLEDGEMENTS
The authors wish to express our appreciation to Research and Development Center for Livestock Production Technology, Faculty of Veterinary Science, Chulalongkorn University for graciously providing funds.
Abbreviations
- AFB1
aflatoxin B1
- PCR
Polymerase chain reaction
- PCR-RFLP
Polymerase chain reaction-restriction fragment length polymorphism
- qPCR
Real-time polymerase chain reaction
- SYBR Green
Syber Green
- DNA
Deoxy-nucleic acid
- UV light
Ultra-violet light
- A. flavus
Aspergillus flavus
- A. parasiticus
Aspergillus parasiticus
- ELISA
Enzyme-linked immunosorbent assay
REFERENCES
- 1.Yoshizawa T, Yamashita A, Chokethaworn N. Occurrence of fumonisins and aflatoxins in corn from Thailand. Food Addit Contam. 1996;13:163–168. doi: 10.1080/02652039609374394. [DOI] [PubMed] [Google Scholar]
- 2.Bhat RV. Aflatoxin: successes and failures of three decades of research in Fungi and Mycotoxins in Stored Products. In: Champ BR, Highley E, Hocking AD, Pitt JI, editors. ACIAR Proc. Vol. 36. 1991. pp. 80–85. [Google Scholar]
- 3.Norred WP. In: Occurrence and clinical manifestations of aflatoxicosis in Diagnosis of Mycotoxicosis. Richard JL, Thurston JR, editors. Martinus Nijhoff; Dordrecht: 1986. pp. 11–29. [Google Scholar]
- 4.Pitt JL, Hocking AD. Fungi and food spoilage. Academic Press; Australia: 1985. pp. 259–311. [Google Scholar]
- 5.Bintvihok A, Kiatipattanasakul W, Doi K. Acute toxicity of aflatoxin B1 in three species of domestic fowls. J Toxicol Pathol. 1997;10:149–152. doi: 10.1293/tox.10.149. [DOI] [Google Scholar]
- 6.Bintvihok A, Shoya S, Nagasawa S, Sato M, Sutherat S. Effects of aflatoxin B1 in ducklings: effect on liver lesions in Fungi and Mycotoxins in Stored Products. In: Champ BR, Highley E, Hocking AD, Pitt JI, editors. ACIAR Proc. Vol. 36. 1991. pp. 233–235. [Google Scholar]
- 7.Bintvihok A, Nagasawa S, Hayashi M. Effects of aflatoxin B1 in ducklings: effect on hepatic microsomal drug metabolizing enzyme in Fungi and Mycotoxins in Stored Products. In: Champ BR, Highley E, Hocking AD, Pitt JI, editors. ACIAR Proc. Vol. 36. 1991. pp. 230–232. [Google Scholar]
- 8.Pitt JL, Hocking AD, Glenn DR. An improved medium for the detection of Aspergillus flavus and A. parasiticus. J Appl Bacteriol. 1983;54:109–114. doi: 10.1111/j.1365-2672.1983.tb01307.x. [DOI] [PubMed] [Google Scholar]
- 9.Sugano K, Bintvihok A, Thanacharoenwatch P, Sookthinthai L, Intraraksa R. Simple and rapid cleanup method for determination of aflatoxin B1 in mixed feed by sep-pak florisil cartridge. Proc Jpn Assoc Mycotoxicol. 1993;37:43–45. doi: 10.2520/myco1975.1993.43. [DOI] [Google Scholar]
- 10.Chu FS, Fan TS, Zhang GS, Xu YC, Faust S, McMahon PL. Improved enzyme-linked immunosorbent assay for aflatoxin B1 in agricultural commodities. J Assoc Off Anal Chem. 1987;70:854–857. [PubMed] [Google Scholar]
- 11.Hirano K, Adachi Y, Bintvihok A, Ishibashi S, Kumazawa NH. An improved method for extraction and cleanup of aflatoxin B1 from liver. J Vet Med Sci. 1992;54:567–569. doi: 10.1292/jvms.54.567. [DOI] [PubMed] [Google Scholar]
- 12.Hirano K, Adachi Y, Ishibashi S, Sueyoshi M, Bintvihok A, Kumazawa NH. Detection of aflatoxin B1 in plasma of fowl receiving feed naturally contaminated with aflatoxin B1. J Vet Med Sci. 1991;53:1083–1085. doi: 10.1292/jvms.53.1083. [DOI] [PubMed] [Google Scholar]
- 13.Shapira R, Paster N, Eyal O, Menasherov M, Matt A, Salomon R. Determination of aflatoxigenic molds in grains by PCR. Appl Environ Microbiol. 1996;62:3270–3273. doi: 10.1128/aem.62.9.3270-3273.1996. [DOI] [PMC free article] [PubMed] [Google Scholar]
- 14.Levin RE. PCR detection of aflatoxin producing fungi and its limitations. Int J Food Microbiol. 2012;156:1–6. doi: 10.1016/j.ijfoodmicro.2012.03.001. [DOI] [PubMed] [Google Scholar]
- 15.Rodriguez A, Rodríguez M, Luque MI, Martin A, Córdiba JJ. Real-time PCR assays for detection and quantification of aflatoxin-producing molds in foods. Food Microbiol. 2012;31:89–99. doi: 10.1016/j.fm.2012.02.009. [DOI] [PubMed] [Google Scholar]
- 16.Bintvihok A, Thiengnin S, Patchimasiri T, Thummabood S, Shoya S, Ogura Y, Kumagai S, Doi K. Toxic effects of dietary aflatoxin and its residue in tissues and eggs in laying quails. Proc. the 11th Int. Symposium of the World Association of Veterinary Food Hygienists (WAVFH); 1993. pp. 299–307. [Google Scholar]
- 17.Chinaphuti A, Trikarunasawat C, Wongurai A, Kositcharoenkul S. Production of in-house ELISA test kit for detection of aflatoxin in agricultural commodities and their validations. Kasetsart J Nat Sci. 2002;36:179–186. [Google Scholar]
- 18.Bintvihok A, Treebonmuang S, Patthanachai K, Srisakwattana K, Nuanchuen W, Usawang S. Evaluation of aflatoxin in maize samples feedstuffs by real-time PCR using SYBR Green. Buffalo J. 2013;29:45–49. [Google Scholar]
- 19.Somashekar D, Rati ER, Chandrashekar A. PCR-restriction fragment length analysis of aflR gene for differentiation and detection of Aspergillus flavus and Aspergillus parasiticus in maize. Int J Food Microbiol. 2004;93:101–107. doi: 10.1016/j.ijfoodmicro.2003.10.011. [DOI] [PubMed] [Google Scholar]
- 20.Konietzny U, Greiner R. The application of PCR in the detection of mycotoxigenic fungi in foods. Braz J Microbiol. 2003;34:283–300. doi: 10.1590/S1517-83822003000400001. [DOI] [Google Scholar]
- 21.Anbazhagan D, Mui WS, Mansor M, Yan GO, Yusof MY, Sekaran SD. Development of conventional and real-time multiplex PCR assays for the detection of nosocomial pathogens. Braz J Microbiol. 2011;42:448–458. doi: 10.1590/S1517-83822011000200006. [DOI] [PMC free article] [PubMed] [Google Scholar]
- 22.Heid CA, Stevens J, Livak KJ, Williams PM. Real time quantitative PCR. Genome Res. 1996;6:986–994. doi: 10.1101/gr.6.10.986. [DOI] [PubMed] [Google Scholar]
- 23.Fittipaldi M, Codony F, Morato J. Comparison of conventional culture and real-time quantitative PCR using SYBR Green for detection of Legionella pneumophila in water samples. 2010 Available From: http://www.wrc.org.za.
- 24.Morrison TB, Weis JJ, Wittwer CT. Quantification of low-copy transcripts by continuous SYBR Green I monitoring during amplification. Biotechniques. 1998;24:954–958. [PubMed] [Google Scholar]
- 25.Ririe KM, Rasmusses RP, Wittwer CT. Product differentiation by analysis of DNA melting curves during the polymerase chain reaction. Anal Biochem. 1997;245:154–160. doi: 10.1006/abio.1996.9916. [DOI] [PubMed] [Google Scholar]


