
Extended Data Figure 9. BMA activity and function in anxiety and fear paradigms.
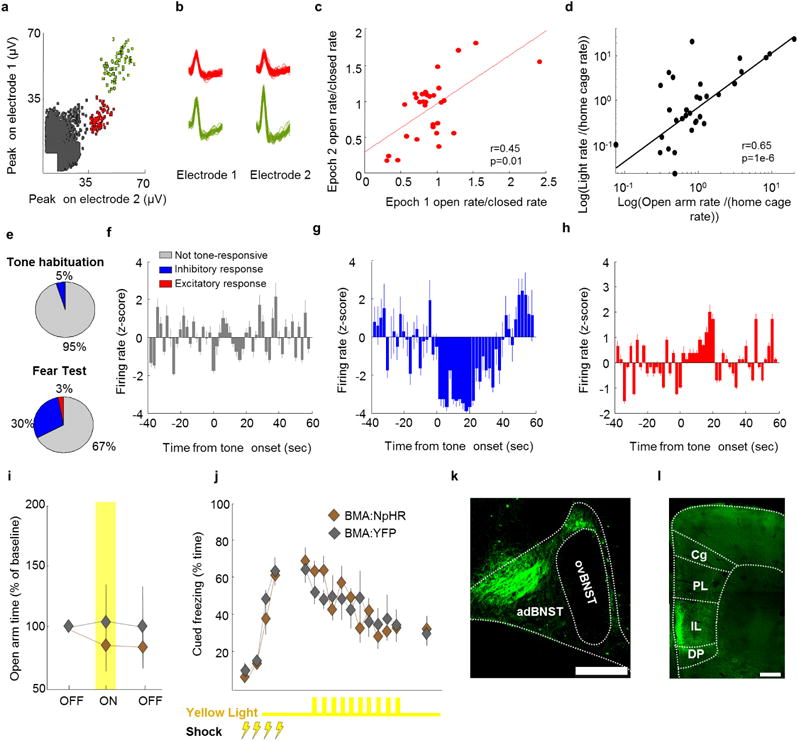
a, Example isolated BMA single-unit spike clusters recorded with stereotrodes in vivo. b, Waveforms of the single-unit clusters shown in a, as recorded on each of the two electrodes comprising the stereotrode. c, Ratios of BMA neuron open arm/closed arm firing rates are shown for minutes 1 to 10 (epoch 1) and minutes 10 to 20 (epoch 2) of a 20 min exploration session of the elevated plus maze (EPM). Open/closed firing rate ratios are highly correlated across both epochs (r = 0.45, Spearman correlation), indicating that BMA firing patterns were stable throughout the entire 20 min session. d, The same cells shown in c were also recorded in the home cage and in the light/dark test. Firing rates in the light compartment of the light/dark test and the open arms of the EPM (plotted as fold-increase of rates from the non-anxiogenic home cage) were highly correlated (r = 0.65, Spearman correlation), indicating that BMA neurons respond similarly to anxiety induced by two different anxiogenic stimuli (bright lights and open areas). n = 38 cells from n = 4 mice (a–d). e–h, Recordings were obtained from basomedial amygdala (BMA) cells during presentation of a fear conditioned auditory tone. e, Top, distribution of responsive cells to the auditory tone before fear conditioning. Bottom, same as in upper panel, but for a fear recall test. The proportion of responsive cells increased following fear conditioning. Note that the vast majority of tone-responsive cells showed decreases in firing rate during the presentation of the fear-conditioned tone. f, Example cell that was not tone-responsive. g, h, Example cells that are inhibited (g) or excited (h) during tone presentation. e, n = 20 cells during habituation and 71 cells during fear recall. f–h, Data are an average of ten tone presentations for each of the three cells shown. n = 4 mice (a–h). i, Mice were injected with AAV5-CamK2α -NpHR-YFP in the BMA. i, j, Yellow light didn’t change behaviour in the elevated plus maze (i), or cued fear extinction (j). n = 8 BMA:NpHR and 7 BMA:YFP mice (i, j). k, Eight weeks after viral injections BMA projections can be seen in BMA:YFP mice in the anterodorsal bed nucleus of the stria terminalis (adBNST) but not in the oval BNST (ovBNST). l, Prominent BMA innervation was also visible in the infralimbic cortex (IL), but not in the prelimbic (PL), dorsal peduncular (DP) or cingulate cortices (Cg). Images from one representative mouse chosen from n = 9 BMA:YFP mice. Scale bars, 250 μm (a, b); 500 μm (k, l). Error bars, ± s.e.m.; n refers to biological replicates.