Abstract
The origin of eukaryotes stands as a major conundrum in biology1. Current evidence indicates that the Last Eukaryotic Common Ancestor (LECA) already possessed many eukaryotic hallmarks, including a complex subcellular organization1–3. In addition, the lack of evolutionary intermediates challenges the elucidation of the relative order of emergence of eukaryotic traits. Mitochondria are ubiquitous organelles derived from an alpha-proteobacterial endosymbiont4. Different hypotheses disagree on whether mitochondria were acquired early or late during eukaryogenesis5. Similarly, the nature and complexity of the receiving host are debated, with models ranging from a simple prokaryotic host to an already complex proto-eukaryote1,3,6,7. Most competing scenarios can be roughly grouped into either mito-early, which consider the driving force of eukaryogenesis to be mitochondrial endosymbiosis into a simple host, or mito-late, which postulate that a significant complexity predated mitochondrial endosymbiosis3. Here we provide evidence for late mitochondrial endosymbiosis. We used phylogenomics to directly test whether proto-mitochondrial proteins were acquired earlier or later than other LECA proteins. We found that LECA protein families of alpha-proteobacterial ancestry and of mitochondrial localization show the shortest phylogenetic distances to their closest prokaryotic relatives, when compared to proteins of different prokaryotic origin or cellular localization. Altogether, our results shed new light on a long-standing question and provide compelling support for the late acquisition of mitochondria into a host that already had a proteome of chimeric phylogenetic origin. We argue that mitochondrial endosymbiosis was one of the ultimate steps in eukaryogenesis and that it provided the definitive selective advantage to mitochondria-bearing eukaryotes over less complex forms.
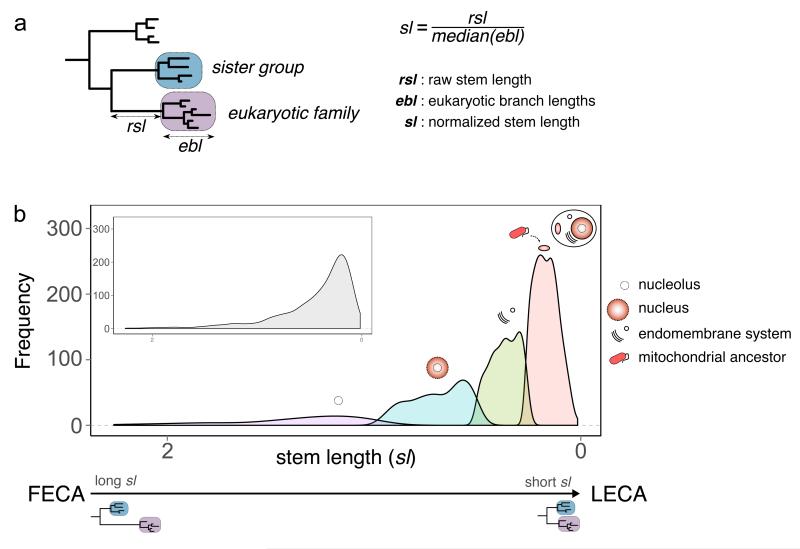
Previous analyses infer a LECA proteome of diverse phylogenetic origin1,8. Notably, only a fraction of the proteins of bacterial descent can be traced back to alpha-proteobacteria, the group from which mitochondria originated4. Attempts to explain alternative bacterial signals in LECA range from invoking horizontal gene transfer (HGT), phylogenetic noise, or additional symbiotic partners9,10, including the possibility that part of this diversity could have already been present in the putative archaeal host11. Resolving whether or not LECA proteins of bacterial descent were acquired in bulk is key to testing competing eukaryogenesis models. Here, we set out to assess whether the LECA proteins with alpha-proteobacterial ancestry show distinct patterns in terms of their current cellular localizations, and evolutionary distances to their closest ancestors, as compared to LECA proteins of other descent. For this, we surveyed the phylogenetic signal of inferred LECA proteomes (see Methods). First, the likely phylogenetic origin of each LECA family was assessed by evaluating the taxonomic distribution of prokaryotic sequences present in its closest neighbouring tree partition (see Methods and Fig. 1a). We then established a measure of phylogenetic distance for the branch subtending the LECA family and connecting it to the last prokaryotic ancestor shared with its closest prokaryotic relatives (raw stem length, Fig. 1a). Branch lengths indicate the number of inferred substitutions per site, which reflect both divergence time and evolutionary rate. To disentangle time from rates, which may vary across families, we normalized the raw stem length by taking into account the median of the branch lengths within the LECA family (see Methods for further details). We used this measurement (hereafter referred to as stem length) as a proxy for the phylogenetic distance between a given LECA protein family and its last shared ancestor with prokaryotes. Competing mito-early and mito-late hypotheses naturally differ in their expectations of stem lengths for proteins of proto-mitochondrial origin when compared to those of other putative origins. In a simple fusion model, with the proto-mitochondrion contributing most of the bacterial component, one would expect stem lengths of bacterial-derived proteins to be similar. In contrast, significant differences would be predicted by models involving different waves of gene acquisition. We assessed differences in stem length, protein function and subcellular localization across 1,078 LECA families of different origins.
Figure 1. Stem length analysis.
a. Schematic representation of the inference of the phylogenetic origin of LECA groups and the measured phylogenetic distances. First monophyletic groups of eukaryotic proteins that passed the required thresholds were considered as protein families present in LECA (purple box). The taxonomic range of the proteins present in the closest neighbouring tree partition (sister group, blue box) was used to define the putative phylogenetic origin of the LECA family. Distance to the common ancestor with the closest prokaryotic neighbouring group was measured (rsl) and normalized (sl) by dividing it by the median of the distances from the eukaryotic terminal nodes to the last common ancestor of all eukaryotic sequences (ebl). b. Subpopulation distributions within the overall stem length distribution (inset) as defined by a mixture model and the expectation-maximization (EM) algorithm. The four subpopulations/components are over-represented in different prokaryotic phylogenetic groups of origin, GO and COG functional category annotations (see text, Table 1, and Supplementary Tables 1 and 2). On top of these components, we represent the cellular localizations for which each family class is enriched. FECA indicates First Eukaryotic Common Ancestor.
We first used an unsupervised approach to assess whether the distribution of stem lengths in LECA families was homogeneous. By using the expectation-maximization (EM) algorithm12 to fit observed data to a mixture model, we inferred four distinct underlying distributions (Fig. 1b), each containing a subset of LECA families. We asked whether each underlying distribution contained an enrichment of protein families with i) a particular taxonomic origin, ii) a particular subcellular localization or iii) a particular functional category. Notably, we found that the first component (shortest stems) was enriched in families with bacterial origins (most particularly alpha-proteobacterial), mitochondrial localization, and energy production (see Table 1). In contrast, the two components with the longest stems (3rd and 4th) were enriched in families of archaeal and actinobacterial origins, and in annotations related to the nucleus and ribosomes (Fig. 1b, Table 1). The second component showed no enrichment in any ancestry, but a significant enrichment in endomembrane system localization. The above results are only consistent with mito-late models, with the archaeal contributions to eukaryotes, mainly associated to nuclear structures and genes related to informational processes (replication, transcription, translation), being more ancient, with the prokaryotic proteome of the endomembrane system being integrated later, and with the alpha-proteobacterial contribution, associated with mitochondria and energy production, appearing later than other bacterial components.
Table 1. Over-represented phylogenetic origins, GO terms and functional categories in the different components.
| Component | Size | Phylogenetic origin | Cellular localization | Cellular function | ||||||
|---|---|---|---|---|---|---|---|---|---|---|
|
| ||||||||||
| Group | N | P | GO cellular component | N | P | Functional category | N | P | ||
| 1 | 452 | Bacteria | 388 | < 1e-6 | mitochondrion | 150 | < 1e-6 | Amino acid transport and metabolism | 72 | 1.8e-4 |
| Alphaproteobacteria | 49 | 1.1e-4 | Energy production and conversion | 45 | 1.6e-2 | |||||
| Chlamydiae/Verrucomicrobia group | 19 | 1.4e-2 | Coenzyme transport and metabolism | 29 | 4.9e-2 | |||||
| Deltaproteobacteria | 29 | 2.0e-2 | ||||||||
| 2 | 284 | - | endoplasmic reticulum | 32 | 3.5e-3 | Carbohydrate transport and metabolism | 28 | 3.7e-2 | ||
| Golgi apparatus | 11 | 4.1e-2 | ||||||||
| extracellular space | 8 | 1.4e-2 | ||||||||
| 3 | 234 | Archaea | 80 | < 1e-6 | nucleoplasm | 13 | 2.7e-3 | Replication, recombination and repair | 24 | 6.1e-4 |
| Euryarchaeota | 30 | 1.3e-4 | nucleus | 80 | 5.9e-3 | Translation, ribosomal structure and biogenesis | 46 | 6.6e-3 | ||
| Crenarchaeota | 15 | 3.4e-3 | chromosome | 14 | 7.4e-3 | Transcription | 10 | 4.9e-2 | ||
| Korarchaeota | 7 | 1.2e-2 | nuclear chromosome | 9 | 2.4e-2 | |||||
| Actinobacteria | 16 | 2.7e-2 | nuceolus | 19 | 2.5e-2 | |||||
| protein complex | 46 | 2.9e-2 | ||||||||
| 4 | 94 | Archaea | 80 | < 1e-6 | ribosome | 24 | < 1e-6 | Translation, ribosomal structure and biogenesis | 36 | < 1e-6 |
| Thaumarchaeota | 8 | 4.9e-4 | cytosol | 39 | < 1e-6 | |||||
| Euryarchaeota | 16 | 1.4e-3 | organelle | 70 | 1.7e-2 | |||||
| Crenarchaeota | 7 | 2.7e-2 | nucleolus | 10 | 1.4e-2 | |||||
N is the number of LECA families per term, in each component
P-values < 1e-6 reflect value 0 in 106 permutations
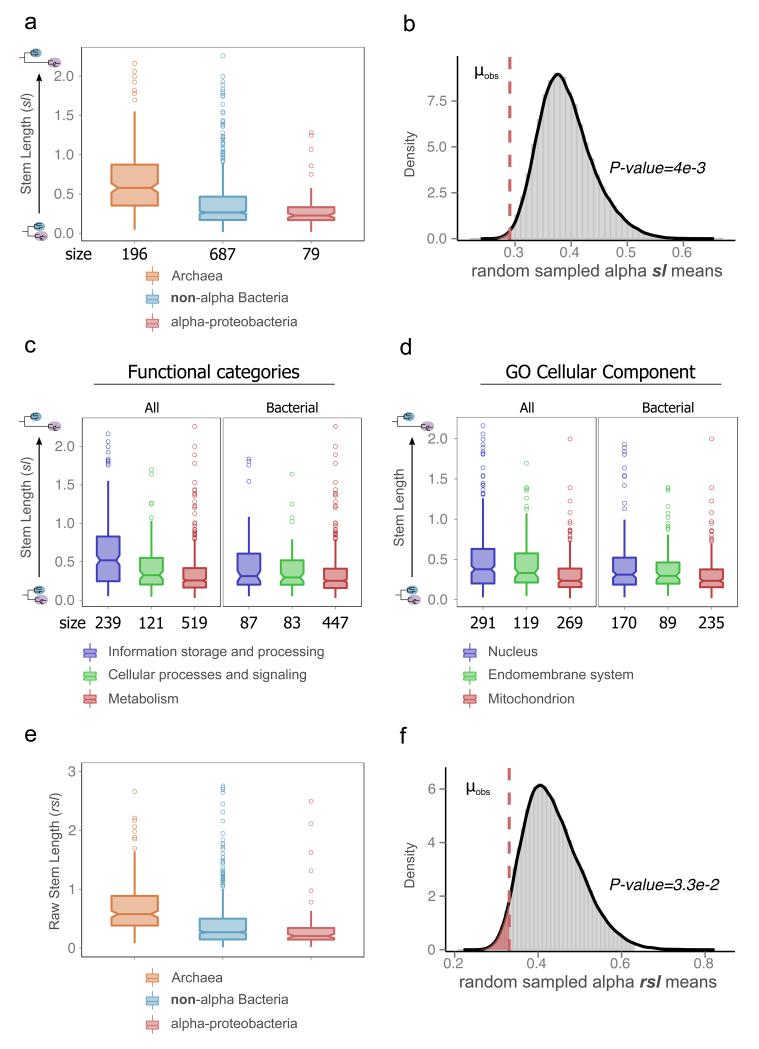
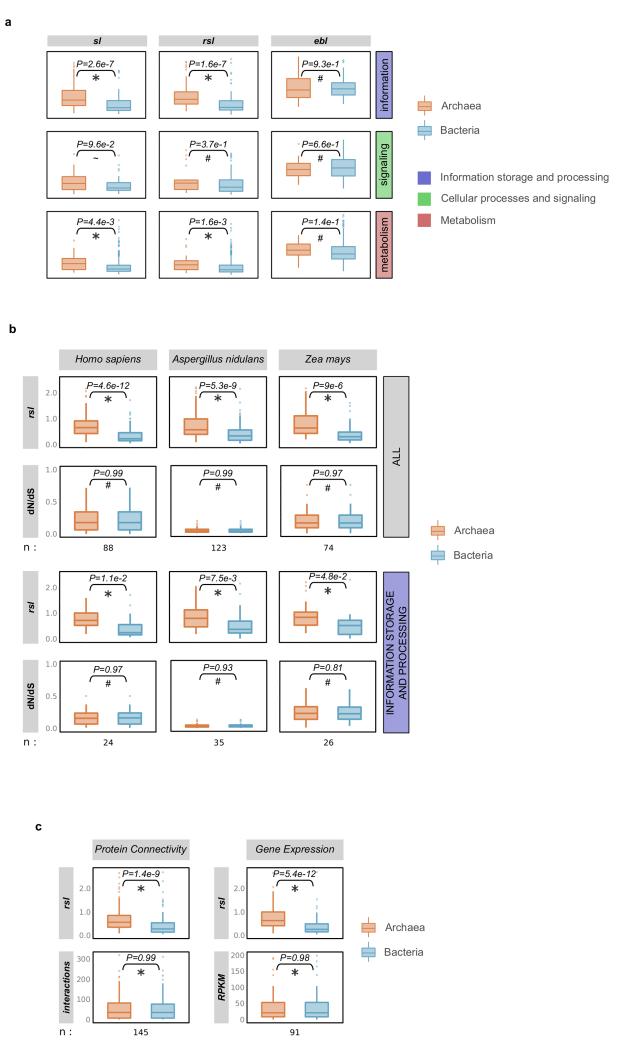
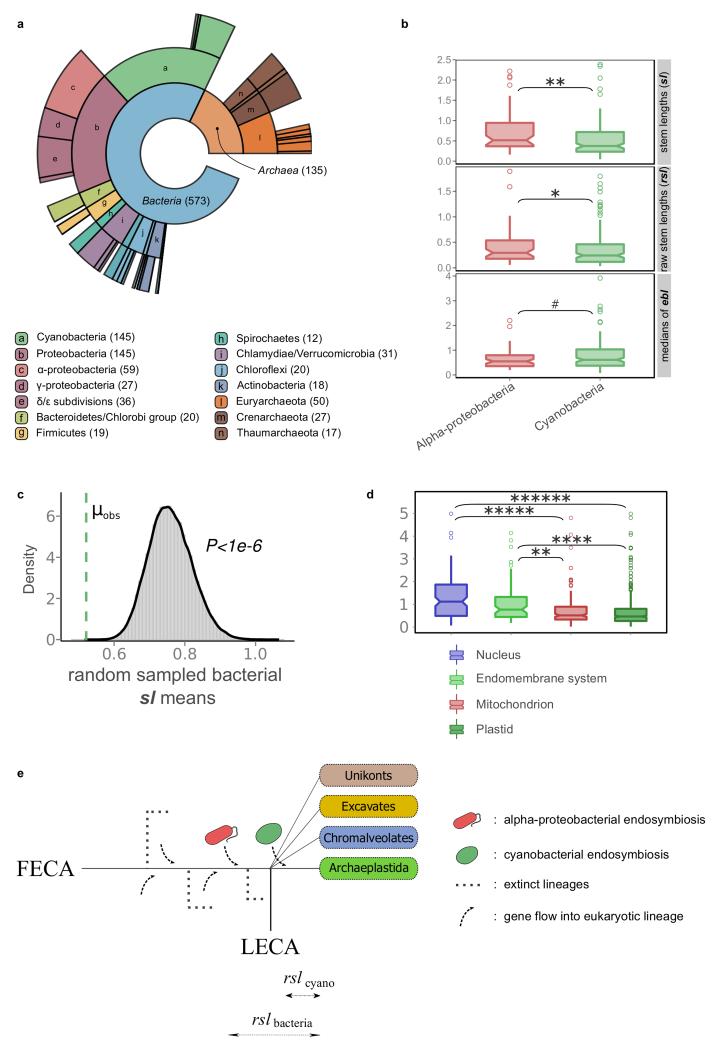
We tested this hypothesis more directly by grouping the LECA families by their inferred phylogenetic origin, and by their functional and subcellular localization annotations, and then testing whether their respective stem lengths were significantly different (Fig. 2a, Extended Data Fig. 1a-c). Overall, LECA families of bacterial origins have significantly shorter stems as compared to families of archaeal origin (P=1.38e-25, two-sided Mann-Whitney U test). Importantly, eukaryotic families of alpha-proteobacterial descent showed the shortest stems, together with families pointing to the Verrucomicrobia/Chlamydiales group. These lengths were significantly smaller than those found in LECA families of different bacterial origins (P=4.4e-2). When grouping LECA families according to their functional annotations, we found that those involved in informational processes had the longest stems, followed by those involved in cellular and signalling processes, with families involved in metabolic processes showing the shortest stems (Fig. 2c, Extended Data Fig. 1c). Next we asked the question whether LECA families predominantly present in distinct subcellular compartments showed differences in terms of phylogenetic origins and stem lengths. Consistent with the above results, nuclear protein families had the longest stems, followed by those involved in the endomembrane system, and finally mitochondrial proteins tended to have the shortest stems (Fig. 2d and Extended Data Fig. 1d). The fact that both function and evolutionary origin correlate with stem length raises the need to disentangle the contribution of each of these factors. Our normalization assumes proportional (not necessarily constant) evolutionary rates in branches preceding and post-dating LECA, which both correspond to periods where the given protein had been incorporated into the host. Large shifts in evolutionary rates between the stem and post-LECA phases may have differentially impacted families depending on their function, leading to the observed differences mentioned above. However, our results are independent of the normalization, as shown in comparisons using the raw stem lengths (Fig. 2e-f). Furthermore, in matched comparisons, families of similar function, selection pressure, number of protein-protein interactions, or expression levels but different origins show differences in stem lengths (Supplementary Information section 1, Extended data Fig. 2). Thus, phylogenetic origin, and not function, is the main driver of observed differences in stem lengths. To independently validate our approach, we assessed the relative timing of the acquisition of plastids, a type of organelle whose origin from cyanobacteria subsequent to mitochondrial endosymbiosis is uncontroverted. Consistently, cyanobacterial-derived families had significantly shorter stem lengths than alpha-proteobacterial derived families, thereby further supporting our approach (Supplementary Information section 2, Extended data Fig. 3).
Figure 2. Phylogenetic distance profiles of different prokaryotic sources (a-b), cellular functions (c) and cellular components (d).
a. Boxplot comparing stem length distributions in LECA families with archaeal, non-alpha Bacterial and alpha-proteobacterial sister-groups. Numbers on the X-axis indicate the number of families included in each class. Symbols indicate the P values obtained from a two-sided Mann-Whitney U test for the indicated comparisons as follows: “~” for P<=1e-1, “*” for P<=5e-2, “**” for P<=1e-2, “***” for P<=1e-3, “****” for P<=1e-4, “*****” for P<=1e-5 and “******” for P<1e-6. b. The observed mean (μobs) stem length of alpha-proteobacterial values as compared to the random sampling distribution of means, under the null hypothesis that families of different bacterial origins do not show differences in stem lengths. The P value is the probability that the mean would be at least as extreme as the observed, if the null hypothesis were true. The dashed line, and the shaded area under the density plot correspond to the one-sided P value of the test (indicated next to the figure). c-d. Boxplots of stem length distributions in LECA families of different COG functional categories (c) and GO localizations (d), when considering all LECA families (All), or only those of bacterial descent (Bacterial). Other symbols as in a. e-f. The results obtained in (a) and (b) are consistent when using raw stem lengths, indicating that the relative differences in stem lengths are not driven by differences in the rates of evolution within extant eukaryotes (ebl).
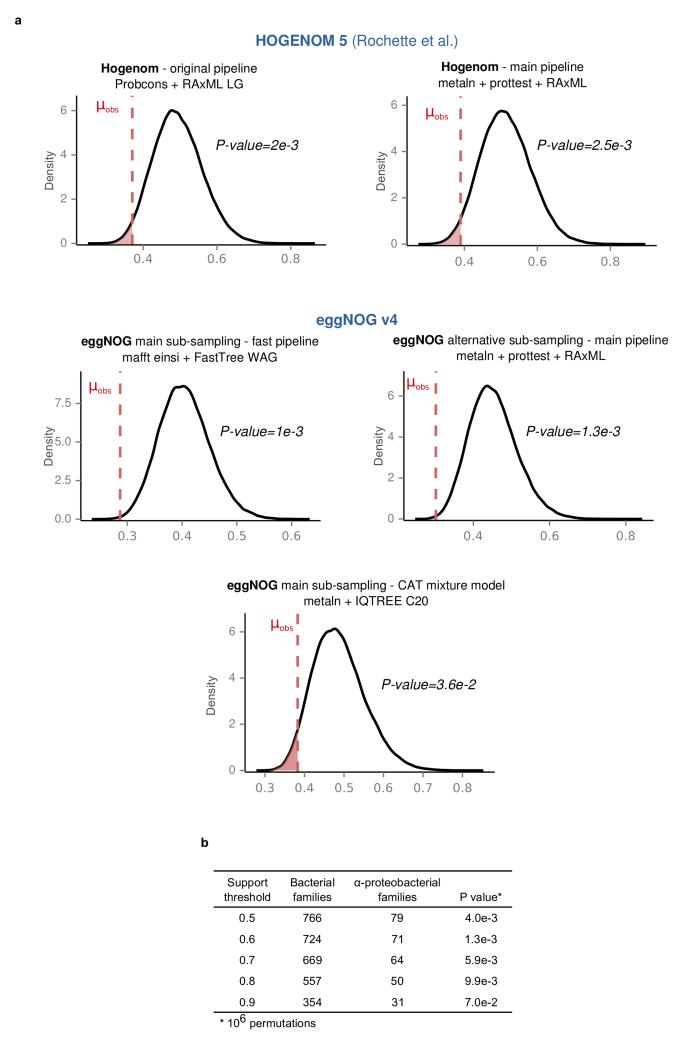
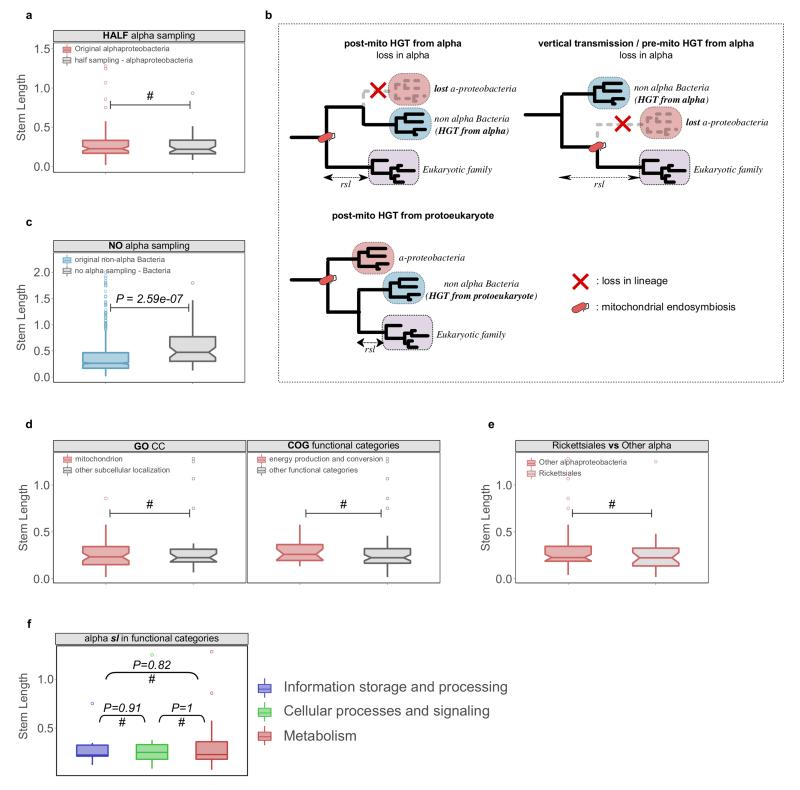
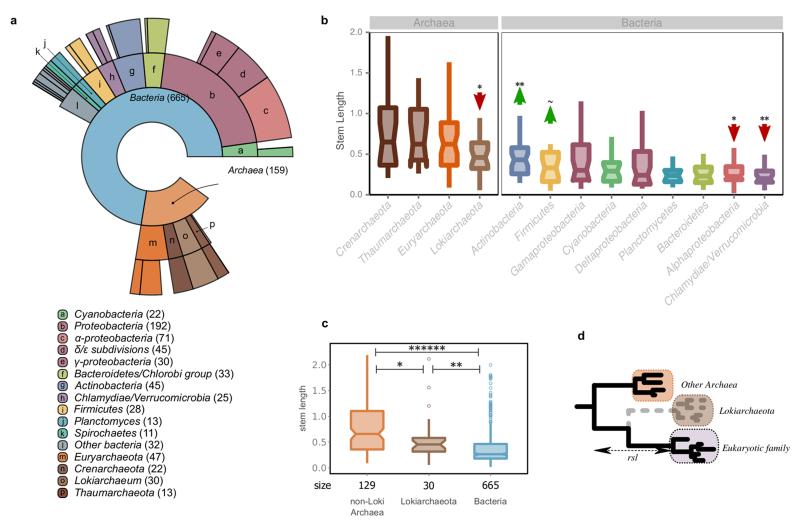
We next tested the robustness of our results with different LECA datasets, sequence sampling, and phylogenetic methods (see Supplementary Information sections 3-5, Extended Data Fig. 4-6). Additional controls (Supplementary Information sections 4-5, Extended data Fig. 6) showed that HGT alone cannot explain the observed signal from non-alphaproteobacterial bacteria, and discarded the possibility that shorter stem lengths in alpha-proteobacterial derived families resulted only from specific functional classes, or from those affiliated to Rickettsiales, whose specific clustering to mitochondrial proteins has been considered artefactual13. Finally, we included data from the recently identified Lokiarchaeon clade in our analysis11. Even though we found that LECA families of inferred Lokiarchaeal origin had stems larger than those of bacterial-derived families, they did show the shortest stems among archaeal-derived proteins, thereby providing additional support that there is a close association of this clade to eukaryotes (Supplementary Information section 6, Extended Data Fig. 7).
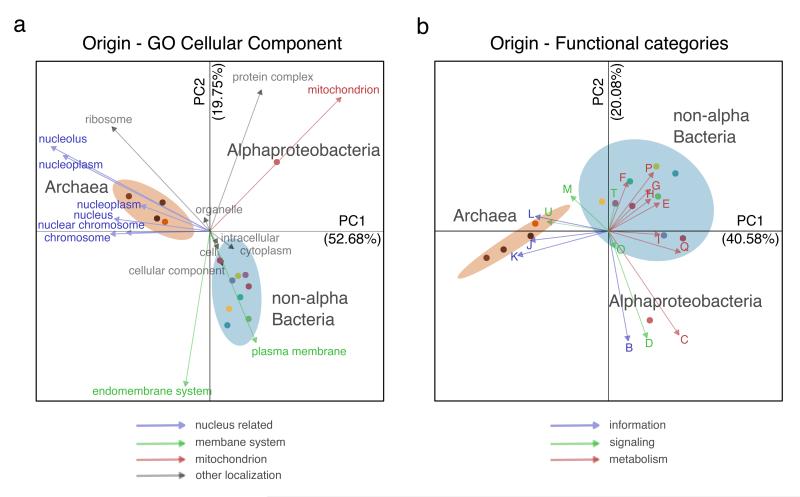
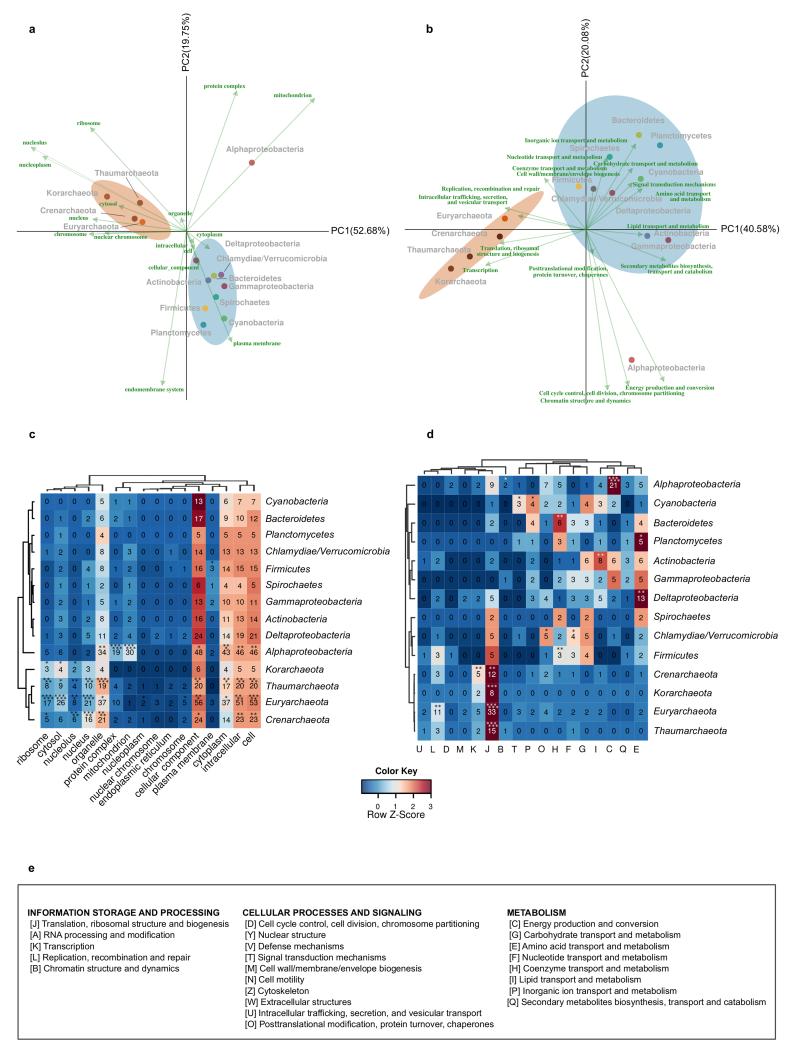
To gain further insight into the functionality and localization of the LECA families of different phylogenetic origins, we used correspondence analysis to visualize associations among these variables, and permutation tests to assess the statistical significance (see Methods, Fig. 3 and Extended Data Fig. 8). We found that alphaproteobacterial-derived genes tend to associate with mitochondria (P<=1e-6, permutation test 106 randomizations), whereas archaeal-derived families do so with the nucleus. Perhaps more unexpectedly, we found that LECA families of bacterial descent, except for alpha-proteobacteria, showed a clearly distinct pattern, being predominantly associated to endomembrane related compartments (Fig. 3b, Extended Data Fig. 8b,d). Consistent results were obtained when correlations between evolutionary origins and functional categories were evaluated (Fig. 3a, Extended Data Fig. 8a,c). In particular, the alpha-proteobacterial component showed a unique correlation with energy production (P<=1e-6). This result is not consistent with scenarios in which most of the bacterial components in LECA are assumed to originate from the alpha-proteobacterial endosymbiont, because in this case a higher functional coherence would be expected among them. These results also reinforce the idea that, despite substantial subcellular retargeting and functional diversification, the proto-mitochondrial derived fraction of the eukaryotic proteome retains a tendency to be mitochondrial localized14. Interestingly, alpha-proteobacterial derived families of mitochondrial localization have shorter stem lengths than mitochondrial families of different origins (P=6e-3), which indicates retargeting to the newly formed organelle.
Figure 3. The correspondence of different LECA components with different cellular localizations (a) and functions (b).
Correspondence analysis (CA) symmetric biplot showing differences between the localizations (a) and functions (b) of the families of various phylogenetic origins. In both cases, the first principal components, accounting for the largest percentage of variance explained, clearly separate the bacterial and archaeal (brown ellipse) eukaryotic origins, while the second components separate the alpha-proteobacterial (red dot) from the other bacterial origins (cyan ellipse). The numbers next to the principal axes (PC1-2) show the percentage of the total variance explained by each component. Both columns (functions or localizations) and rows (phylogenetic origins) are in principal coordinates. The colours of the arrows, cellular localizations (left), and functional categories (right), correspond to the categories and localizations of Fig. 2d and c, accordingly (see methods for more details). If a term cannot be categorized as above, the colour is grey. Dots are coloured according to the phylogenetic origin of the group as in Extended Data Fig. 1a (see also extended version of this figure in Extended Data Fig. 8).
Altogether, our results provide compelling support for a late acquisition of mitochondria, as proposed by several eukaryogenesis models5. Specifically, our data suggest that the majority of the bacterial component of LECA, with origins other than alpha-proteobacteria, was acquired earlier and mostly contributed to compartments other than the mitochondrion or the nucleus, and to processes besides energy production. We have shown that this pattern cannot be entirely explained by massive HGT to the proto-mitochondrial ancestor. This implies that these proteins were acquired by the host genome prior to mitochondrial acquisition. Thus, the host that engulfed the mitochondrion was already a complex cell, whose genome already harboured pathways and processes of diverse bacterial origins. Given the heterogeneity of these alternative bacterial origins, no simple model can explain this component. Serial symbiotic associations with different partners, the existence of prokaryotic consortia, or gradual waves of HGT to the host genome prior to mitochondrial endosymbiosis could all explain such chimerism. Finally, the archaeal-derived component has the longest stems and the strongest association to the nucleus, consistent with the idea that eukaryotes have rooted from within archaea, and that the nucleus is of archaeal origin. Our results are compatible with both a complex proto-eukaryotic host or a complex archaeal host already harbouring many pathways of bacterial origin15. In either case, mitochondrial engulfment marked an end to massive bacterial HGT in LECA and the start of the diversification of extant eukaryotic lineages. We argue that mitochondrial endosymbiosis was indeed a crucial late step in eukaryogenesis, which brought about the definitive selective advantage that facilitated the dominance and radiation of the eukaryotic groups that have survived to present day.
Methods
Sequence Data
The sequences of proteins encoded by 3,686 fully-sequenced genomes of Eukaryotes (238), Bacteria (3,318) and Archaea (130), as well as the 192,421 NOGs (Non-supervised Orthologous Groups) and COGs (Clusters of Orthologous Groups) corresponding to the broadest taxonomic level (LUCA), were downloaded from eggNOG v4.016, hereafter NOGs/COGs will be referred to as OGs, indistinctively. In total, 11,504 OGs containing 4,323,066 sequences both from eukaryotic and prokaryotic species, were considered. For the analysis including the recently sequenced member of lokiarchaeota11, the 5,384 protein coding sequences of the archaeon Loki were downloaded as of 7/05/2015 from the Protein database of NCBI (http://www.ncbi.nlm.nih.gov/protein/) under the taxonomy ID 1538547.
Taxonomy-based sequence sub-sampling
To reduce data redundancy and obtain a more balanced representation of different eukaryotic families, the initial dataset was sub-sampled using taxonomic criteria. We selected 37 eukaryotic species, covering all main eukaryotic subdivisions present in EggNOG v4 (Unikonts, Archaeplastida, Chromalveolates, Excavates), emphasising model species for which better genomes with experimental annotations were available (Supplementary Table 1). The selected set comprises 18 Unikonts (16 Opisthokonta and 2 Amoebozoa), 6 Archaeplastida (5 Viridiplantae and 1 Rhodophyta), 8 Chromalveolates (5 Alveolata, 3 Stramenopiles) and 5 Excavates (2 Euglenozoa, 1 Fornicata, 1 Parabasalia, and 1 Heterolobosea). Similarly, for the prokaryotic genomes we defined 692 levels based on taxonomic criteria. This set represents all 681 prokaryotic genera present in EggNOG v4 and 11 groups in which the “genus” rank is not assigned (“no rank”). Genomes with non-informative taxonomic assignments including the words ‘environmental' and ‘unclassified', were not considered. For each of the OGs we randomly sampled one sequence from each of the 729 taxonomic levels defined (37 eukaryotic species plus 692 prokaryotic levels).
Phylogenetic analysis and identification of LECA families
The detection of LECA families (i.e groups of related eukaryotic sequences that are inferred to be derived from LECA) was done in two steps. First Maximum likelihood (ML) trees were computed using a fast approach. For this we first built alignments of the 8,188 filtered OGs using MAFFT v6.861b17 and the --auto parameter. These alignments were trimmed using trimAl v1.418 with a gap score cutoff of 0.01. Then, ML phylogenetic trees were reconstructed using FastTree 2.1.719 and the WAG evolutionary model (-wag). These trees were inspected to identify monophyletic groups of three or more eukaryotic sequences, corresponding to eukaryotic protein families. Similar to previous studies8, eukaryotic sequences within one OG were not considered a priori monophyletic, as the same group may comprise different eukaryotic groups derived from ancestral duplications subsequent to LUCA but preceding LECA (see also20). This resulted in the identification of multiple eukaryotic LECA families in some OGs.
In the subsequent step we performed a second phylogenetic analysis of the identified eukaryotic LECA families. For this we considered only the sequences in the given eukaryotic family and all the prokaryotic sequences in the tree, and used a more accurate phylogenetic approach. We used a similar pipeline to that described in21. In brief, multiple sequence alignments using three different aligners, MUSCLE v3.8.3122, MAFFT v6.861b17 and DIALIGN-TX 1.0.223, were performed in forward and reverse orientation. The six resulting alignments were combined with M-COFFEE v8.8024 into a maximal-consensus alignment, which was trimmed using trimAl v1.418 with a gap score cutoff of 0.01. For each sequence alignment, the best fit evolutionary model selection was done prior to phylogenetic inference using ProtTest v325. In each case three different evolutionary models were tested (JTT, WAG, LG). The model best fitting the data was determined by comparing the likelihood of all models according to the AIC criterion. Finally, an ML tree was inferred with RAxML v8.0.2226 using the best-fitting model and a discrete gamma-distribution model with four rate categories plus invariant positions. The gamma parameter and the fraction of invariant positions were estimated from the data. SH-like branch support values were computed using RAxML v8.0.22. Only the eukaryotic families whose monophyly was also recovered in this second phylogenetic step, and for which the support value of the branch between this clade and the prokaryotic sister clade was higher than 0.5, were further considered in the analysis. For the phylogenetic analysis, the execution of the different phylogenetic workflows was done using the bioinformatics tool ETE v2.327 as environment in the single gene tree execution mode.
Detection of eukaryotic families present in LECA
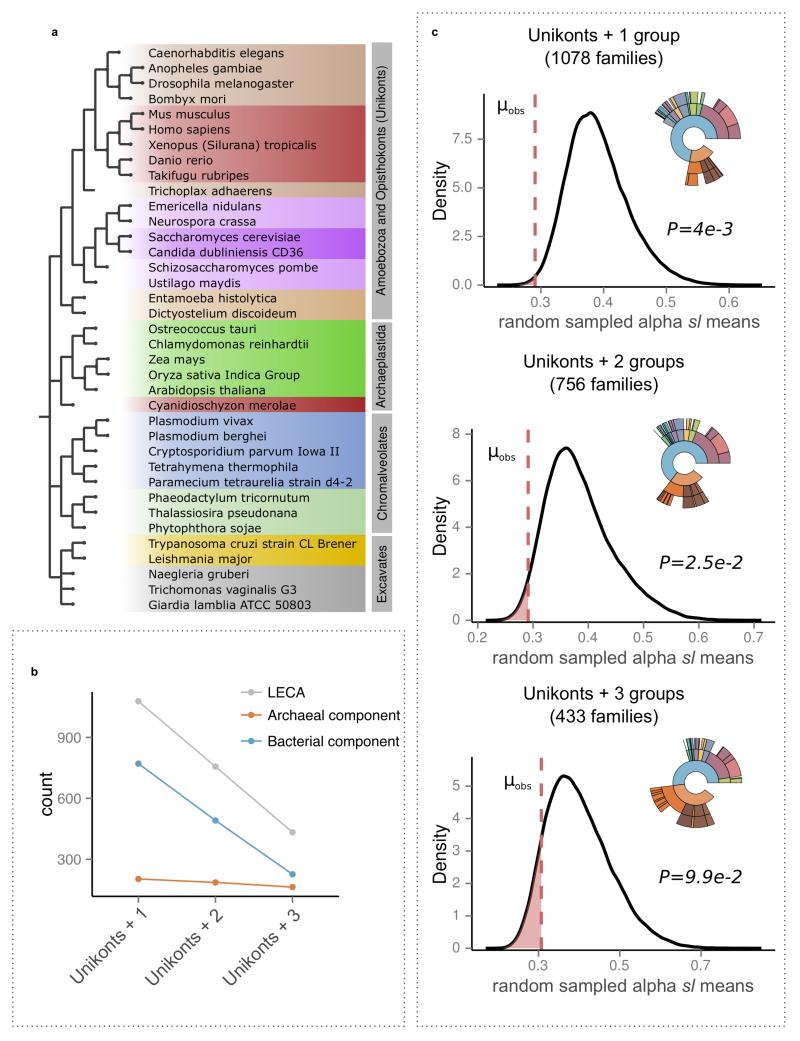
Our workflow provided us with a flexible framework for evaluating the effect on the final outcome of different definitions of LECA. Results using alternative criteria are discussed in the Supplementary Information section 1. Similarly to previous analyses8, a eukaryotic family was inferred as being derived from LECA on the basis of its presence in different major eukaryotic groups. In particular, the requisites for inclusion in LECA are similar to the one used by Rochette et.al8, but with some important differences. For instance, the criteria used by Rochette and colleagues could be met by genes present only in Archaeplastida and Chromalveolates, a pattern that suggests that genes are acquired in Chromalveolates through secondary endosymbiosis28. Our criteria required the presence of sequences from both Unikonts and from at least one of the other groups among Bikonts (Archaeplastida, Chromalveolates and Excavates, see also Extended Data Fig. 4a). This procedure rendered 1,078 families, 433 of which were present in all four groups and 323 in at least three groups, including Unikonts. Upon using more stringent definitions our main results were not affected, but the number of families that could be selected for analysis were significantly reduced (see Extended Data Fig. 4b and Supplementary Information section 3.1).
Inference of the prokaryotic sister group and phylogenetic origin
We used a nearest neighbour approach for estimating the prokaryotic affiliation of each LECA group (see Fig. 1a). For that, the phylogenetic trees were first rooted to the prokaryotic sequence that was most distant from the eukaryotic LECA family. Then, the phylogenetic origin of each LECA family was assigned by evaluating the prokaryotic species present in the sister tree partition and using the NCBI taxonomy to define the narrowest taxonomic level that included all prokaryotic species present in that partition. For instance, if only sequences from α-proteobacteria and β-proteobacteria were present in the sister branch, the inferred origin would be “proteobacteria”. If sequences from any bacterial group(s) were present together with sequences from any archaeal group(s), the group of origin would be considered “cellular organisms” and so on. Given the hierarchical structure of NCBI taxonomy, this assignment inherited all parent taxonomic levels included within it. For example, a LECA family with an inferred origin in Rickettsiales was also assigned alpha-proteobacterial, proteobacterial and bacterial origins.
Measurement of the phylogenetic distance to the last common prokaryotic ancestor of LECA families: stem lengths
The branch of interest of each gene family tree is the one connecting the last common ancestor of the LECA family with the common ancestor of this and the nearest prokaryotic sister group to LECA (stem, see Fig. 1a). The length of this branch corresponds to the expected number of substitutions per site in that lineage. That is, the amount of change from the incorporation of the gene into the eukaryotic lineage until LECA. As this also depends on the evolutionary rate of each gene, we normalized the stem length value by dividing it by the median of the branch lengths within the LECA family. We chose the median because of its robustness with respect to extreme outliers (very long branches resulting from fast evolving sequences or phylogenetic artefacts). In the text we refer to this corrected branch length value as stem length (sl). Our rationale for this correction is the following: across families, the time of divergence from LECA is, by definition, the same. Therefore, differences in eukaryotic branch lengths across families are expected to reflect differences in evolutionary rates. By applying this correction, we thus divide by a constant (time from LECA) and a rate, which varies from family to family. This can schematically be expressed by the following relationship:
where Rs-Ts and Re-Te are the evolutionary rate (R) and divergence time (T) of the stem (s) and the eukaryotic clade (e), respectively. Under the assumption that rates pre- and post-LECA are correlated (i.e. not necessarily constant), this normalization compensates for differences in rates in the pre-LECA branches, providing a closer measurement of the divergence time from the prokaryotic ancestor to the LECA. Although we cannot discard that major rate shifts in pre- and post-LECA branches occurred in some cases, we consider it unlikely that they affected in a similar way all proteins of the same phylogenetic origin, regardless of their function. Or, alternatively, that they affected in an opposite way proteins with similar function but of different phylogenetic origin. Nevertheless, we performed comparisons using the raw stem lengths as well as with the (normalized) stem lengths.
LECA family descriptors
Each LECA family was assigned a phylogenetic origin and a normalized stem length. In addition, they also received the functional (COG functional categories) and Gene Ontology (GO) annotations provided by the eggNOG database. Annotations included functional categories of the corresponding orthologous groups as defined in the COG database, as well as GO Cellular Component annotations, of which we only considered terms that had experimental evidence codes and that were present in the GO slim generic cut-down version of the GO ontologies. After testing alternative thresholds, GO terms were assigned to the corresponding families if they were present in more than 10% of the sequences in the family considered. For the correspondence analysis (see below), where very rare terms could bias the statistical inference we used a stricter approach, considering only GO slim terms that were assigned to sequences from more than one group among Unikonts, Archaeplastida, Chromalveolates and Excavates. Finally, through the corresponding orthologous groups (OGs), COG functional categories and GO slim terms were linked to prokaryotic groups and stem lengths, which were later used for profile comparison (Fig. 2c-d and Extended Data Fig. 1C-d). For convenience, we list here the COG functional categories corresponding to the one-letter codes. A : RNA processing and modification, B : Chromatin Structure and dynamics, C : Energy production and conversion, D : Cell cycle control and mitosis, E : Amino Acid metabolism and transport, F : Nucleotide metabolism and transport, G : Carbohydrate metabolism and transport, H : Coenzyme metabolism, I : Lipid metabolism, J : Translation, K : Transcription, L : Replication and repair, M : Cell wall/membrane/envelop biogenesis, N : Cell motility, O : Post-translational modification, protein turnover, chaperone functions, P : Inorganic ion transport and metabolism, Q : Secondary Structure, T : Signal Transduction, U : Intracellular trafficking and secretion, Y : Nuclear structure, Z : Cytoskeleton, R : General Functional Prediction only, S : Function Unknown.
Unsupervised clustering and Enrichment analyses
The clustering of the stem lengths into different components was done by fitting a Gaussian Mixture Model (GMM) using the EM algorithm as implemented in the Mclust package29 in R. The Mclust function returns the optimal model - the optimal number of components and membership - according to a maximum likelihood estimation and the Bayesian information criterion (BIC) for EM, initialized by hierarchical clustering for parameterized Gaussian mixture models. Applying the algorithm to the distribution of the normalized stem lengths from the LECA inference clustered the data into five components/subpopulations, of which the 5th, with only 14 extreme observations (with values within the range of 2.3 – 7.1), also enriched in archaeal origins, was considered an outlier and was excluded. Each of the 1,064 remaining LECA families was assigned a membership within the four remaining components. Each of these subgroups was tested for enrichment in prokaryotic groups of origin, COG functional categories and GO Cellular Components terms. Enrichments were calculated using 106 permutations, in which the family memberships were randomly reshuffled and the P values estimated as the number of times a given origin, COG category or GO term had a count in the given component equal or greater than the observed one (Table 1).
Statistical comparisons of stem lengths
The statistical significance of the observed differences in normalized stem lengths between the different groups (taxonomic groups or functional categories and GO terms) was assessed with the non-parametric two-sided Mann-Whitney U test for pairwise, or among three, comparisons. In the case of comparisons among three groups the P values were adjusted for multiple testing with a fdr correction using the p.adjust function in R. The significance of the observed difference between the normalized stem lengths associated to the various groups and the overall bacterial signal was assessed using a permutation test with 106 randomizations. In each round, by sampling the whole distribution, the values were randomly assigned to the various eukaryotic families and the mean, resulting from the random sampling of each of the groups, was computed (every group in each round had the same size but random values). The P value for each group was calculated as the number of times that an equal or more-extreme mean than the observed was occurring by chance divided by the overall number of randomizations.
Statistical associations
We used a permutation test (106 permutations) to evaluate the relationships between the proteins' evolutionary origin and their function/subcellular localization. The observed association was estimated as the number of co-occurrences between a given term and a given prokaryotic group of origin throughout all the families. The P value was calculated as the number of times that the amount of random co-occurrences between a group-term pair was equal or higher than the observed, divided by the number of permutations. Correspondence analysis (CA) is a statistical multivariate technique, conceptually similar to PCA, that has been widely used to visualize associations between categorical variables30. Briefly, CA decomposes the chi-square statistic associated with the two-way table into orthogonal factors that maximize the separation between row and column scores. The correspondence analysis was applied to the contingency table of co-occurrences between the inferred taxonomic groups of prokaryotic origins (rows) and the various annotation terms (columns). The biplots in Fig. 3 and Extended Data Fig. 8a-b show the best 2-dimensional approximation (first 2 principal axes) of the distances between rows and columns in each case. For the computation we used the ca function of the ca package in R, after removing very rare observations (single observation columns) that could bias the representation.
Extended Data
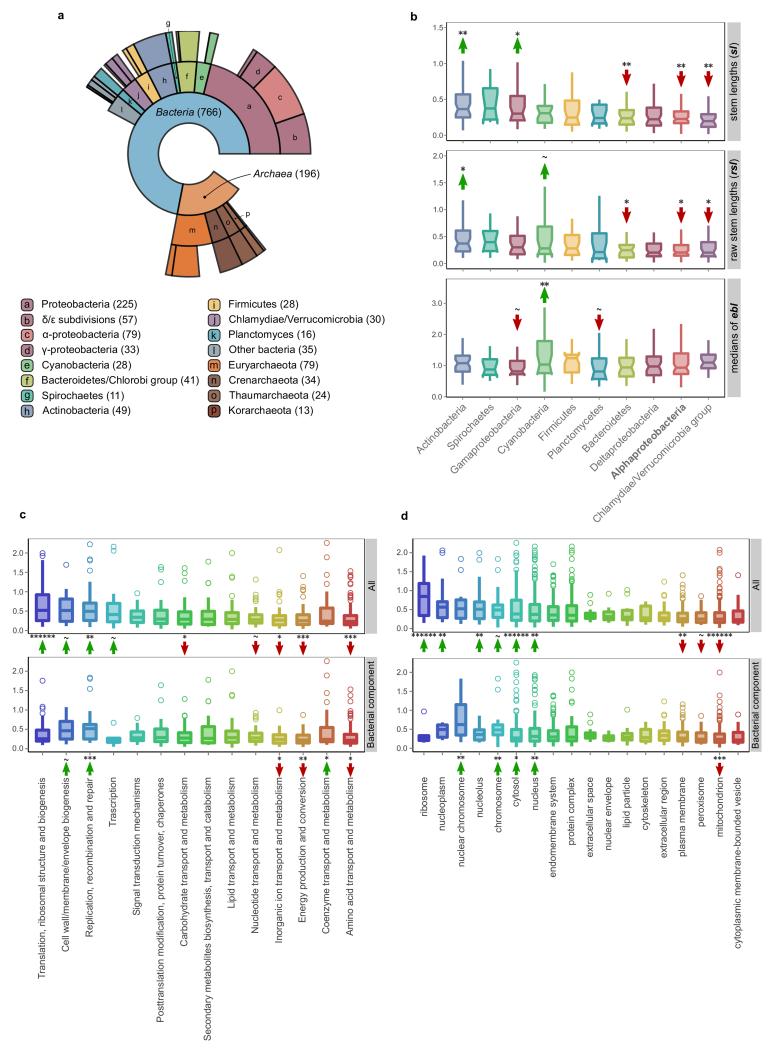
Extended Data Figure 1. Sister group distribution (a) and extended phylogenetic distance profiles of different prokaryotic sources (b), cellular functions (c) and cellular components (d).
a, Ring plot showing the distribution of inferred prokaryotic origins. Inner layers represent hierarchically lower (broader) taxonomic levels. The number of LECA families assigned to each group is indicated in parentheses next to the corresponding level in the ring plot or in the boxes below. b, Box plot showing the distributions of branch lengths in the different bacterial components. Measured stem lengths (sl), raw stem lengths (rsl), and the medians of the lengths from LECA to branch tips inside the eukaryotic families (ebl), as defined in Fig. 1a, are shown. Permutation tests were performed to evaluate the statistical significance of the differences between the distributions. A total of 106 permutations were performed, with the values being randomly shuffled in each permutation (see also Methods). The arrows and symbols above the boxes refer to the statistical significance of the differences observed when compared to randomly shuffled distributions (lower values, downward red arrow; higher values upward green arrow). The correspondence between the symbols and the P values is as follows: “~” for P<=1e-1, “*” for P<=5e-2, “**” for P<=1e-2, “***” for P<=1e-3, “****” for P<=1e-4, “*****” for P<=1e-5 and “******” for P<1e-6. c-d, The stem length profiles of the various functional categories (c) and GO slim cellular components (d) are shown. As in Fig. 2c, the stem lengths are also evaluated by looking at only the bacterial component in order to exclude the possibility that the observed differences are due solely to archaeal-bacterial differences. The significance was assessed with permutation tests (106 permutations) and is indicated with arrows as in (b).
Extended Data Figure 2. Families of archaeal origin have significantly longer stems than families of bacterial origin across different functional categories (a), similar selective pressures (b) and connectivities/expression levels (c).
a, The stem lengths, raw stem lengths and eukaryotic branch lengths, between families of archaeal and bacterial inferred origin, are compared across the three major functional categories. While the eukaryotic branch lengths among the groups do not show significant differences, differences are detected in their respective stems (raw stem lengths and stem lengths). b, Archaeal and bacterial LECA families of similar selective pressures (as measured by dN/dS values across family members) differ significantly in terms of their raw stem lengths. Sets of families from both groups were matched with respect to their dN/dS values in the indicated reference species. dN/dS data were downloaded from Ensembl for family members corresponding to Homo sapiens (Metazoa), Aspergillus nidulans (fungi) and Zea mays (plants) (see Supplementary Information section 1). The comparison of the raw stem lengths of the two sets shows that archaeal families generally have significantly longer stems (upper plots), and functions within the “information storage and processing” category (lower plots), irrespective of their selective pressures. c, Archaeal and bacterial LECA families of similar connectivity/expression levels show significantly different raw stem lengths (rsl) (see Supplementary Information section 1). In both (a), (b) and (c), differences between the archaeal and bacterial component were evaluated with a two-tail Mann-Whitney U test and the P value is indicated in each case (“*” for P<=5e-2, “~” for P<= 1e-1, “#” for P>1).
Extended Data Figure 3. Analysis of the cyanobacterial signal in primary plastid-bearing eukaryotes.
a, Ring plot showing the distribution of inferred prokaryotic origins in widespread plant protein families, as in Extended Data Fig. 1a. The profile of inferred origins of eukaryotes that acquired a plastid through primary endosymbiosis carry a strong signal from the cyanobacterial endosymbiont. b, Families of inferred cyanobacterial origin have significantly shorter stem lengths and raw stem lengths than alpha-proteobacterial families and c, than the random distribution of stem lengths from the bacteria inferred component, pointing to a more recent acquisition of plastids (post-LECA). d, Overall, as with mitochondrial localized proteins, those proteins localized to plastids have shorter stems than the nuclear and endomembrane system proteins. e, Schematic representation of the expected difference in stems, given that cyanobacterial endosymbiosis occurred after the diversification of the major eukaryotic lineages. As confirmed, the raw stem lengths measured from plant protein families to their common ancestor with cyanobacteria are shorter than those whose origin can be traced back to alpha-proteobacteria or other bacterial groups. Two-tail Mann-Whitney U test P value symbols in (b) and (d) are as in Extended Data Fig. 1.
Extended Data Figure 4. Effect of alternative LECA definitions.
a, The four eukaryotic groups including all 37 selected eukaryotic species used in the analysis are shown next to the NCBI taxonomic structure, with the higher groupings modified according to the Tree of Life Project (http://tolweb.org/Eukaryotes/3). b, Stricter LECA definitions have a much larger effect on the bacterial component as compared to the archaeal component, which is more widespread among eukaryotic groups. c, The effect of different LECA definitions in terms of taxonomic assignments and differences in stem lengths between proteins of alpha-proteobacterial origins and those derived from other bacteria. Numbers in parenthesis indicate the total number of LECA families that passed the threshold. The kernel density plots, as in Fig. 2b, show the observed stem length means for alpha-proteobacteria as compared to 106 random samplings among values in protein families of bacterial origin. The observed means (μobs) are shown with a dashed red line, reflecting the P value of each test, and indicated next to the plot. See also Supplementary Information section 3.1.
Extended Data Figure 5. Alpha-proteobacterial derived proteins have consistently shorter branches irrespective of the methods, datasets and support thresholds.
Kernel density plots of the random mean distributions of the stem lengths are shown for the different methods, datasets and support thresholds used (see also Supplementary Information sections 3.2-3.3). The observed alpha-proteobacterial means (μobs) are as in Fig. 2b. a. Results after using either, the phylogenetic trees provided by the authors in Rochette et. al. (upper left), our standard phylogenetic pipeline applied to their sampling of sequences (upper right), or alternative phylogenetic pipelines or samplings from EggNOG (lower). b, The main result is robust against progressively stricter support thresholds up until the sample size becomes too small (support threshold >0.9). Numbers in parenthesis indicate the number of bacteria inferred LECA families for each threshold.
Extended Data Figure 6. Evaluation of alternative HGT scenarios and other potential biases.
a, The sampling effect was simulated by artificially removing part or all of the alpha-proteobacterial sequences in the final datasets. To simulate the potential bias caused by an enriched sampling of alpha-proteobacteria an artificial reduction of alpha-proteobacterial sequences to 50% was applied to the dataset (HALF alpha sampling). The reduction of alpha-proteobacterial sequences by 50% does not significantly change the inferred stem length within families of alpha-proteobacterial origin. b, Different scenarios of HGT to the proto-mitochondrion are unable to explain the observed signal in families mapped to non-alpha Bacteria. The transfer of a gene from alpha-proteobacteria to another bacterial lineage after mitochondrial endosymbiosis and its parallel loss from the lineage of the mitochondrial ancestor (“post-mito HGT from alpha”) would result in unchanged stem lengths. Loss of a gene from the alpha-proteobacterial sister clade would result in an increase of the inferred stem lengths (“vertical transmission / pre-mito HGT from alpha”). The transfer of a gene from the protoeukaryotic lineage to other bacterial clades would result in shorter stem lengths compared to the alpha-proteobacterial mappings (“post-mito HGT from protoeukaryote”). c, Upon total exclusion of alpha-proteobacterial sequences (NO alpha sampling), eukaryotic families map to other bacterial groups but with stem length higher than those observed typically. The same is observed when comparing the stem lengths of the families mapping to proteobacterial groups in the absence of alpha-proteobacteria, to those typically mapping to proteobacterial groups other than alpha-proteobacteria. d, Boxplots showing that there are no significant differences in the stem lengths between alpha-proteobacterial families with mitochondrial localization when compared to those with other subcellular localizations (left), or between families involved in energy related functions compared to those involved in other functional categories (right). e, Boxplot showing no significant difference between the distribution of stem lengths of families of Rickettsiales inferred origin and other alpha-proteobacteria. f, Alpha-proteobacterial families in different functional categories show no difference in stem lengths. In all the cases the distributions were compared using a two-sided Mann-Whitney U test. See also Supplementary Information sections 4-5.
Extended Data Figure 7. LECA inference and Lokiarchaeota.
Results after the inclusion of Lokiarchaeota in our analysis. a, The distribution of the sister group inference among prokaryotic taxonomy is shown in a ring plot together with the number of families in each group in parentheses (as in Extended Data Fig. 1). b, Boxplot showing the stem length profiles of the various prokaryotic groups. Lokiarchaeota show the lowest values among all archaeal groups but higher values than any bacterial group. The symbols correspond to the same P values explained in Extended Data Fig. 1 after applying a permutation test (106 permutations) for the archaeal and bacterial components, independently. c, Boxplot with the comparison between the non-Loki archaeal, the Lokiarchaeota and the bacterial stem length profiles. The P value symbols are as before (two-sided Mann-Whitney U test, frd correction). d, Schematic representation of the effect of the absence of Lokiarchaeum sequences on the stem lengths. The inferred origin of 30 eukaryotic families that were previously mapped to other, mainly archaeal, groups within the eggNOG v4 DB, is Lokiarchaeota, when homologous sequences from this metagenome are included. A reduction in the observed stem lengths of the families of Lokiarchaeota inferred origin is expected in the scenario of Lokiarchaeota being the closest known archaeal relative of Eukaryotes. See also Supplementary Information section 6.
Extended Data Figure 8. Different LECA components have different GO cellular components (a,c) and functional (b,d) profiles.
Genes of different origin tend to have different functions and sub-cellular localizations. a-b, The same CA symmetric biplots as in Fig. 3 in higher resolution, with the names of the taxonomic group, the function and the GO slim terms, indicated next to the coordinates. The percentage of variance explained by each principal component is indicated next to each axis in parenthesis. c-d, The contingency tables also used in CA are shown in the form of a heatmap. The asterisks in the different cells reflect the significance of the association between a given origin and a localization (c) or function (b), as computed using permutation tests (106 permutations), where the annotations among each eukaryotic family were reshuffled (see Methods). The correspondence between the symbols and the P values is as in Extended Data Fig. 1. e, The COG functional categories, as organized in the three major groups “Information storage and processing”, “cellular processes and signaling” and “metabolism”.
Supplementary Material
Acknowledgements
T.G. group research is funded in part by a grant from the Spanish ministry of Economy and Competitiveness (BIO2012-37161), a grant from the European Union FP7 FP7-PEOPLE-2013-ITN-606786 and a grant from the European Research Council under the European Union's Seventh Framework Programme (FP/2007-2013) / ERC (Grant Agreement n. ERC-2012-StG-310325).
Footnotes
The authors declare no competing interests.
Is linked to the online version of the paper at www.nature.com/nature.
References
- 1.Koonin EV. The origin and early evolution of eukaryotes in the light of phylogenomics. Genome Biol. 2010;11:209. doi: 10.1186/gb-2010-11-5-209. [DOI] [PMC free article] [PubMed] [Google Scholar]
- 2.Embley TM, Martin WF. Eukaryotic evolution, changes and challenges. Nature. 2006;440:623–30. doi: 10.1038/nature04546. [DOI] [PubMed] [Google Scholar]
- 3.Koumandou VL, et al. Molecular paleontology and complexity in the last eukaryotic common ancestor. Crit. Rev. Biochem. Mol. Biol. 2013;48:373–96. doi: 10.3109/10409238.2013.821444. [DOI] [PMC free article] [PubMed] [Google Scholar]
- 4.Gray MW, Burger G, Lang BF. Mitochondrial evolution. Science. 1999;283:1476–1481. doi: 10.1126/science.283.5407.1476. [DOI] [PubMed] [Google Scholar]
- 5.Poole AM, Gribaldo S. Eukaryotic Origins: How and When Was the Mitochondrion Acquired? Cold Spring Harb. Perspect. Biol. 2014 doi: 10.1101/cshperspect.a015990. [DOI] [PMC free article] [PubMed] [Google Scholar]
- 6.Martijn J, Ettema TJG. From archaeon to eukaryote: the evolutionary dark ages of the eukaryotic cell. Biochem. Soc. Trans. 2013;41:451–7. doi: 10.1042/BST20120292. [DOI] [PubMed] [Google Scholar]
- 7.Lester L, Meade A, Pagel M. The slow road to the eukaryotic genome. BioEssays News Rev. Mol. Cell. Dev. Biol. 2006;28:57–64. doi: 10.1002/bies.20344. [DOI] [PubMed] [Google Scholar]
- 8.Rochette NC, Brochier-Armanet C, Gouy M. Phylogenomic Test of the Hypotheses for the Evolutionary Origin of Eukaryotes. Mol. Biol. Evol. 2014;31:1–14. doi: 10.1093/molbev/mst272. [DOI] [PMC free article] [PubMed] [Google Scholar]
- 9.Thiergart T, Landan G, Schenk M, Dagan T, Martin WF. An evolutionary network of genes present in the eukaryote common ancestor polls genomes on eukaryotic and mitochondrial origin. Genome Biol. Evol. 2012;4:466–85. doi: 10.1093/gbe/evs018. [DOI] [PMC free article] [PubMed] [Google Scholar]
- 10.Ku C, et al. Endosymbiotic gene transfer from prokaryotic pangenomes: Inherited chimerism in eukaryotes. Proc. Natl. Acad. Sci. 2015;112:10139–10146. doi: 10.1073/pnas.1421385112. [DOI] [PMC free article] [PubMed] [Google Scholar]
- 11.Spang A, et al. Complex archaea that bridge the gap between prokaryotes and eukaryotes. Nature. 2015;521:173–179. doi: 10.1038/nature14447. [DOI] [PMC free article] [PubMed] [Google Scholar]
- 12.Do CB, Batzoglou S. What is the expectation maximization algorithm? Nat. Biotechnol. 2008;26:897–9. doi: 10.1038/nbt1406. [DOI] [PubMed] [Google Scholar]
- 13.Esser C, et al. A genome phylogeny for mitochondria among alpha-proteobacteria and a predominantly eubacterial ancestry of yeast nuclear genes. Mol. Biol. Evol. 2004;21:1643–1660. doi: 10.1093/molbev/msh160. [DOI] [PubMed] [Google Scholar]
- 14.Gabaldón T, Huynen M. a. Shaping the mitochondrial proteome. Biochim. Biophys. Acta. 2004;1659:212–20. doi: 10.1016/j.bbabio.2004.07.011. [DOI] [PubMed] [Google Scholar]
- 15.Koonin EV, Yutin N. The dispersed archaeal eukaryome and the complex archaeal ancestor of eukaryotes. Cold Spring Harb. Perspect. Biol. 2014;6:a016188. doi: 10.1101/cshperspect.a016188. [DOI] [PMC free article] [PubMed] [Google Scholar]
- 16.Powell S, et al. eggNOG v4.0: nested orthology inference across 3686 organisms. Nucleic Acids Res. 2014;42:D231–239. doi: 10.1093/nar/gkt1253. [DOI] [PMC free article] [PubMed] [Google Scholar]
- 17.Katoh K, Toh H. Recent developments in the MAFFT multiple sequence alignment program. Brief. Bioinform. 2008;9:286–298. doi: 10.1093/bib/bbn013. [DOI] [PubMed] [Google Scholar]
- 18.Capella-Gutiérrez S, Silla-Martínez JM, Gabaldón T. trimAl: a tool for automated alignment trimming in large-scale phylogenetic analyses. Bioinforma. Oxf. Engl. 2009;25:1972–1973. doi: 10.1093/bioinformatics/btp348. [DOI] [PMC free article] [PubMed] [Google Scholar]
- 19.Price MN, Dehal PS, Arkin AP. FastTree 2--approximately maximum-likelihood trees for large alignments. PloS One. 2010;5:e9490. doi: 10.1371/journal.pone.0009490. [DOI] [PMC free article] [PubMed] [Google Scholar]
- 20.Gabaldón T, Koonin EV. Functional and evolutionary implications of gene orthology. Nat. Rev. Genet. 2013;14:360–366. doi: 10.1038/nrg3456. [DOI] [PMC free article] [PubMed] [Google Scholar]
- 21.Huerta-Cepas J, et al. PhylomeDB v3.0: an expanding repository of genome-wide collections of trees, alignments and phylogeny-based orthology and paralogy predictions. Nucleic Acids Res. 2011;39:D556–560. doi: 10.1093/nar/gkq1109. [DOI] [PMC free article] [PubMed] [Google Scholar]
- 22.Edgar RC. MUSCLE: multiple sequence alignment with high accuracy and high throughput. Nucleic Acids Res. 2004;32:1792–1797. doi: 10.1093/nar/gkh340. [DOI] [PMC free article] [PubMed] [Google Scholar]
- 23.Subramanian AR, Kaufmann M, Morgenstern B. DIALIGN-TX: greedy and progressive approaches for segment-based multiple sequence alignment. Algorithms Mol. Biol. AMB. 2008;3:6. doi: 10.1186/1748-7188-3-6. [DOI] [PMC free article] [PubMed] [Google Scholar]
- 24.Wallace IM, O’Sullivan O, Higgins DG, Notredame C. M-Coffee: combining multiple sequence alignment methods with T-Coffee. Nucleic Acids Res. 2006;34:1692–1699. doi: 10.1093/nar/gkl091. [DOI] [PMC free article] [PubMed] [Google Scholar]
- 25.Darriba D, Taboada GL, Doallo R, Posada D. ProtTest 3: fast selection of best-fit models of protein evolution. Bioinforma. Oxf. Engl. 2011;27:1164–1165. doi: 10.1093/bioinformatics/btr088. [DOI] [PMC free article] [PubMed] [Google Scholar]
- 26.Stamatakis A. RAxML version 8: a tool for phylogenetic analysis and post-analysis of large phylogenies. Bioinforma. Oxf. Engl. 2014;30:1312–1313. doi: 10.1093/bioinformatics/btu033. [DOI] [PMC free article] [PubMed] [Google Scholar]
- 27.Huerta-Cepas J, Dopazo J, Gabaldón T. ETE: a python Environment for Tree Exploration. BMC Bioinformatics. 2010;11:24. doi: 10.1186/1471-2105-11-24. [DOI] [PMC free article] [PubMed] [Google Scholar]
- 28.Keeling PJ. The number, speed, and impact of plastid endosymbioses in eukaryotic evolution. Annu. Rev. Plant Biol. 2013;64:583–607. doi: 10.1146/annurev-arplant-050312-120144. [DOI] [PubMed] [Google Scholar]
- 29.Fraley C, Raftery AE, Murphy TB, Scrucca L. mclust Version 4 for R: Normal Mixture Modeling for Model-Based Clustering, Classification, and Density Estimation. Department of Statistics, University of Washington; 2012. Technical Report No. 597. [Google Scholar]
- 30.Greenacre M. Correspondence Analysis in Practice. Chapman & Hall; 2007. [Google Scholar]
Associated Data
This section collects any data citations, data availability statements, or supplementary materials included in this article.


