

Abstract
Background
Veno-arterial extracorporeal membrane oxygenation (VAECMO), including central ECMO (cECMO) and peripheral ECMO (pECMO), is widely used in cardiopulmonary surgery. The outcomes and complications of both types of ECMO are quite different from each other. The hemodynamic differences among them are hypothesized as a key factor. Hence, a numerical study was conducted to test this hypothesis.
Material/Methods
Ideal cardiovascular models with pECMO and cECMO were established. The aortic pressure and flow rate were chosen as boundary conditions. The flow pattern, blood flow distributions, flow junction, harmonic index (HI) of blood flow, wall shear stress (WSS), and the oscillatory shear index (OSI) were calculated to evaluate the hemodynamic states.
Results
pECMO could achieve better upper limb and brain perfusion (0.05458 vs. 0.05062 kg/s), and worse lower limb perfusion (0.03067 vs. 0.03401 kg/s). There exist low WSS (<0.4 pa) regions at the inner and posterior wall of the aorta, and high WSS (>2 pa) region at the access of the femoral artery. These regions also have relatively high OSI value (reaching 0.45). In contrast, for cECMO, there exist high WSS at the posterior wall of the aortic arch.
Conclusions
The hemodynamic performances of various types of ECMO are different from each other, which maybe the key reasons for the differences in the outcomes and complications. Therefore, for pEMCO, the lower-extremity ischemia is a complication that must be considered. The type, support level, and duration of ECMO should also be carefully regulated according to the patients’ condition, as they are the important factors related to vascular complications.
MeSH Keywords: Cardiovascular System, Extracorporeal Membrane Oxygenation, Hemodynamics
Background
Veno-arterial extra corporeal membrane oxygenation (VA ECMO) is a common clinical aid for cardiopulmonary surgery [1–4]. Based on the different cannular position, VA ECMO is classified as peripheral ECMO (pECMO) and central ECMO (cECMO) [5]. For pECMO cannulas are inserted both into the right femoral artery and the right common femoral vein [6]. In contrast, cECMO usually has an arterial cannula placed into the ascending aorta and a venous cannula placed in the right atrium [7,8]. Along with the widely uses of peripheral and cECMO, their clinical complications have been studied by more and more researchers. For instance, compared with pECMO, the cECMO was found that it could lead more required re-exploration for bleeding [9] and higher risk of infection [10]. In contrast with cECMO, the pECMO has more complications on the blood perfusion and vascular impair, including lower extremity ischemia, amputation and vascular complication [11]. In addition, more than half of patients appeared complication of limb ischemic with the treatment of pECMO [12–14]. And there is also report that patients undergoing pECMO support through femoral vessels are prone to vascular complications [15]. Although the precise reason on the difference in the complications caused by both types of ECMO, the differences in the hemodynamic states resulted from the different cannular location of both types of ECMO are considered as a key factors.
Computational fluid dynamics (CFD) as an effective method widely used to evaluate the hemodynamic effects of ECMO on cardiovascular system. For instance Kaufmann et al. analysis the hemodynamic effects of the outflow cannula of cECMO by using CFD method [16]. He found that the outflow cannula significantly affected the hemodynamic states in aortic arch. Similarly, Neidlin et al. conducted CFD simulation to study the hemodynamic effect of the distance between the cannula tip and the vertebral artery branch on the cerebral perfusion [17]. Kaufmann et al. proposed a multi-scale model, involving the cerebral autoregulation characteristic, to study the effect of ECMO on cerebral perfusion [18]. Although there are many studies on the hemodynamic effects of ECMO on the cardiovascular system, the hemodynamic difference between peripheral and cECMO is still under investigation.
In order to clarify this problem, numerical studies were conducted. Ideal cardiovascular geometric models with peripheral and cECMO were established based on physiological data. The aortic pressure and flow rate, derived from previous work [19–22], were chosen as the boundary conditions. The flow pattern in the aorta and femoral branches, the distribution of blood flow rate from the aorta to brain and limbs, the distribution of blood flow rate between arterial bifurcations, flow junction, harmonic index (HI) of blood flow (HI is used to evaluate the pulsatility of blood flow in the aorta), wall shear stress (WSS), and the oscillatory shear index (OSI, which is used to evaluate the effects of blood flow on the endotheliocyte in the aorta) were used as the factors to evaluate the hemodynamic states.
Material and Methods
Construction of geometric model
The ideal 3-dimensional geometry model with peripheral and cECMO (Figure 1) was constructed by using the commercial software SolidWorks. Figure 1A and 1B show the models of pECMO and cECMO, respectively. The models consist of the ascending aorta, the innominate artery (IA), left common carotid artery (LCCA), left subclavian artery (LSA), left femoral artery (LFA), right femoral artery (RFA), and the cannula of ECMO. The geometric characteristics of models are derived from the literature [23], as shown in Table 1. A standard arterial cannula (24 Fr) was added to the ascending aorta on the site that is routinely used in clinical practice (Figure 1B). The cannular anastomotic position is about 2 cm below the inlet of the innominate artery on the anterior wall of the aorta, at a 45° angle to the x–y plane.
Figure 1.
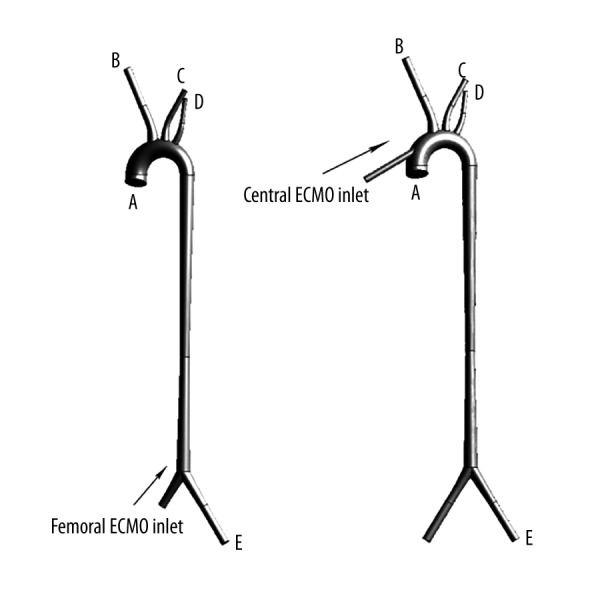
The ideal 3-dimensional geometric model of peripheral and cECMO and related blood vessels. (A) is the model of pECMO and (B) is the model of cECMO.
Table 1.
Vessel sizes of the geometry.
| Location | Diameter | Unit |
|---|---|---|
| A inlet of aorta | 26 | mm |
| B oulet of innominate artery | 10 | mm |
| C outlet of left common carotid artery | 7 | mm |
| D outlet of left subclavian artery | 6 | mm |
| E outlet of left femoral artery | 8 | mm |
Both geometric models were meshed by using HyperMesh commercial software to generate the computational models. Both models are meshed by using tetrahedral elements, in which there are 908 666 elements and 973 949 elements, respectively. Mesh independence tests were conducted for mass flow rate and the maximal error is within 5%; the reasonable accuracy of the computing was confirmed.
Mathematic model
The blood motion is governed by 3-dimensional Navier-Stokes equations:
| (1) |
| (2) |
Where u represents the blood velocity. ρ is the pressure. μ denotes the dynamic viscosity. ρ represents the blood density and F is the volume force field. In all simulation, the blood was set up as a homogeneous, incompressible, and Newtonian fluid flow with ρ=1020 kg/m3 and μ=0.0035kg/m.s. As the mean Reynolds’s number is less than 2300, the blood flow here was assumed as laminar flow. The finite volume method was used to solve Navier-Stokes equations by the transient simulation.
Boundary condition
For studying the hemodynamic effects, the continuous flow of 4 L/min was used as the inlet boundary condition delivered from inlet cannula of both ECMO. Pulsatile flow rates (average value 1 L/min), derived from a validated lumped parameter model (LMP) [24–26], were imposed on inlet of aorta as the inlet boundary conditions (Figure 2). Thus, the total blood perfusion was 5 L/min, which satisfies the physical requirement. The mean blood pressure (70 mmHg) was imposed to the outlets of aorta as the outlet boundary condition.
Figure 2.
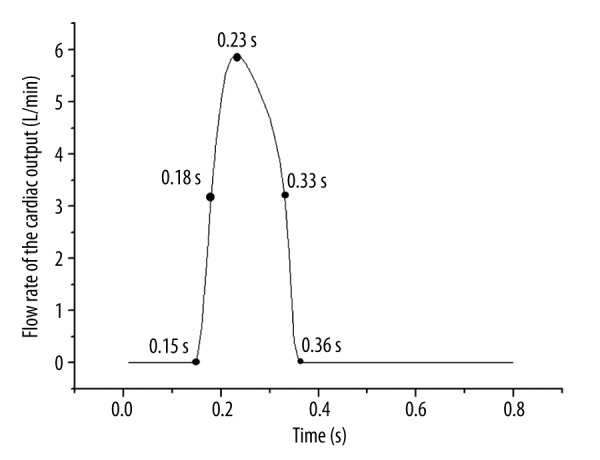
The inlet flow rate waveforms of the aorta and selected time for later analysis.
Definition of indicators of hemodynamic performance
To assess the difference of perfusion condition under both ECMO, blood flow rate ratios (R) of arterial bifurcations was defined as the equation (3):
| (3) |
where Qwessel was the flow rate of the concerning vessel in one cardiac cycle, Qaorta was the flow rate of the cardiac output. Specially, Rup was the ratio of the upper limb and brain blood supply to total blood supply. Rdown was the ratio of the lower limb blood supply to total blood supply. They were defined as equations (4) and (5).
| (4) |
| (5) |
To evaluate the pulsatility of the flow rate, the harmonic index (HI) was proposed. HI was a measure of the relative contribution of non-static intensity to the overall signal intensity, and this parameter ranges from 0 (in the case of a steady nonzero flow rate signal) to 1 (in the case of a purely oscillatory signal with a time average of zero) [27]. HI was defined as the equation (6):
| (6) |
Where T[nwo] was the magnitude of the transformed flow rate signal.
To quantify the magnitude of flow oscillation during cardiac cycle, the oscillatory shear index (OSI) was calculated as the equation (7) [28]:
| (7) |
Where τw was the wall shear stress, T was 1 cardiac cycle. The OSI value can vary from 0 to 0.5, with 0 corresponding to a totally unidirectional WSS and 0.5 to a purely oscillatory WSS. Areas of high OSI were predisposed to endothelial dysfunction [29,30].
Results
Figure 3 shows the flow rate of all the outlets of the cases. Figure 3A shows the mass flow rate of the pECMO. Figure 3B shows the mass flow rate of the cECMO. For both types of ECMO, when the blood is injected from left ventricle into the ascending aorta, the blood flow entering into IA was much higher than at other outlets. Table 2 shows the average mass flow rate of the 2 modes. The average flow rate values of IA and LFA under pECMO were higher than that of cECMO, but the rest of the outlets were the reverse. In addition, for pECMO, RFA was almost blocked by the cannula inlet, so most of the downstream blood went to the LFA. Compared with cECMO, the average flow rate of LFA of pECMO was lower than the sum of average flow rate of LFA and RFA of cECMO(0.03067 <0.03401 kg/s), but the sum average flow rate of IA, LCCA, and LSA under pECMO were higher than that of cECMO (0.05458 >0.05062 kg/s).
Figure 3.
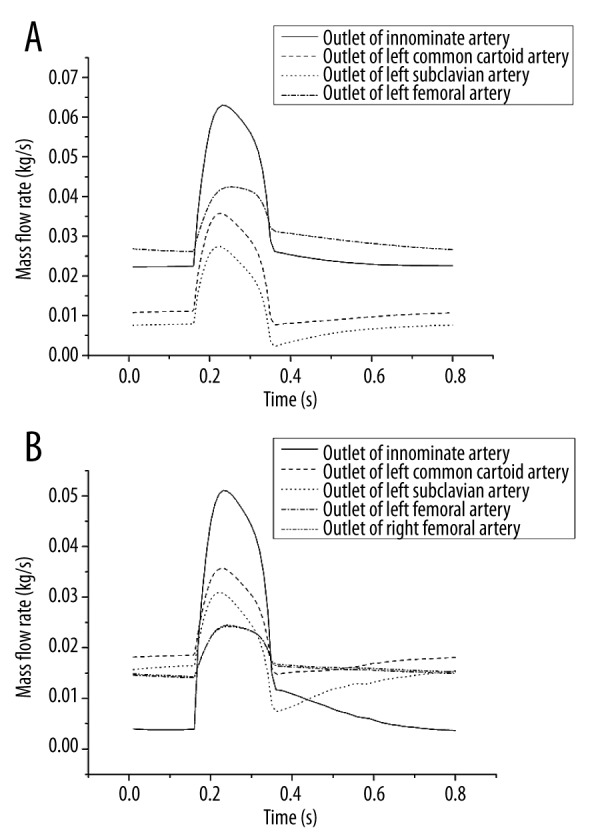
Flow rate of all the outlets of the cases. (A) is the flow rate of pECMO and (B) is the flow rate of cECMO.
Table 2.
Average flow rate of all the outlets of the 2 cases.
| Innominate arery (IA) | Left femoral artery (LFA) | Left common carotid artery (LCCA) | Left subclavian artery (LSA) | Right subclavian artery (RSA) | Unit | |
|---|---|---|---|---|---|---|
| Case 1 | 0.030403 | 0.014311 | 0.009871 | 0.030672 | kg/s | |
| Case 2 | 0.0143 | 0.020145 | 0.01618 | 0.016898 | 0.017108 | kg/s |
Figure 4 shows the flow rate ratio of the 2 modes. Rup was higher under pECMO and Rdown was higher under cECMO. That is, in this study, pECMO has a better perfusion to the upper limb and brain than cECMO, while the downstream perfusion cECMO overshadowed pECMO.
Figure 4.

Flow rate ratio of the 2 modes. A is the Rup of 2 modes of ECMO and B is the Rdown of 2 modes of ECMO.
Table 3 shows the HI of all the flow rate waves of the 2 modes of ECMO. The HI of flow rate of IA and LSA under cECMO was higher than that under pECMO, while HI of flow rate of LFA, LCCA, and LSA under cECMO was lower.
Table 3.
HI of all the flow rate waves of the 2 modes of ECMO.
| Innominate arery (IA) | Left femoral artery (LFA) | Left common carotid artery (LCCA) | Left subclavian artery (LSA) | Right subclavian artery (RSA) | Unit | |
|---|---|---|---|---|---|---|
| Case 1 | 0.6696 | 0.7107 | 0.7346 | 0.628 | kg/s | |
| Case 2 | 0.7787 | 0.6579 | 0.678 | 0.6329 | 0.6321 | kg/s |
Figure 5 shows the velocity vector of the aorta arch and femoral braches at different times under both types of ECMOs. Figure 5A and 5C show the flow pattern under pECMO; similarly, Figure 5B and 5D show the flow pattern under cECMO. Figure 5A shows the obvious blood interface (the circle region) at the aortic arch, due to the different direction of blood injected from heart and cannula of ECMO. Moreover, the location of the interface is changed along with the fluctuation of instantaneous blood flow rate from both inlets. Retrograde blood flow from the cannula of ECMO crash with the antegrade blood flow from left ventricle at the aortic arch forming the interface. For cECMO, the velocity of the blood injected from the cannula was much higher than in other regions (Figure 5B), which causes the vertexes (the arrow location).
Figure 5.

Velocity vector of aorta arch and femoral bifurcation at different times in the 2 modes of ECMO. (A, C) are the velocity vectors of pECMO, while (B, D) are the velocity vectors of cECMO.
At the femoral branch, as the high-speed blood flow is injected from the pECMO cannula, there are vertexes (the arrow location). For cECMO, the blood flow in femoral bifurcation has no vertexes. The results indicate that pECMO has worse hemodynamic conditions at the femoral bifurcation than that supported by cECMO, and there is blood flow junction also observed under pECMO.
Figure 6 shows the wall shear stress (WSS) contours at different times. Figure 6A and 6C show the WSS distribution under pECMO, while Figure 6B and 6D show the WSS distribution under cECMO. In the aortic arch, the WSS under pECMO is significantly lower than that under cECMO, as the high velocity blood flow is injected from the cannula of cECMO. In contrast, WSS at the femoral branch was higher under pECMO compared with that under cECMO, as the blood flow jetted from LFA. Moreover, the high WSS region under both types of ECMO is different. For pECMO, the inner wall of the aortic arch and femoral branch were high WSS regions (reaching 5 pa and 10 pa, respectively), while the region appeared at the posterior wall of aortic arch for cECMO (reaching 10 pa).
Figure 6.

Wall shear stress (WSS) contours at different times in the 2 modes of ECMO. (A, C) are the wall shear stress (WSS) contours of pECMO, while (B, D) are the wall shear stress (WSS) contours of cECMO.
Figure 7 illustrates the change in WSS at special areas along with time during the whole cardiac cycle. At the inside wall of the aortic arch (region 1), WSS under cECMO was lower than that under pECMO. In contrast, at the posterior wall of the aortic arch (region 2), WSS under cECMO was higher than that under pECMO. For the femoral branch (region 3), WSS achieved by pECMO was higher than that achieved by cECMO. Table 4 lists the mean values of WSS at regions 1, 2, and 3 under both types of ECMOs.
Figure 7.
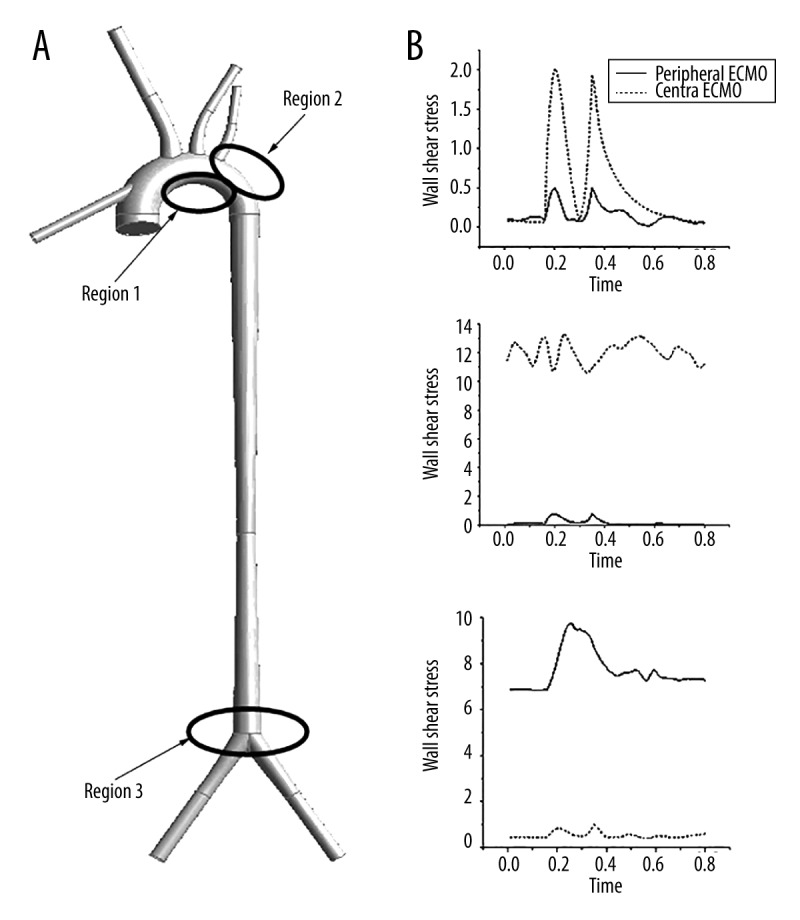
Wall shear stress of selected regions at 1 cardiac cycle. (A) is the selected 3 region, (B) is the wall shear stress of region 1 at 1 cardiac cycle, (C) is the wall shear stress of region 2 at 1 cardiac cycle, and (C) is the wall shear stress of region 3 at 1 cardiac cycle.
Table 4.
Average WSS of regions 1, 2, and 3 of the 2 modes of ECMO.
| Region 1 | Region 2 | Region 3 | Unit | |
|---|---|---|---|---|
| Case 1 | 0.4889425 | 12.041993125 | 0.537955 | Pa |
| Case 2 | 0.153244375 | 0.1875985 | 7.741355375 | Pa |
Figure 8 illustrates the distribution of OSI under both types of ECMOs. Figure 8A shows the OSI distribution under pECMO. Figure 8B shows the distribution of OSI under cECMO. For both types of ECMO, OSI were high (max value is 0.45) at the inner wall of the aortic arch, the descending aorta, and the femoral branch. However, the high OSI regions under both types of ECMO were different from each other. For pECMO, the high OSI region was at the aortic arch closing with the ascending aorta and femoral branch. For cECMO, however, the region was at the aortic arch closing with the descending aorta, showing that high OSIs were usually located in the regions where WSS was low, which agrees with other studies [27].
Figure 8.

OSI of the 2 modes of ECMO. (A) is the OSI of pECMO and (B) is the OSI of cECMO.
Discussion
VA ECMO has been used as an effective method for clinical surgery. For instance, Chen et al. [31] reported that ECMO had become an important method for organ transplants in clinical practice. Besides that, Jennifer et al. [32]. reported that the ECMO is potentially a reliable bridge-to-diagnosis and bridge-to-decision in cardiac amyloidosis patients. Rousse et al. [33] reported that ECMO could be used as a decision method for heart failure patients. Doctors could determine the optimal operation for the patients according to the treatment performance of ECMO. Kapur et al. [34] found that the short-term support by ECMO is a useful operation to improve the survival rate of heart failure patients. Mancio Silva et al. [35] reported that an experienced ECMO team, careful patient selection, and rigorous management protocols with objective criteria to wean or stop ECMO are needed for improving the performance of VA ECMO clinical application. Similarly, Religa et al. [36] applied a short-term ECMO as a bridge-to-bridge helped save the patient from severe cardiogenic shock caused by increased left ventricular afterload. Along with VA ECMO was widely applied in the clinical practice, the complications, including ischemia-reperfused injury [37], hypoxemia, hyper perfusion and vascular complication, attracted more and more attention. Those complications may be contributed to the abnormal hemodynamic states caused by ECMO. Although many studies focus on the hemodynamic effects of ECMO on cardiovascular system, there is no study on the hemodynamic differences between pECMO and cECMO.
This work focuses on the hemodynamic difference between the pECMO and cECMO and explores the relationship of hemodynamic factors and perfusion condition to provide some advice on reducing the risk of hemodynamic complications.
Limb ischemia is a general complication of ECMO leading to limb loss even death in serious cases [38]. And the risk of limb ischemia caused by pECMO is higher than that caused by cECMO. Slottosch et al. [39] reported that 20.8% of the patients undergoing pECMO required treatment of lower limb ischemia. Cheng et al. [11] stated that 16.9% of patients develop lower extremity ischemia and 4.7% of patients have lower extremity amputation for pECMO. Distal perfusion catheters were used to improve this situation [40], while there is still 3.2% of limb ischemia [41]. In addition, the cerebral blood vessels and upper limbs are also at risk of hypoxemia for the patients undergoing pECMO [42], which receive predominantly deoxygenated blood from the left heart [43]. Our results suggest that, pECMO has a better perfusion to the upper limb and brain than cECMO (Figure 4A), while for the downstream perfusion cECMO has advantage over pECMO (Figure 4B). The results of this study are consistence with the previous literatures. And the difference in the distribution of blood flow in each vessel maybe result from the different types of ECMO. Consequently, if the patient supported by the pECMO, the lower extremity ischemia is a complication that must be concerned.
For heart mechanism, a pulsatile circulation is obligatory [44]. The ECMO, however, generated the nonpulsatile blood flow, which may have the negative effects on heart and aorta. Short et al. [45] shown that VA ECMO altered pulsatile blood flow and cerebral autoregulation have the effect on endothelial reactivity in animal models. HI as index evaluating the pulsatility of the flow rate has been recommended that change the flow pattern from nonpulsatile flow to pulsatile flow.
Wall shear stress has been considered an important factor leading vascular remodel. Mean and maximum values of WSS were major factors for endothelial pathology [46,47] and intimal disease [48]. Adel et al. [49] reported that arterial-level shear stress (about 2 pa) is suitable for maintaining the endothelial quiescence and an atheroprotective gene expression profile, while low shear stress (<0.4 pa) that is prevalent at atherosclerosis-prone sites stimulates an atherogenic phenotype. As seen in Table 4, for cECMO, the average WSS of region 2 is much higher than 2 pa. For pECMO, the average WSS of region1 and region 2 is lower than 0.4 pa, while the average WSS of region 3 is much higher than 2 pa. There exist low shear stress (<0.4 pa) at region 1 and region 2 under pECMO. Lower WSS region is prone to develop vasculopathy. Areas of high OSI are predisposed to endothelial dysfunction and atherogenesis. For pECMO, the OSI of the aorta arch and access of femoral artery is higher than cECMO. This results is constant with the findings that pECMO is prone to vascular complications [15].
The duration of the ECMO was conducted was a very important factor to its effects on the vessel. For pECMO, the duration is usually one or two weeks. According to the study on the biomechanical effect of blood flow on the endothelial cell [50], the duration of pECMO was sufficient to active the endothelial function and result in the abnormal function of vessel. Therefore, the abnormal distribution of WSS under pECMO may contribute to the endothelial and vascular dysfunction. In contrast, the cECMO usually was used in the cardiac surgery, which is usually less than 12 hours. Thus, the distribution of WSS under cECMO may have little effects on the vascular disease. Therefore, this paper focuses on the effect of distribution of WSS under pECMO. Moreover, according to hemodynamic theory, the distribution of WSS is regulated by both the type and support level of ECMO. Hence, surgeons should carefully choose the appropriate type and support level of ECMO according to the states of patients. Meanwhile, surgeons should reduce the duration of ECMO as well to reduce the risk of endothelial and vascular dysfunction.
Limitation
The present study is based on an ideal geometric model in which the parameters were from derived from the literature. Because the differences among patients are huge, the ideal geometric model may not be sufficient to clarify the changes in hemodynamic effects of the 2 types of VA ECMO. In the future, the patient-specific models will be established and the realistic boundary conditions collected from clinical practice also would be used to study the hemodynamic differences under the 2 types of VA ECMO support. In addition, the related statistical analysis would be conducted to provide guidance to surgeons.
Conclusions
To clarify the hemodynamic difference between peripheral and cECMO, numerical studies were conducted. Results demonstrated that pECMO had lower perfusion to lower limb than cECMO, which may contribute to the lower extremity ischemia. In addition, the pECMO also has a higher WSS at the bifurcation of the femoral artery, which may induce vascular complications. And for pECMO, OSI of the aorta arch and access of femoral artery are higher than cECMO. These regions are prone to develop vasculopathy. These results may contribute to the findings that pECMO is prone to vascular complications. Moreover, for pECMO, there exists a flow junction in the aorta arch, and it may result in severe flow condition related to disease development. In addition, pECMO has a lower HI than cECMO, and it decreases the pulsatility of the blood flow. Therefore, for peripheral EMCO, the lower-extremity ischemia is a complication that must be considered. The type, support level, and duration of ECMO should also be carefully regulated according to the patients’ condition, as they are important factors related to vascular complications.
Footnotes
Source of support: This work partly sponsored by the National Natural Science Foundation of China (Grant No. 11272022, 11572014, and 91430215). This work was also sponsored by Excellent Talents of Beijing (2013D008018000003), and the Foundation (015000514115003, 015000541115008)
References
- 1.Marasco SF, Esmore DS, Negri J, et al. Early institution of mechanical support improves outcomes in primary cardiac allograft failure. J Heart Lung Transplant. 2005;24(12):2037–42. doi: 10.1016/j.healun.2005.06.007. [DOI] [PubMed] [Google Scholar]
- 2.Fiser S, Tribble CG, Kaza AK, et al. When to discontinue extracorporeal membraneoxygenation for postcardiotomy support. Ann Thorac Surg. 2001;71:210–14. doi: 10.1016/s0003-4975(00)02340-7. [DOI] [PubMed] [Google Scholar]
- 3.Hill JD, O’Brien TG, Murray JJ, et al. Prolonged extracorporal oxygenation of acute posttraumatic respiratory failure(shock-lung syndrome) N Engl J Med. 1972;286:629–34. doi: 10.1056/NEJM197203232861204. [DOI] [PubMed] [Google Scholar]
- 4.Bartlett RH, Roloff DW, Custer JR, et al. Extracorporeal life support: the University of Michigan experience. JAMA. 2000;283:904–8. [PubMed] [Google Scholar]
- 5.Marasco SF, Lukas G, McDonald M, et al. Review of ECMO (extra corporeal membrane oxygenation) support in critically ill adult patients. Heart Lung Circ. 2008;17:S41–47. doi: 10.1016/j.hlc.2008.08.009. [DOI] [PubMed] [Google Scholar]
- 6.Madershahian N, Nagib R, Wippermann J, et al. A simple technique of distal limb perfusion during prolonged femoro-femoral cannulation. J Card Surg. 2006;21(2):168–69. doi: 10.1111/j.1540-8191.2006.00201.x. [DOI] [PubMed] [Google Scholar]
- 7.Hung M, Vuylsteke A, Valchanov K. Extracorporeal membrane oxygenation: coming to an ICU near you. J Intensive Care Soc. 2012;13:31–38. [Google Scholar]
- 8.Klein MD, Andrews AF, Wesley JR, et al. Venovenous perfusion in ECMO for newborn respiratory insufficiency. A clinical comparison with venoarterial perfusion. Ann Surg. 1985;201(4):520–26. doi: 10.1097/00000658-198504000-00019. [DOI] [PMC free article] [PubMed] [Google Scholar]
- 9.Saeed D, Stosik H, Islamovic M, et al. Femoro-femoral versus atrio-aortic extracorporeal membrane oxygenation: selecting the ideal cannulation technique. Artif Organs. 2014;38(7):549–55. doi: 10.1111/aor.12245. [DOI] [PubMed] [Google Scholar]
- 10.MacLaren G, Butt W, Best D, et al. Central extracorporeal membrane oxygenation for refractory pediatric septic shock. Pediatr Crit Care Med. 2011;12(2):133–36. doi: 10.1097/PCC.0b013e3181e2a4a1. [DOI] [PubMed] [Google Scholar]
- 11.Cheng R, Hachamovitch R, Kittleson M, et al. Complications of extracorporeal membrane oxygenation for treatment of cardiogenic shock and cardiac arrest: A meta-analysis of 1,866 adult patients. Ann Thorac Surg. 2014;97(2):610–16. doi: 10.1016/j.athoracsur.2013.09.008. [DOI] [PubMed] [Google Scholar]
- 12.Hines MH. ECMO and congenital heart disease. Semin Perinatol. 2005;29(1):34–39. doi: 10.1053/j.semperi.2004.02.001. [DOI] [PubMed] [Google Scholar]
- 13.Gander JW, Fisher JC, Reichstein AR, et al. Limb ischemia after common femoral artery cannulation for venoarterial extracorporeal membrane oxygenation: an unresolved problem. J Pediatr Surg. 2010;45(11):2136–40. doi: 10.1016/j.jpedsurg.2010.07.005. [DOI] [PMC free article] [PubMed] [Google Scholar]
- 14.Chamogeorgakis T, Lima B, Shafii AE, et al. Outcomes of axillary artery side graft cannulation for extracorporeal membrane oxygenation. J Thorac Cardiovasc Surg. 2013;145(4):1088–92. doi: 10.1016/j.jtcvs.2012.08.070. [DOI] [PubMed] [Google Scholar]
- 15.Bisdas T, Beutel G, Warnecke G, et al. Vascular complications in patients undergoing femoral cannulation for extracorporeal membrane oxygenation support. Ann Thorac Surg. 2011;92(2):626–31. doi: 10.1016/j.athoracsur.2011.02.018. [DOI] [PubMed] [Google Scholar]
- 16.Kaufmann TA, Schlanstein P, Moritz A, et al. Development of a hemodynamically optimized outflow cannula for cardiopulmonary bypass. Artif Organs. 2014;38(11):972–78. doi: 10.1111/aor.12262. [DOI] [PubMed] [Google Scholar]
- 17.Neidlin M, Jansen S, Moritz A, et al. Design modifications and computational fluid dynamic analysis of an outflow cannula for cardiopulmonary bypass. Ann Biomed Eng. 2014;42(10):2048–57. doi: 10.1007/s10439-014-1064-y. [DOI] [PubMed] [Google Scholar]
- 18.Kaufmann TA, Neidlin M, Büsen M, et al. Implementation of intrinsic lumped parameter modeling into computational fluid dynamics studies of cardiopulmonary bypass. J Biomech. 2014;47(3):729–35. doi: 10.1016/j.jbiomech.2013.11.005. [DOI] [PubMed] [Google Scholar]
- 19.Gao B, Chang Y, Xuan Y, et al. The hemodynamic effect of the support mode for the intra-aorta pump on the cardiovascular system. Artif Organs. 2013;37(2):157–65. doi: 10.1111/j.1525-1594.2012.01579.x. [DOI] [PubMed] [Google Scholar]
- 20.Gu K, Chang Y, Gao B, et al. Computational analysis of the effect of the control model of intraaorta pump on ventricular unloading and vessel response. ASAIO J. 2012;58(5):455–61. doi: 10.1097/MAT.0b013e31825f3353. [DOI] [PubMed] [Google Scholar]
- 21.Xuan Y, Chang Y, Gu K, et al. Hemodynamic simulation study of a novel intra-aorta left ventricular assist device. ASAIO J. 2012;58(5):462–69. doi: 10.1097/MAT.0b013e318268eaf7. [DOI] [PubMed] [Google Scholar]
- 22.Xuan YJ, Chang Y, Gao B, et al. Effect of continuous arterial blood flow of intra-aorta pump on the aorta – a computational study. Applied Mechanics and Materials. 2013;275:672–76. [Google Scholar]
- 23.Hong S. Clinic Vascular Anatomy– Atlas of Interventional Angiographic Approach [M] World Publishing Corporation; 2001. [Google Scholar]
- 24.Gu K, Chang Y, Gao B, et al. Lumped parameter model for heart failure with novel regulating mechanisms of peripheral resistance and vascular compliance. ASAIO J. 2012;58(3):223–31. doi: 10.1097/MAT.0b013e31824ab695. [DOI] [PubMed] [Google Scholar]
- 25.Gu K, Gao B, Chang Y, et al. Research on lumped parameter model based on intra-aorta pump. Journal of Medical Biomechanics. 2011;4:020. [Google Scholar]
- 26.Gao B, Gu KY, Zeng Y, et al. A blood assist index control by intraaorta pump: A control strategy for ventricular recovery. ASAIO J. 2011;57(5):358–62. doi: 10.1097/MAT.0b013e3182257fac. [DOI] [PubMed] [Google Scholar]
- 27.Gelfand BD, Epstein FH, Blackman BR. Spatial and spectral heterogeneity of time – varying shear stress profiles in the carotid bifurcation by phase – contrast MRI. J Magn Reson Imaging. 2006;24(6):1386–92. doi: 10.1002/jmri.20765. [DOI] [PubMed] [Google Scholar]
- 28.Zhao X, Liu Y, Bai F, et al. Numerical study on bilateral bidirectional Glenn shunt. Journal of Medical Biomechanics. 2012;27(5):488–94. [Google Scholar]
- 29.Liu X, Fan Y, Deng X, et al. Effect of non-Newtonian and pulsatile blood flow on mass transport in the human aorta. J Biomech. 2011;44(6):1123–31. doi: 10.1016/j.jbiomech.2011.01.024. [DOI] [PubMed] [Google Scholar]
- 30.Nordgaard H, Swillens A, Nordhaug D, et al. Impact of competitive flow on wall shear stress in coronary surgery: computational fluid dynamics of a LIMA-LAD model. Cardiovas Res. 2010;88(3):512–19. doi: 10.1093/cvr/cvq210. [DOI] [PubMed] [Google Scholar]
- 31.Chen TW, Hsieh CB, Chan DC, et al. Marked elevation of hepatic transaminases in recipients of an orthotopic liver transplant from a brain-dead donor receiving extracorporeal membrane oxygenation. Ann Transplant. 2014;19:680–87. doi: 10.12659/AOT.891335. [DOI] [PubMed] [Google Scholar]
- 32.Mancio Silva J, Fontes-Carvalho R, Valente D, et al. Extracorporeal membrane oxygenation as bridge-to-decision in acute heart failure due to systemic light-chain amyloidosis. Am J Case Rep. 2015;16:174–81. doi: 10.12659/AJCR.892772. [DOI] [PMC free article] [PubMed] [Google Scholar]
- 33.Rousse N, Juthier F, Pinçon C, et al. ECMO as a bridge to decision: Recovery, VAD, or heart transplantation? Int J Cardiol. 2015;187:620–27. doi: 10.1016/j.ijcard.2015.03.283. [DOI] [PubMed] [Google Scholar]
- 34.Kapur NK, Esposito M. Hemodynamic support with percutaneous devices in patients with heart failure. Heart Fail Clin. 2015;11(2):215–30. doi: 10.1016/j.hfc.2014.12.012. [DOI] [PubMed] [Google Scholar]
- 35.Mancio Silva J, Fontes-Carvalho R, Valente D, et al. Extracorporeal membrane oxygenation as bridge-to-decision in acute heart failure due to systemic light-chain amyloidosis. Am J Case Rep. 2015;16:174–81. doi: 10.12659/AJCR.892772. [DOI] [PMC free article] [PubMed] [Google Scholar]
- 36.Religa G, Jasińska M, Czyżewski Ł, et al. The effect of the sequential therapy in end-stage heart failure (ESHF) – from ECMO, through the use of implantable pump for a pneumatic heart assist system, Religa Heart EXT, as a bridge for orthotopic heart transplant (OHT). Case study. Ann Transplant. 2014;19:537–40. doi: 10.12659/AOT.891266. [DOI] [PubMed] [Google Scholar]
- 37.Luo Y, Cha DG, Liu YL, et al. Differential effects of selective and non-selective nitric oxide synthase inhibitors on the blood perfusion of ischemia-reperfused myocardium in dogs. Med Sci Monit Basic Res. 2013;19:181–86. doi: 10.12659/MSMBR.883964. [DOI] [PMC free article] [PubMed] [Google Scholar]
- 38.Foley PJ, Morris RJ, Woo EY, et al. Limb ischemia during femoral cannulation for cardiopulmonary support. J Vasc Surg. 2010;52(4):850–53. doi: 10.1016/j.jvs.2010.05.012. [DOI] [PubMed] [Google Scholar]
- 39.Slottosch I, Liakopoulos O, Kuhn E, et al. Outcomes after peripheral extracorporeal membrane oxygenation therapy for postcardiotomy cardiogenic. J Surg Res. 2013;181(2):e47–55. doi: 10.1016/j.jss.2012.07.030. [DOI] [PubMed] [Google Scholar]
- 40.Huang SC, Yu HY, Ko WJ, et al. Pressure criterion for placement of distal perfusion catheter to prevent limb ischemia during adult extracorporeal life support. J Thorac Cardiovasc Surg. 2004;128:776–77. doi: 10.1016/j.jtcvs.2004.03.042. [DOI] [PubMed] [Google Scholar]
- 41.Ganslmeier P, Philipp A, Rupprecht L, et al. Percutaneous cannulation for extracorporeal life support. Thorac Cardiovasc Surg. 2011;59:103–7. doi: 10.1055/s-0030-1250635. [DOI] [PubMed] [Google Scholar]
- 42.Yoda M, Hata M, Sezai A, Minami K. A case report of central extracorporeal membrane oxygenation after implantation of a left ventricular assist system: Femoral vein and left atrium cannulation for ECMO. Ann Thorac Cardiovasc Surg. 2009;15(6):408–11. [PubMed] [Google Scholar]
- 43.Lafc GK, Budak AB, Yener AU, et al. Use of extracorporeal membrane oxygenation in adults. Heart Lung Circ. 2014;23:10–23. doi: 10.1016/j.hlc.2013.08.009. [DOI] [PubMed] [Google Scholar]
- 44.Saito S, Nishinaka T, Westaby S. Hemodynamics of chronic nonpulsatile flow: Implications for LVAD development. Surg Clin North Am. 2004;84(1):61–74. doi: 10.1016/S0039-6109(03)00220-2. [DOI] [PubMed] [Google Scholar]
- 45.Short BL, Walker LK, Bender KS, et al. Impairment of cerebral autoregulation during extracorporeal membrane oxygenation in newbornlambs. Pediatr Res. 1993;33:289–94. doi: 10.1203/00006450-199303000-00018. [DOI] [PubMed] [Google Scholar]
- 46.Qiu Y, Tarbell JM. Numerical simulation of pulsatile flow in a compliant curved tube model of a coronary artery. J Biomech Eng. 2000;122:77–85. doi: 10.1115/1.429629. [DOI] [PubMed] [Google Scholar]
- 47.Fung YC. Biomechanics: Circulation. 2nd ed. New York: SpringerVerlag; 1996. [Google Scholar]
- 48.Zarins CK, Giddens DP, Bharadvaj BK, et al. Carotid bifurcation atherosclerosis. Quantitative correlation of plaque localization with flow velocity profiles and wall shear stress. Circ Res. 1983;53(4):502–14. doi: 10.1161/01.res.53.4.502. [DOI] [PubMed] [Google Scholar]
- 49.Malek AM, Alper SL, Izumo S. Hemodynamic shear stress and its role in atherosclerosis. JAMA. 1999;282:2035–42. doi: 10.1001/jama.282.21.2035. [DOI] [PubMed] [Google Scholar]
- 50.Ando J, Yamamoto K. Vascular mechanobiology: endothelial cell responses to fluid shear stress. Circ J. 2009;73(11):1983–92. doi: 10.1253/circj.cj-09-0583. [DOI] [PubMed] [Google Scholar]