Abstract
The magnitude of the investment required to bring a drug to the market hinders medical progress, requiring hundreds of millions of dollars and years of research and development. Any innovation that improves the efficiency of the drug-discovery process has the potential to accelerate the delivery of new treatments to countless patients in need. “Virtual screening,” wherein molecules are first tested in silico in order to prioritize compounds for subsequent experimental testing, is one such innovation. Although the traditional scoring functions used in virtual screens have proven useful, improved accuracy requires novel approaches.
In the current work, we use the estrogen receptor to demonstrate that neural networks are adept at identifying structurally novel small molecules that bind to a selected drug target, ultimately allowing experimentalists to test fewer compounds in the earliest stages of lead identification while obtaining higher hit rates. We describe 39 novel estrogen-receptor ligands identified in silico with experimentally determined Ki values ranging from 460 nM to 20 μM, presented here for the first time.
Keywords: Estrogen receptor, computer-aided drug discovery, neural network, computer docking
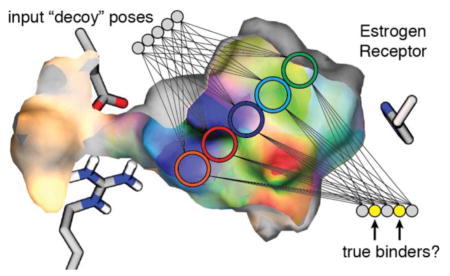
Graphical abstract
Introduction
There is an urgent need for innovative approaches to improve the efficiency of the drug-discovery process. The purpose of the current work is to highlight the potential benefits of applying machine learning, specifically neural networks, to structure-based drug discovery. Artificial neural networks (ANN), first conceived in the 1950s,5 have become popular in recent decades thanks to algorithmic and hardware advances. Although ANN have been applied to drug discovery in the context of ligand-based QSAR (see, for example, ref. 6), they have not traditionally been used in structure-based virtual-screening methods. We here confirm that they are well suited to this important task. Given the ever-growing amount of data available for training7–9 and the recent evolution of GPU-accelerated computation, we believe neural-network-based techniques have the potential to transform the in silico prediction of molecular recognition.
High-throughput biochemical screens are often used to identify pharmacologically active compounds. Although highly automated, these screens require specialized hardware, labor, and carefully managed consumables, making them non-trivial and cost-intensive endeavors that are inaccessible to many researchers in academia and industry. In silico techniques such as virtual screening require only modest computational infrastructure and have become an attractive alternative for lead identification.
Structure-based virtual screening is a two-step process in which a molecule is first docked (i.e., positioned) into a receptor pocket and then evaluated using a scoring function to predict activity. Reliable scoring functions are required to effectively enrich a set of top-predicted binders with potential hits.10–16 Great effort has been dedicated to improving their accuracy, although much room for improvement remains.
Durrant et al. recently created two fast and accurate neural-network scoring functions for rescoring docked ligand poses (NNScore 1.0 and 2.0).17–19 Unlike traditional docking scoring functions, these nonparametric functions are not constrained to predetermined physical formulae or statistical analyses; rather, they “learn” directly from existing experimental data how best to predict binding and so can, in theory, better capture the non-linear, synergistic relationships among binding determinants. To our knowledge, these are the first neural-network scoring functions that predict affinity by directly examining atomic-resolution ligand-protein interactions.
Machine-learning docking rescoring functions in general, and NNScore in particular, have only recently been described in the literature. Initial studies have shown that this class of scoring functions performs well in retrospective studies, as judged by the ability to predict previously determined experimental binding affinities20 or to separate known ligands from a larger library of presumed non-binding decoy molecules.17 However, with some notable exceptions (see, for example, refs. 21–23), these kinds of functions have not been extensively used to prospectively identify novel ligands, as required for drug discovery.
The purpose of the current work is to provide additional evidence that NNScore is in fact well suited to prospective drug discovery. Building on one of our previous studies,17 we here use NNScore to identify 39 novel ligands of the estrogen receptor (ER), the target of several drugs used clinically to treat breast cancer,24, 25 osteoporosis,24 anovulation,26 dyspareunia,27 and male hypogonadism.28
Results and Discussion
Background: Neural Networks
The NNScore scoring function is based on artificial neural networks, machine-learning modules that are designed to mimic, albeit inadequately, the microscopic architecture of the brain. Virtual neurons, called neurodes, are connected by virtual axons, called connections. In brief, information to be analyzed is encoded on a set of neurodes called the input layer. This information is processed as it cascades through the neurodes of the network. The final analysis is encoded on a group of neurodes called the output layer. Neural networks are trained by gradually adjusting the connection strengths until the networks can reliably predict the correct output from a given input.
In previous studies, we trained neural networks to predict small-molecule/receptor binding by first generating numeric “descriptors” of thousands of crystallographic binding poses.18, 19 The descriptors used to train NNScore 1.0 included tallies and categorizations of juxtaposed ligand/receptor atoms, summed electrostatic energies, ligand atom types, and rotatable-bonds counts. Training NNScore 2.0 similarly relied on tallies and categorizations of juxtaposed ligand/receptor atoms and summed electrostatic energies, as well as 1) additional molecular interactions/properties as determined by the BINANA algorithm,29 and 2) physics-based terms borrowed from the AutoDock Vina scoring function.30
Neural networks were trained to predict the strength of binding from these descriptors by fitting against experimentally measured binding affinities. Specifically, NNScore 1.0 was trained to categorize ligands by potency (high-affinity vs. low-affinity binder). In contrast, NNScore 2.0 was trained to predict the binding affinity directly.
Following this training phase, other small-molecule/receptor binding poses to which the networks had never been previously exposed (e.g., from docking studies) could be similarly analyzed. For a given set of binding-pose descriptors, the networks return a score that correlates with the likelihood of high-affinity binding. When a list of docked compounds is ordered by this score, the set of top-ranked molecules is often enriched for true ligands.
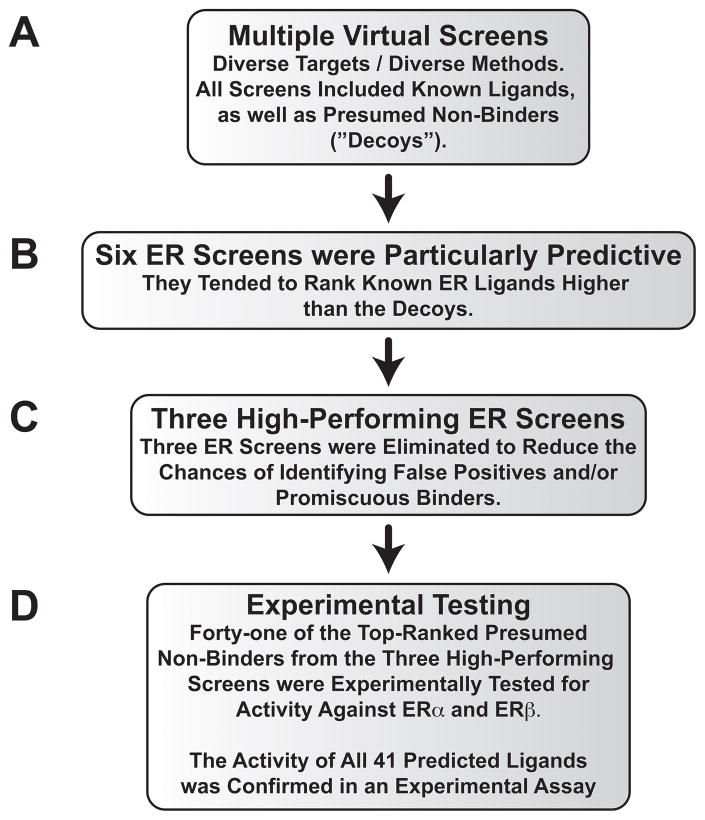
In a recent study, we compared the retrospective virtual-screening performance of NNScore 1.0 and 2.0 across ~40 diverse protein receptors (Figure 1A). This benchmark study suggested that the average performance of NNScore 1.0 is better than that of NNScore 2.0. However, NNScore 2.0 was the superior function for some receptors,17 highlighting the utility of employing multiple scoring functions in any computer-aided drug-discovery (CADD) project.
Figure 1.
The computational/experimental protocol used to identify novel estrogen-receptor ligands.
Background: NNScore Performance against the Estrogen Receptor
The estrogen receptor alpha (ERα) was among the ~40 diverse receptors considered previously.17 Both ERα and the highly homologous ERβ, which differ by only two binding-pocket amino acids31 (56% sequence identity in the ligand-binding domain32), are attractive drug targets.32, 33 These transcription factors are activated by the endogenous steroid hormone 17β-estradiol, leading to gene regulation via binding to specific DNA target sequences. A number of ERα ligands, many of which are non-steroidal, are currently FDA approved for the treatment of osteoporosis,24 breast cancer,24, 25 anovulation,26 dyspareunia,27 and male hypogonadism.28 ERβ is emerging as a promising cancer, cardiovascular, inflammatory, and central-nervous-system drug target.33, 34 Various small molecules, including some approved drugs, act as agonists, antagonists, or mixed-function partial agonist/antagonists. The level of agonist vs. antagonist activity depends on binding-induced ER-receptor conformational changes,2, 3 as well as on the cellular and even tissue context.35
In the previous retrospective virtual-screening study, we used a small-molecule library consisting of known ERα ligands and presumed decoys (e.g., molecules presumed to be non-binders for testing purposes, though without experimental conformation) taken from the Directory of Useful Decoys (DUD)36 and the NCI diversity set III (http://dtp.nci.nih.gov/), respectively. The DUD-set ERα agonists and antagonists were docked into their respective ERα structures in the agonist- or antagonist-bound conformations, as appropriate; the same set of NCI decoys was used for both receptors. For each conformation, seven distinct docking/scoring protocols involving AutoDock Vina,30 Schrödinger’s Glide,37 and NNScore18, 19 were employed.
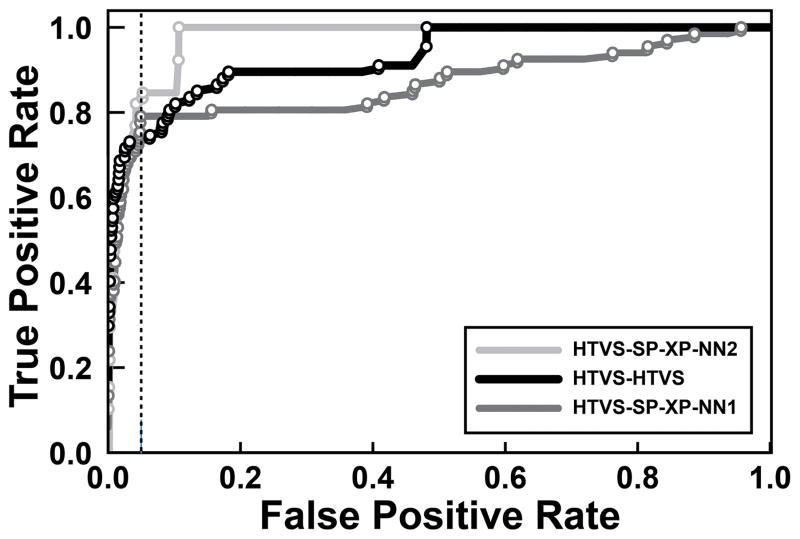
In six of these virtual screens, over ~75% of the known ligands were contained in the set of top-ranking compounds large enough to include 5% of the presumed decoys (i.e., the true positive rate was > ~75% when the false-positive rate was fixed at 5%, Figures 1B and 2). This metric, which we call the “metric of early performance,”17 indicates how well a given scoring function is able to enrich the top-ranking compounds with true ligands.
Figure 2.
The ROC curves associated with each of the three high-performing virtual screens. The data points corresponding to the known ER ligands are shown as circles. The vertical dotted line corresponds to a false positive rate of 5%, used to calculate the early-performance metric.
While the vast majority of the top-ranking “decoy” molecules used in the initial study were certainly not true ERα ligands, in the current study we hypothesize that some might in fact be true binders. By showing that this hypothesis is correct, we provide evidence that NNScore can prospectively identify novel ligands from among decoys and therefore has potential for use in structure-based computer-aided drug discovery.
Ignoring Potentially Promiscuous Top-Ranked Compounds
In previous virtual-screening studies, we have noted that certain molecules have a tendency to frequently appear among the top-ranked compounds, even when targeting diverse and unrelated receptors. There are two possible explanations for this phenomenon. First, these compounds may in fact bind to many diverse targets, in which case they are promiscuous and so are poor candidates for drug discovery. Second, they may in fact be non-binders (false positives) that the scoring functions incorrectly identify as ligands due to inappropriate biases. In either case, such compounds are arguably not worth pursuing.
The six high-performing ERα virtual screens described above identified a number of potentially promiscuous and/or false-positive compounds. Several of the top-ranked compounds were also frequently present among the top-ranked compounds of other high-performing screens from the previously published retrospective study, even though those screens targeted unrelated receptors. To enhance our chances of identifying true and useful ERα ligands, we therefore discarded all virtual “hits” that were found among the top compounds in more than three of the high-performing virtual screens (Figure 1C).
This filtering process had a substantial impact on three of the six high-performing ERα virtual screens. Of the top-ranked compounds from these screens, 14/15 or 15/15 were judged problematic. Given that our goal was to ultimately submit only the top compounds from each screen for experimental testing, we opted to focus exclusively on the other three high-performing ERα screens that were less affected. These screens used the following protocols: 1) compounds were docked with a three-tiered Glide protocol (HTVS/SP/XP) into the ERα antagonist conformation, and then rescored with NNScore 2.0 (HTVS-SP-XP-NN2/Antagonist); 2) compounds were docked and scored with Glide HTVS into the ERα agonist conformation (HTVS/Agonist); and 3) compounds were docked with a three-tiered Glide protocol into the ERα agonist conformation, and then rescored with NNScore 1.0 (HTVS-SP-XP-NN1/Agonist).
It was fortunate that virtual screens against both the agonist- and antagonist-bound ERα structures performed well. When a small molecule approaches its receptor in vivo, it encounters a flexible binding pocket in constant motion, not a single crystalline conformation.38 This is especially true of the highly dynamic estrogen-receptor binding pocket, which can assume different geometries depending on the size and shape of the bound ligand.39, 40 Even a scoring function with perfect accuracy could not identify ligands that bind to pockets with unconsidered geometries. By including multiple structurally diverse receptor conformations in virtual-screening campaigns, ligands with a broader diversity of binding poses can potentially be identified.41
Evidence for the predictive utility of these three virtual screens was apparent even prior to experimental testing, as two known ERα ligands inadvertently included among the 1,560 presumed decoys were correctly identified (genistein, identified by HTVS; and naringenin, identified by both HTVS and HTVS-SP-XP-NN1).
Experimental Confirmation
Forty-one compounds, including genistein and naringenin, were tested experimentally for ERα binding using a competitive radiometric ligand binding assay with an operational sensitivity (limit of detection) of Ki < 20 μM (Figure 1D).42 Remarkably, all molecules predicted to be ERα ligands in silico had experimental Ki values less than 8 3M. Excluding genistein and naringenin, the most potent novel ERα ligands were NCI-19136, NCI-33005, and NCI-13151, with Ki values of 460, 780, and 1380 nM, respectively (Table 1). Each of these compounds was coincidentally found using a different docking protocol, suggesting that applying multiple CADD techniques to a given target can also increase the diversity of the identified ligands.43 Though the virtual screens targeted ERα, a similar experimental assay revealed that all 41 compounds bound to ERβ as well (Ki values ≤ 20 μM). NCI-33005, NCI-13151, and NCI-19136 were notable ERβ binders, with Ki values of 330, 1540, and 2000 nM, respectively (Figure 1D).
Table 1.
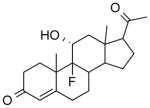
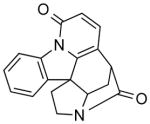
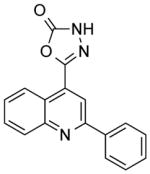
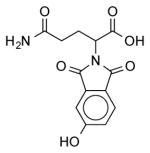
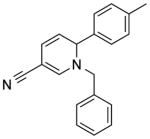
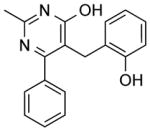
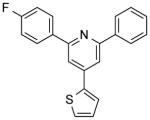
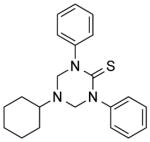
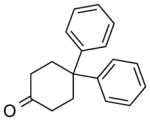
High-affinity compounds found by docking into ERα structures in both the antagonist- and agonist-bound conformations, sorted by the experimentally measured ERα Ki. 2 Additional experimentally validated ligands are described in the Supporting Information.
| Compound | Structure | ERα Ki (μM) | ERβ Ki (μM) | HTVS-SP- XP-NN2 Percentile | HTVS Percentile | HTVS-SP- XP-NN1 Percentile |
|---|---|---|---|---|---|---|
| NCI-19136 (Figure 4A) |

|
0.46 ± 0.004 | 2.00 ± 0.4 | 3.38 | (9.47) | (>12.10) |
| NCI-33005 (Figure 4B) |

|
0.78 ± 0.2 | 0.33 ± 0.1 | (5.07) | 2.95 | (10.88) |
| NCI-36586 (Genistein) |

|
0.79 ± 0.1 | 0.008 ± 0.00008 | (9.69) | 2.27 | (5.10) |
| NCI-13151 (Figure 4C) |

|
1.38 ± 0.3 | 1.54 ± 0.3 | (>12.50) | (25.88) | 2.58 |
| NCI-308849 |

|
1.38 ± 0.1 | 4.83 ± 0.1 | (>12.50) | (10.76) | 2.27 |
| NCI-17128 |
|
1.81 ± 0.4 | 4.91 ± 1.4 | (>12.50) | (9.40) | 3.20 |
| NCI-122253 |
|
1.98 ± 0.2 | 5.29 ± 0.9 | 1.13 | 1.41 | (5.78) |
| NCI-130847 |
|
2.05 ± 0.2 | 6.75 ± 1.5 | 2.19 | (33.74) | (>12.10) |
| NCI-165701 |

|
2.47 ± 0 | 3.16 ± 0.9 | (>12.50) | 3.38 | (5.96) |
| NCI-34875 (Naringenin) |

|
2.56 ± 0.5 | 3.10 ± 0.9 | (4.94) | 2.83 | 3.93 |
| NCI-78623 |
|
2.78 ± 0.8 | 3.99 ± 0.6 | (11.76) | 1.66 | (11.25) |
| NCI-351674 |
|
2.82 ± 0.6 | 8.25 ± 1.4 | (5.13) | 3.69 | (7.68) |
| NCI-12262 |

|
3.08 ± 1.0 | 11.90 ± 0 | (>12.50) | (37.86) | 3.44 |
| NCI-201863 |

|
3.18 ± 0.2 | 7.00 ± 0.4 | 1.38 | (>49.90) | (>12.10) |
| NCI-95909 |

|
3.74 ± 0.9 | 7.48 ± 1.4 | (>12.50) | (5.10) | 1.97 |
| NCI-112541 |
|
4.14 ± 0.9 | 5.26 ± 1.3 | 2.63 | (15.49) | (4.79) |
| NCI-246999 |
|
4.32 ± 1.0 | 3.78 ± 0.1 | 3.13 | (>49.90) | (>12.10) |
| NCI-319709 |
|
5.20 ± 1.2 | 6.88 ± 0.7 | 2.94 | (>49.90) | (>12.10) |
| NCI-117554 |
|
5.25 ± 1.1 | 7.48 ± 1.4 | (5.63) | (5.47) | 3.38 |
| NCI-111847 |

|
5.42 ± 0.4 | 7.43 ± 0.5 | 1.63 | (4.12) | 3.87 |
Note that the compounds themselves were tested only for binding, not for agonism vs. antagonism. For each docking protocol/compound, we report the percentile rank (NCI and DUD compounds considered together). When a given compound did not rank high enough to warrant experimental follow up, the percentile is given in parenthesis. Additionally, a lower bound on the percentile is given for compounds that could not be docked/scored at all. Additional compounds are listed in Tables S1, S2, and S3.
These results suggest that 1) NNScore is well suited to prospective drug-discovery projects targeting this system, and 2) NNScore can complement more classical scoring functions.
Comparison of Docking Methods
Twenty-nine of the 39 novel ligands presented here for the first time were initially identified using one of the two NNScore protocols, 15 were identified using HTVS, and 3 were identified by both methods. The average Ki values of the compounds found using the HTVS-SP-XP-NN2/Antagonist, HTVS/Agonist, and HTVS-SP-XP-NN1/Agonist protocols were 4.12, 3.68, and 4.10 3M, respectively. A one-way ANOVA analysis led us to reject the null hypothesis that these average Ki values were statistically different (p = 0.76), suggesting that the three protocols performed comparably.
Multiple studies have demonstrated that scoring functions are remarkably receptor specific (see, for example, refs 17, 44). Similarly, scoring-function performance may be affected by certain chemical features of the small molecules being screened, especially features used to train the scoring functions themselves. One crude way of measuring potential ligand-based biases is to assess the structural diversity of the ligands identified in a given virtual screen. While scoring functions are not typically trained to maximize ligand diversity, functions that identify a set of validated ligands with substantially reduced structural diversity relative to the source library are perhaps suspect.
While hit diversity can be a useful performance metric, we wish to emphasize its limitations. Screens with low hit diversity are not necessary flawed. One might expect a virtual screen to pull out clusters of structurally analogous true ligands. Similarly, screens with high hit diversity are not necessarily bias free. A scoring function that inappropriately favors compounds with chemical properties that are structure independent (e.g., high molecular weight, high hydrophobicity, etc.) could incorrectly identify false-positive “hits” that are nonetheless structurally diverse. But we do believe that a substantial lack of chemical diversity between compound clusters may in some cases indicate that the associated scoring functions have been over fitted to favor the known, explored, and non-protectable chemotypes that generally comprise scoring-function training sets. Generally speaking, an ideal virtual screen should identify diverse and unique molecules, in addition to identifying high-affinity compounds.
Compound diversity and uniqueness can be assessed by classifying compounds according to molecular scaffolds (e.g., molecular graphs).45–49 The NCI Diversity Set III (NCIDSIII), which contained the structurally diverse presumed decoys used in the retrospective virtual screens, spanned 652 molecular graphs (Table 2). To facilitate subsequent comparison with other compound sets, this count was normalized by the total number of library compounds, giving a unique-framework (diversity) ratio (i.e., structurally distinct scaffoldscount/total number of compoundscount) of 0.42. To put this number into perspective, if each library compound had a unique graph (i.e., optimal diversity), this ratio would be 1.0. In contrast, if all compounds were analogs with the same scaffold (minimal diversity), the ratio would be close to zero.
Table 2.
Chemical-diversity analysis using molecular graphs.
| Compound Set | N [number] | NG [molecular graphs] | NG /N [diversity ratio] | Ns [singleton graphs] | Ns/N [singleton ratio] |
|---|---|---|---|---|---|
| NCI Diversity Set III | 1560 | 652 | 0.42 | 475 | 0.31 |
| HTVS-SP-XP-NN2/Antagonist | 15 | 15 | 1.0 | 15 | 1.0 |
| HTVS/Agonist | 15 | 14 | 0.93 | 13 | 0.87 |
| HTVS-SP-XP-NN1/Agonist | 15 | 13 | 0.87 | 12 | 0.80 |
N = total number of compounds in the library, NG = number of molecular graphs in the library, NG/N = diversity ratio, Ns = number of singleton molecular graph scaffolds, Ns/N = singleton ratio.
As a complementary metric, we also measured the uniqueness of the NCI compounds. 475 molecular graphs were associated with a single compound (i.e., singletons, Table 2). A NCIDSIII singleton ratio of 0.31 was calculated by dividing the number of singletons by the total number of compounds.
We next measured the diversity of the three sets of hits identified using the HTVS-SP-XP-NN2/Antagonist, HTVS/Agonist, and HTVS-SP-XP-NN1/Agonist virtual-screening protocols, respectively. The top hits found using these three methods were comparably diverse. The diversity ratios were 1.0, 0.93, and 0.87, respectively (Table 2). Similarly, the singleton ratios were 1.0, 0.87, and 0.80 for the HTVS-SP-XP-NN2/Antagonist, HTVS/Agonist, and HTVS-SP-XP-NN1/Agonist hits, respectively (Table 2). In all cases, the hits were judged to be even more diverse and enriched in singletons than the NCIDSIII compounds generally.
The fact that our top hits were more diverse and unique than the broader NCIDSIII suggests that the docking protocols used do not unduly favor certain molecular scaffolds.
Binding Poses
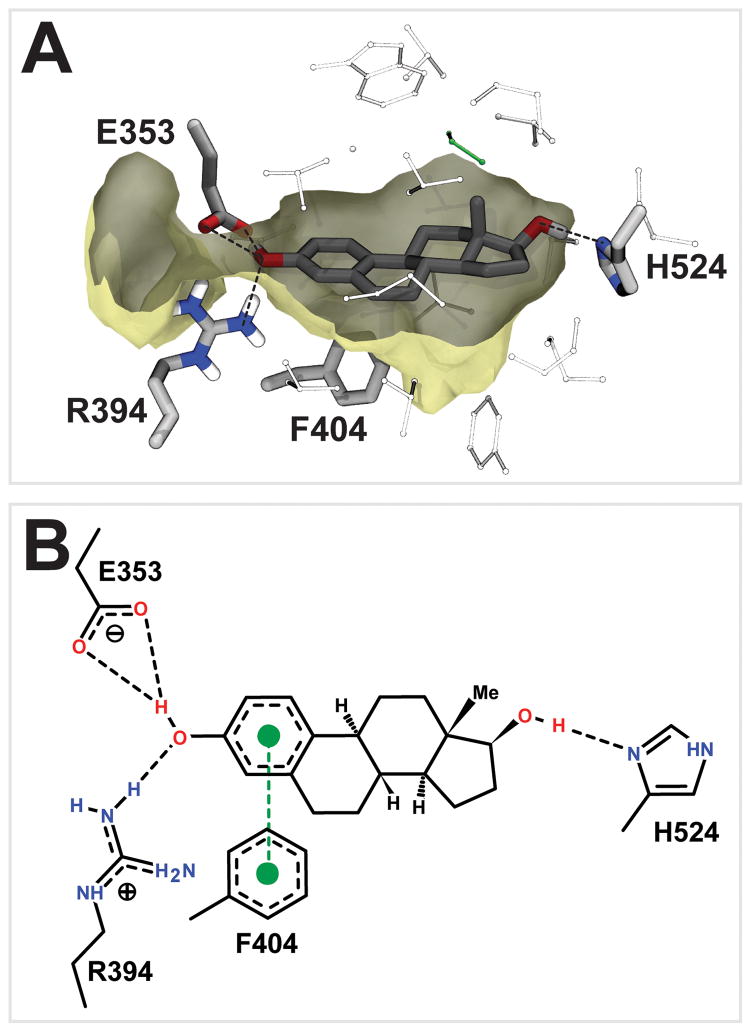
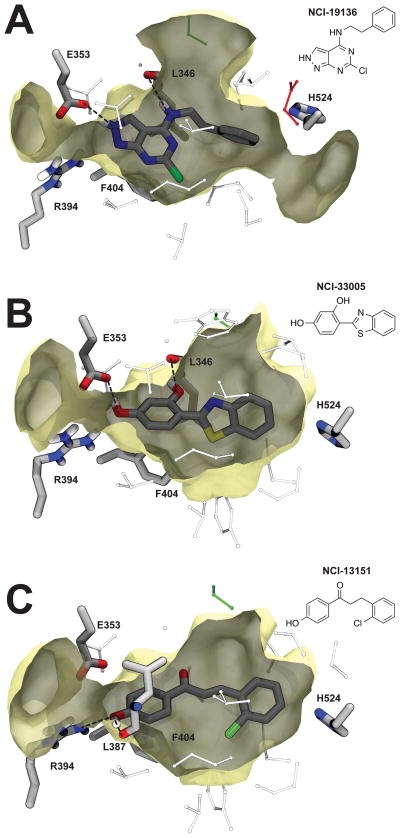
The BINANA algorithm29 was used to identify potential receptor-ligand interactions between the crystallographic pose of estradiol (Figure 3), the native ligand, and the docked poses of NCI-19136, NCI-33005, and NCI-13151 (Figure 4), the three highest affinity novel ERα ligands identified. NCI-33005 and NCI-13151 had very similar docked poses, as did NCI-19136 when the 2H-pyrazole tautomer was considered. Like the native ligand estradiol, NCI-19136 and NCI-33005 are predicted to form hydrogen bonds with residue E353. In contrast, the NCI-13151 pose forms a hydrogen bond with the L387 backbone carbonyl oxygen atom, though a simple rotation of the NCI-13151 hydroxyl group would easily permit a hydrogen bond with E353. Like estradiol, all three ligands may also form T-shaped π-π interactions with F404. NCI-33005 and NCI-13151 may also form a hydrogen bond with R394, just as the estradiol phenyl hydroxyl group does.
Figure 3.
The crystallographic pose of estradiol. A) The 1G50 crystal structure.1 B) A schematic of estradiol binding, modified from output generated by PoseView.4
Figure 4.
Binding poses. A) NCI-19136 docked into the 3ERT antagonist structure.2 Dotted black lines represent hydrogen bonds. B) NCI-33005, docked into the 1L2I agonist structure.3 C) NCI-13151, docked into the 1L2I agonist structure. A potential hydrogen bond with E353 is less certain and so is not shown.
In other ways, the three novel ligands have predicted binding poses unlike that of estradiol. For example, NCI-19136 and NCI-33005 may form additional hydrogen bonds with the L346 backbone carbonyl oxygen atom, and NCI-13151 may form a hydrogen bond with L387, as mentioned above. Also, neither of the novel ligands appears to form a hydrogen bond with H524, apparently failing to exploit one of the interactions characteristic of estradiol binding. Both ligands do extend aromatic moieties in the direction of H524, however. Modifying these moieties so they can approach and interact with H524 may be an effective drug-optimization strategy, though we do note that a number of other ER lig-ands (e.g., afimoxifene2 and raloxifene50) have high binding affinities even in the absence of this interaction.
Conclusion
Although the novel scaffolds presented here may be useful for future drug development, ERα has been extensively studied and is already the target of several highly optimized FDA-approved drugs (e.g., tamoxifen, fulvestrant, and raloxifene). The primary utility of the current work is therefore to demonstrate the remarkable performance of two recently developed neural-network docking rescoring functions,18, 19 which, according to a recent retrospective study, are effective against this target as well as a number of others.17 Herein, we have shown by further computational and experimental analyses that several high-scoring presumed “decoys” indeed bind the receptor target with low micromolar affinity, indicating that these scoring functions are effective when employed prospectively.
Nonparametric machine-learning techniques such as neural networks are often used in ligand-based QSAR, but their application as receptor-centric docking rescoring functions is less common.18-20, 51 These scoring functions take a novel approach to predicting molecular recognition. We believe they can complement more traditional scoring functions, helping to identify lig-and scaffolds that might not be found otherwise.
Materials and Methods
Computational Details
Durrant et al. performed a retrospective virtual-screening benchmark study in 2013 to assess the performance of two novel neural-network-based scoring functions, NNScore 1.0 and NNScore 2.0.17–19 Human estrogen receptor alpha (ERα) in both the agonist- (ERagonist) and antagonist-bound (ERantagonist) conformations were among the ~40 diverse receptors considered. In brief, models of ERagonist and ERantago-nist were prepared from published crystal structures (PDB IDs 1L2I3 and 3ERT,2 respectively). Molecular models of known ERα agonists and antagonists obtained from the Directory of Useful Decoys (DUD)36 were docked into the relevant receptor, together with 1560 diverse small molecules from the NCI diversity set III (http://dtp.nci.nih.gov/) that served as presumed decoys.
Two high-performing ERα virtual screens targeting ERagonist and ERantagonist, respectively, used a multi-step docking protocol. Compounds were first docked into each receptor using Schrödinger’s Glide HTVS, a fast program designed for high-throughput virtual screening. The compounds were then ranked by the docking score, and the top 50% were subsequently docked using Glide SP, a more computationally demanding program thought to be more accurate. The top 50% of the Glide-SP-docked compounds were then docked using Glide XP, Schrödinger’s most rigorous program. Finally, the XP ERagonist and ERantagonist poses were rescored using NNScore 1.018 and NNScore 2.0,19 respectively. These two docking protocols are here called HTVS-SP-XP-NN1/Agonist and HTVS-SP-XP-NN2/Antagonist, respectively. Durrant et al. also obtained an early-performance metric17 of 79% when Glide HTVS alone was used to dock compounds into ERagonist (HTVS/Agonist).
The early performance metric used to assess these three virtual screens was predicated on the assumption that the NCI compounds do not in fact bind to ERα. This assumption is certainly true for the vast majority of these structurally diverse compounds, but it is likely that at least some of the NCI compounds are in fact true ERα ligands. We therefore selected the 15 top-ranked, non-promiscuous NCI compounds from each of the three high-performing ERα virtual screens for subsequent experimental testing. As some compounds ranked well in multiple screens, forty-one molecules were advanced in total.
Experimental Details
Relative binding affinities were determined by a competitive radiometric binding assay with 2 nM [3H]estradiol as tracer (Perkin Elmer, Waltham, MA), as described previously.52 Full-length purified human ERα and ERβ were purchased from Pan Vera/Invitrogen (Carlsbad, CA). Following incubation for 18–24 hours at 0°C, the receptor-ligand complexes were absorbed onto hydroxyapatite (BioRad, Hercules, CA), and unbound ligand was washed away.42 All small molecules tested were taken from the NCI Diversity Set III and so have purities over 90% per LC/Mass Spec.
Affinities were initially expressed as relative binding affinity (RBA) values, where the RBA of estradiol is set at 100%. Under these conditions, the Kd values of estradiol are ~0.2 and ~0.5 nM for ERα and ERβ, respectively. These RBA measurements were reproducible in separate experiments with coefficients of variation of 0.3. The values shown in Table S4 represent the average plus or minus the standard deviation, calculated using two or more independent measurements. The Ki values reported in Table 1 were calculated by dividing the average Kd of estradiol by the RBA, and then multiplying by 100. 53
Chemical Diversity of the Hits
To analyze the chemical diversity and uniqueness of the NCI Diversity Set III, as well as the novel hits identified using the HTVS-SP-XP-NN2/Antagonist, HTVS/Agonist, and HTVS-SP-XP-NN1/Agonist docking protocols, we considered two distinct scaffold representations: Bemis-Murcko frameworks (see the Supporting Information) and molecular graphs (described in the main text). Bemis-Murcko frameworks consist of any ring system and linker groups,48 and molecular graphs consist of nodes (carbon atoms) connected via edges (single bonds). Unlike Bemis-Murcko frameworks, molecular graphs exclude any atom-type or bond-order information. Both the frameworks and graphs were generated using the RDKit package MurckoScaffold.54
Supplementary Material
Acknowledgments
Funding Sources
This work was supported by an NIH Director’s New Innovator Award (DP2-OD007237) and an NSF XSEDE Supercomputer resources grant (RAC CHE060073N) to R.E.A., as well as an NIH grant (DK015556) to J.A.K and an NIH training fellowship (T32ES007326) to T. A. M. Support from the National Biomedical Computation Resource (NBCR, P41 GM103426) is also gratefully acknowledged.
We would like to thank Aaron J. Friedman for performing the original Glide virtual screens.
Abbreviations
- ER
estrogen receptor
- ERα
estrogen receptor alpha
- ERβ
estrogen receptor beta
- NCIDSIII
National Cancer Institute’s Diversity Set III
- ERagonist
estrogen receptor in the agonist-bound conformation
- ERantagonist
estrogen receptor in the antagonist-bound conformation
- DUD
Directory of Useful Decoys
- RBA
relative binding affinity
Footnotes
Author Contributions
All authors contributed to this manuscript, and all have approved the final version.
Competing Interests
The authors declare no competing financial interests.
ASSOCIATED CONTENT
The Supporting Information lists additional experimentally validated ER ligands beyond those found in Table 1. Further experimental results and analyses of molecular diversity/uniqueness are also provided. This material is available free of charge via the Internet at http://pubs.acs.org.
References
- 1.Eiler S, Gangloff M, Duclaud S, Moras D, Ruff M. Overexpression, Purification, and Crystal Structure of Native Er Alpha Lbd. Protein Expression Purif. 2001;22:165–173. doi: 10.1006/prep.2001.1409. [DOI] [PubMed] [Google Scholar]
- 2.Shiau AK, Barstad D, Loria PM, Cheng L, Kushner PJ, Agard DA, Greene GL. The Structural Basis of Estrogen Receptor/Coactivator Recognition and the Antagonism of This Interaction by Tamoxifen. Cell. 1998;95:927–937. doi: 10.1016/s0092-8674(00)81717-1. [DOI] [PubMed] [Google Scholar]
- 3.Shiau AK, Barstad D, Radek JT, Meyers MJ, Nettles KW, Katzenellenbogen BS, Katzenellenbogen JA, Agard DA, Greene GL. Structural Characterization of a Subtype-Selective Ligand Reveals a Novel Mode of Estrogen Receptor Antagonism. Nat Struct Biol. 2002;9:359–364. doi: 10.1038/nsb787. [DOI] [PubMed] [Google Scholar]
- 4.Stierand K, Maass PC, Rarey M. Molecular Complexes at a Glance: Automated Generation of Two-Dimensional Complex Diagrams. Bioinformatics. 2006;22:1710–1716. doi: 10.1093/bioinformatics/btl150. [DOI] [PubMed] [Google Scholar]
- 5.Rosenblatt F. The Perceptron - a Probabilistic Model for Information-Storage and Organization in the Brain. Psychol Rev. 1958;65:386–408. doi: 10.1037/h0042519. [DOI] [PubMed] [Google Scholar]
- 6.Agrafiotis DK, Cedeno W, Lobanov VS. On the Use of Neural Network Ensembles in Qsar and Qspr. J Chem Inf Comp Sci. 2002;42:903–911. doi: 10.1021/ci0203702. [DOI] [PubMed] [Google Scholar]
- 7.Wang R, Fang X, Lu Y, Wang S. The Pdbbind Database: Collection of Binding Affinities for Protein-Ligand Complexes with Known Three-Dimensional Structures. J Med Chem. 2004;47:2977–2980. doi: 10.1021/jm030580l. [DOI] [PubMed] [Google Scholar]
- 8.Wang R, Fang X, Lu Y, Yang CY, Wang S. The Pdbbind Database: Methodologies and Updates. J Med Chem. 2005;48:4111–4119. doi: 10.1021/jm048957q. [DOI] [PubMed] [Google Scholar]
- 9.Hu L, Benson ML, Smith RD, Lerner MG, Carlson HA. Binding Moad (Mother of All Databases) Proteins. 2005;60:333–340. doi: 10.1002/prot.20512. [DOI] [PubMed] [Google Scholar]
- 10.Huang SY, Grinter SZ, Zou XQ. Scoring Functions and Their Evaluation Methods for Protein-Ligand Docking: Recent Advances and Future Directions. Phys Chem Chem Phys. 2010;12:12899–12908. doi: 10.1039/c0cp00151a. [DOI] [PMC free article] [PubMed] [Google Scholar]
- 11.Smith RD, Dunbar JB, Ung PMU, Esposito EX, Yang CY, Wang SM, Carlson HA. Csar Benchmark Exercise of 2010: Combined Evaluation across All Submitted Scoring Functions. J Chem Inf Model. 2011;51:2115–2131. doi: 10.1021/ci200269q. [DOI] [PMC free article] [PubMed] [Google Scholar]
- 12.Plewczynski D, Lazniewski M, Augustyniak R, Ginalski K. Can We Trust Docking Results? Evaluation of Seven Commonly Used Programs on Pdbbind Database. J Comput Chem. 2011;32:742–755. doi: 10.1002/jcc.21643. [DOI] [PubMed] [Google Scholar]
- 13.Wang JC, Lin JH. Scoring Functions for Prediction of Protein-Ligand Interactions. Curr Pharm Des. 2013;19:2174–2182. doi: 10.2174/1381612811319120005. [DOI] [PubMed] [Google Scholar]
- 14.Cheng TJ, Li QL, Zhou ZG, Wang YL, Bryant SH. Structure-Based Virtual Screening for Drug Discovery: A Problem-Centric Review. AAPS J. 2012;14:133–141. doi: 10.1208/s12248-012-9322-0. [DOI] [PMC free article] [PubMed] [Google Scholar]
- 15.Yuriev E, Agostino M, Ramsland PA. Challenges and Advances in Computational Docking: 2009 in Review. J Mol Recognit. 2011;24:149–164. doi: 10.1002/jmr.1077. [DOI] [PubMed] [Google Scholar]
- 16.Meng XY, Zhang HX, Mezei M, Cui M. Molecular Docking: A Powerful Approach for Structure-Based Drug Discovery. Curr Comput -Aided Drug Des. 2011;7:146–157. doi: 10.2174/157340911795677602. [DOI] [PMC free article] [PubMed] [Google Scholar]
- 17.Durrant JD, Friedman AJ, Rogers KE, McCammon JA. Comparing Neural-Network Scoring Functions and the State of the Art: Applications to Common Library Screening. J Chem Inf Model. 2013;53:1726–1735. doi: 10.1021/ci400042y. [DOI] [PMC free article] [PubMed] [Google Scholar]
- 18.Durrant JD, McCammon JA. Nnscore: A Neural-Network-Based Scoring Function for the Characterization of Protein-Ligand Complexes. J Chem Inf Model. 2010;50:1865–1871. doi: 10.1021/ci100244v. [DOI] [PMC free article] [PubMed] [Google Scholar]
- 19.Durrant JD, McCammon JA. Nnscore 2.0: A Neural-Network Receptor-Ligand Scoring Function. J Chem Inf Model. 2011;51:2897–2903. doi: 10.1021/ci2003889. [DOI] [PMC free article] [PubMed] [Google Scholar]
- 20.Ballester PJ, Mitchell JBO. A Machine Learning Approach to Predicting Protein-Ligand Binding Affinity with Applications to Molecular Docking. Bioinformatics. 2010;26:1169–1175. doi: 10.1093/bioinformatics/btq112. [DOI] [PMC free article] [PubMed] [Google Scholar]
- 21.Lindert S, Zhu W, Liu YL, Pang R, Oldfield E, McCammon JA. Farnesyl Diphosphate Synthase Inhibitors from in Silico Screening. Chem Biol Drug Des. 2013;81:742–748. doi: 10.1111/cbdd.12121. [DOI] [PMC free article] [PubMed] [Google Scholar]
- 22.Zhu W, Zhang Y, Sinko W, Hensler ME, Olson J, Molohon KJ, Lindert S, Cao R, Li K, Wang K, Wang Y, Liu YL, Sankovsky A, de Oliveira CA, Mitchell DA, Nizet V, McCammon JA, Oldfield E. Antibacterial Drug Leads Targeting Isoprenoid Biosynthesis. Proc Natl Acad Sci U S A. 2013;110:123–128. doi: 10.1073/pnas.1219899110. [DOI] [PMC free article] [PubMed] [Google Scholar]
- 23.Ballester PJ, Mangold M, Howard NI, Robinson RLM, Abell C, Blumberger J, Mitchell JBO. Hierarchical Virtual Screening for the Discovery of New Molecular Scaffolds in Antibacterial Hit Identification. J R Soc Interface. 2012;9:3196–3207. doi: 10.1098/rsif.2012.0569. [DOI] [PMC free article] [PubMed] [Google Scholar]
- 24.Barrett-Connor E, Mosca L, Collins P, Geiger MJ, Grady D, Kornitzer M, McNabb MA, Wenger NK, Investigators RT. Effects of Raloxifene on Cardiovascular Events and Breast Cancer in Postmenopausal Women. N Engl J Med. 2006;355:125–137. doi: 10.1056/NEJMoa062462. [DOI] [PubMed] [Google Scholar]
- 25.Jordan VC. Fourteenth Gaddum Memorial Lecture - University of Cambridge - January 1993 -a Current View of Tamoxifen for the Treatment and Prevention of Breast Cancer. Br J Pharmacol. 2000;131:221–231. doi: 10.1111/j.1476-5381.1993.tb13840.x. [DOI] [PMC free article] [PubMed] [Google Scholar]
- 26.Pfeifer S, Fritz M, Lobo R, McClure RD, Goldberg J, Thomas M, Pisarska M, Widra E, Schattman G, Licht M, Sandlow J, Collins J, Cedars M, Rosen M, Vernon M, Racowsky C, Davis O, Dumesic D, Odem R, Barnhart K, Gracia C, Catherino W, Rebar R, La Barbera A, Med ASR. Use of Clomiphene Citrate in Infertile Women: A Committee Opinion. Fertil Steril. 2013;100:341–348. doi: 10.1016/j.fertnstert.2013.05.033. [DOI] [PubMed] [Google Scholar]
- 27.Unkila M, Kari S, Yatkin E, Lammintausta R. Vaginal Effects of Ospemifene in the Ovariectomized Rat Preclinical Model of Menopause. J Steroid Biochem Mol Biol. 2013;138:107–115. doi: 10.1016/j.jsbmb.2013.04.004. [DOI] [PubMed] [Google Scholar]
- 28.Shabsigh A, Kang Y, Shabsign R, Gonzalez M, Liberson G, Fisch H, Goluboff E. Clomiphene Citrate Effects on Testosterone/Estrogen Ratio in Male Hypogonadism. J Sex Med. 2005;2:716–721. doi: 10.1111/j.1743-6109.2005.00075.x. [DOI] [PubMed] [Google Scholar]
- 29.Durrant JD, McCammon JA. Binana: A Novel Algorithm for Ligand-Binding Characterization. J Mol Graphics Modell. 2011;29:888–893. doi: 10.1016/j.jmgm.2011.01.004. [DOI] [PMC free article] [PubMed] [Google Scholar]
- 30.Trott O, Olson AJ. Autodock Vina: Improving the Speed and Accuracy of Docking with a New Scoring Function, Efficient Optimization, and Multithreading. J Comput Chem. 2009;31:455–461. doi: 10.1002/jcc.21334. [DOI] [PMC free article] [PubMed] [Google Scholar]
- 31.Chaudhuri KR, Pal S, Brefel-Courbon C. Sleep Attacks' or 'Unintended Sleep Episodes' Occur with Dopamine Agonists - Is This a Class Effect? Drug Saf. 2002;25:473–483. doi: 10.2165/00002018-200225070-00001. [DOI] [PubMed] [Google Scholar]
- 32.Dahlman-Wright K, Cavailles V, Fuqua SA, Jordan VC, Katzenellenbogen JA, Korach KS, Maggi A, Muramatsu M, Parker MG, Gustafsson JA. International Union of Pharmacology. Lxiv. Estrogen Receptors. Pharmacol Rev. 2006;58:773–781. doi: 10.1124/pr.58.4.8. [DOI] [PubMed] [Google Scholar]
- 33.Paterni I, Bertini S, Granchi C, Macchia M, Minutolo F. Estrogen Receptor Ligands: A Patent Review Update. Expert Opin Ther Pat. 2013;23:1247–1271. doi: 10.1517/13543776.2013.805206. [DOI] [PubMed] [Google Scholar]
- 34.Minutolo F, Macchia M, Katzenellenbogen BS, Katzenellenbogen JA. Estrogen Receptor Beta Ligands: Recent Advances and Biomedical Applications. Med Res Rev. 2011;31:364–442. doi: 10.1002/med.20186. [DOI] [PubMed] [Google Scholar]
- 35.Katzenellenbogen BS, Katzenellenbogen JA. Biomedicine - Defining the "S" in Serms. Science. 2002;295:2380–2381. doi: 10.1126/science.1070442. [DOI] [PubMed] [Google Scholar]
- 36.Huang N, Shoichet BK, Irwin JJ. Benchmarking Sets for Molecular Docking. J Med Chem. 2006;49:6789–6801. doi: 10.1021/jm0608356. [DOI] [PMC free article] [PubMed] [Google Scholar]
- 37.Friesner RA, Banks JL, Murphy RB, Halgren TA, Klicic JJ, Mainz DT, Repasky MP, Knoll EH, Shelley M, Perry JK, Shaw DE, Francis P, Shenkin PS. Glide: A New Approach for Rapid, Accurate Docking and Scoring. 1. Method and Assessment of Docking Accuracy. J Med Chem. 2004;47:1739–1749. doi: 10.1021/jm0306430. [DOI] [PubMed] [Google Scholar]
- 38.Gee AC, Katzenellenbogen JA. Probing Conformational Changes in the Estrogen Receptor: Evidence for a Partially Unfolded Intermediate Facilitating Ligand Binding and Release. Mol Endocrinol. 2001;15:421–428. doi: 10.1210/mend.15.3.0602. [DOI] [PubMed] [Google Scholar]
- 39.Katzenellenbogen JA. The 2010 Philip S. Portoghese Medicinal Chemistry Lectureship: Addressing the "Core Issue" in the Design of Estrogen Receptor Ligands. J Med Chem. 2011;54:5271–5282. doi: 10.1021/jm200801h. [DOI] [PMC free article] [PubMed] [Google Scholar]
- 40.Nettles KW, Bruning JB, Gil G, O'Neill EE, Nowak J, Guo Y, Kim Y, DeSombre ER, Dilis R, Hanson RN, Joachimiak A, Greene GL. Structural Plasticity in the Oestrogen Receptor Ligand-Binding Domain. Embo Reports. 2007;8:563–568. doi: 10.1038/sj.embor.7400963. [DOI] [PMC free article] [PubMed] [Google Scholar]
- 41.Durrant JD, McCammon JA. Computer-Aided Drug-Discovery Techniques That Account for Receptor Flexibility. Curr Opin Pharmacol. 2010;10:770–774. doi: 10.1016/j.coph.2010.09.001. [DOI] [PMC free article] [PubMed] [Google Scholar]
- 42.Carlson KE, Choi I, Gee A, Katzenellenbogen BS, Katzenellenbogen JA. Altered Ligand Binding Properties and Enhanced Stability of a Constitutively Active Estrogen Receptor: Evidence That an Open Pocket Conformation Is Required for Ligand Interaction. Biochemistry. 1997;36:14897–14905. doi: 10.1021/bi971746l. [DOI] [PubMed] [Google Scholar]
- 43.Chen Z, Tian GH, Wang Z, Jiang HL, Shen JS, Zhu WL. Multiple Pharmacophore Models Combined with Molecular Docking: A Reliable Way for Efficiently Identifying Novel Pde4 Inhibitors with High Structural Diversity. J Chem Inf Model. 2010;50:615–625. doi: 10.1021/ci9004173. [DOI] [PubMed] [Google Scholar]
- 44.Warren GL, Andrews CW, Capelli AM, Clarke B, LaLonde J, Lambert MH, Lindvall M, Nevins N, Semus SF, Senger S, Tedesco G, Wall ID, Woolven JM, Peishoff CE, Head MS. A Critical Assessment of Docking Programs and Scoring Functions. J Med Chem. 2006;49:5912–5931. doi: 10.1021/jm050362n. [DOI] [PubMed] [Google Scholar]
- 45.Langdon SR, Blagg J, Brown N. Scaffold Hopping in Medicinal Chemistry. Wiley-VCH Verlag GmbH & Co. KGaA; 2013. Scaffold Diversity in Medicinal Chemistry Space; pp. 39–60. [Google Scholar]
- 46.Hu Y, Stumpfe D, Bajorath J. Lessons Learned from Molecular Scaffold Analysis. J Chem Inf Model. 2011;51:1742–1753. doi: 10.1021/ci200179y. [DOI] [PubMed] [Google Scholar]
- 47.Langdon SR, Brown N, Blagg J. Scaffold Diversity of Exemplified Medicinal Chemistry Space. J Chem Inf Model. 2011;51:2174–2185. doi: 10.1021/ci2001428. [DOI] [PMC free article] [PubMed] [Google Scholar]
- 48.Bemis GW, Murcko MA. The Properties of Known Drugs .1. Molecular Frameworks. J Med Chem. 1996;39:2887–2893. doi: 10.1021/jm9602928. [DOI] [PubMed] [Google Scholar]
- 49.Krier M, Bret G, Rognan D. Assessing the Scaffold Diversity of Screening Libraries. J Chem Inf Model. 2006;46:512–524. doi: 10.1021/ci050352v. [DOI] [PubMed] [Google Scholar]
- 50.Brzozowski AM, Pike ACW, Dauter Z, Hubbard RE, Bonn T, Engstrom O, Ohman L, Greene GL, Gustafsson JA, Carlquist M. Molecular Basis of Agonism and Antagonism in the Oestrogen Receptor. Nature. 1997;389:753–758. doi: 10.1038/39645. [DOI] [PubMed] [Google Scholar]
- 51.Durrant JD, Amaro RE. Machine-Learning Techniques Applied to Antibacterial Drug Discovery. Chem Biol Drug Des. 2014;85:14–21. doi: 10.1111/cbdd.12423. [DOI] [PMC free article] [PubMed] [Google Scholar]
- 52.Katzenellenbogen JA, Johnson HJ, Myers HN. Photoaffinity Labels for Estrogen Binding Proteins of Rat Uterus. Biochemistry. 1973;12:4085–4092. doi: 10.1021/bi00745a010. [DOI] [PubMed] [Google Scholar]
- 53.De Angelis M, Stossi F, Carlson KA, Katzenellenbogen BS, Katzenellenbogen JA. Indazole Estrogens: Highly Selective Ligands for the Estrogen Receptor Beta. J Med Chem. 2005;48:1132–1144. doi: 10.1021/jm049223g. [DOI] [PubMed] [Google Scholar]
- 54.Rdkit: Open-Source Cheminformatics. http://www.rdkit.org/
Associated Data
This section collects any data citations, data availability statements, or supplementary materials included in this article.


