

Abstract
Lysophosphatidic acid (LPA) is a signaling molecule that binds to six known G protein-coupled receptors (GPCRs): LPA1–LPA6. LPA evokes several responses in the CNS including cortical development and folding, growth of the axonal cone and its retraction process. Those cell processes involve survival, migration, adhesion proliferation, differentiation and myelination. The anatomical localization of LPA1 is incompletely understood, particularly with regard to LPA binding. Therefore, we have used functional [35S]GTPγS autoradiography to verify the anatomical distribution of LPA1 binding sites in adult rodent and human brain. The greatest activity was observed in myelinated areas of the white matter such as corpus callosum, internal capsule and cerebellum. MaLPA1-null mice (a variant of LPA1-null) lack [35S]GTPγS basal binding in white matter areas, where the LPA1 receptor is expressed at high levels, suggesting a relevant role of the activity of this receptor in the most myelinated brain areas. In addition, phospholipid precursors of LPA were localized by MALDI-IMS in both rodent and human brain slices identifying numerous species of phosphatides (PA) and phosphatidylcholines (PC). Both PA and PC species represent potential LPA precursors. The anatomical distribution of these precursors in rodent and human brain may indicate a metabolic relationship between LPA and LPA1 receptors.
Keywords: lysophosphatidic acid, G protein, coupled receptor, brain, [35S]GTPγS, rodent and human, imaging mass spectrometry
Introduction
Lysophosphatidic acid (LPA, 1- or 2- acyl-sn-glycero-3-phosphate) is a small glycerophospholipid present at a high concentration in blood plasma and at a low concentration in all tissues. It is synthetized as a lysophospholipid component of cell membranes (Pieringer et al., 1967). LPA is an extracellular mediator formed by the action of enzymes such as PLA1, PLA2, autotaxin (ATX) and acyltransferases (reviewed in Bishop and Bell 1988; Gaits et al., 1997; Goetzl and An, 1998; Fukushima et al., 2001; Aoki et al., 2008). PA-selective PLA1, mPA-PLA1α and mPA-PLA1β and one PA-selective PLA2, snpPLA2, can be involved in the pathway of hydrolyzing PA to produce LPA (Gaits et al., 1997; Hiramatsu et al., 2003; Aoki, 2004). LPA species with saturated (palmitoyl (16:0), stearoyl (18:0)) or unsaturated (oleoyl (18:1), linoleoyl (18:2), arachidonoyl (20:4)) fatty acids have been identified in vivo (Gerrard and Robinson, 1989; Tigyi et al., 1995; Fischer et al., 1998). Likewise, it is important to note that these molecules have different biological activities (Tokumura et al., 1994; Jalink et al., 1995; Hayashi et al., 2001; Yoshida et al., 2003), probably because LPA receptors have quite distinct ligand specificities (Erickson et al., 1998; Bandoh et al., 1999). It has been described that LPA containing long chain fatty acids (eg., C16, C18), both saturated and unsaturated, are able to activate LPA1 receptors (Bandoh et al., 2000). Nevertheless, the anatomical distribution of LPA and PL precursors of LPA is unknown. One of the aims of the present study is to identify the anatomical localization of possible precursors of LPA using the matrix-assisted laser desorption/ionization (MALDI) imaging mass spectrometry (IMS) technique. MALDI-IMS was introduced by Caprioli's group (Caprioli et al., 1997) and its development has allowed the anatomical mapping of substances in a tissue sample, which provides valuable information for the understanding of the physiological role of lipids. (Touboul et al., 2004, Fernandez et al., 2011).
LPA is involved in multiple physiological and pathophysiological actions (reviewed in Fukushima et al., 2001; Tigyi and Parrill, 2003; Aoki, 2004; Ishii et al., 2004). LPA signaling is mediated by specific G protein-coupled receptors (LPA1-6) (Hecht et al., 1996; An et al., 1998; Bandoh et al., 1999; Contos et al., 2000; Lee et al., 2000; Noguchi et al., 2003; Kotarsky et al., 2006; Kihara et al., 2014, Yung et al., 2014). LPA receptors are more highly expressed in the CNS than in other tissues such as kidney, liver, testis, lung and heart (Das and Hajra, 1989; Sugiura et al., 1999; Weiner et al., 1998; Contos et al., 2000). LPA receptors are expressed in most cell types of the CNS, including neuronal progenitors (Hecht et al., 1996), primary neurons (Jalink et al., 1993; Tigyi et al., 1996), astrocytes (Shano et al., 2008), microglia (Moller et al., 2001; Tham et al., 2003), oligodendrocytes (Allard et al., 1999; Weiner et al., 1998) and Schwann cells (Allard et al., 1999; Weiner and Chun 1999). The functions mediated by LPA receptors in CNS have been analyzed by studies on injured neural tissue (Ye et al., 2002), by the exogenous application of LPA to neural tissue that induces relevant responses in the development and function of the CNS (Kranenburg et al., 1999; Ishii et al., 2000; Fukushima et al., 2002; Sun et al., 2011), or by the analysis of genetic null mice lacking LPA receptors (reviewed in Choi and Chun, 2013). Furthermore, they have made it possible to demonstrate that LPA1 receptor expression is related to several developmental processes within the CNS, including cortical development and function (Harrison et al., 2003; Estivill-Torrús et al., 2008), growth and folding of the cerebral cortex (Kingsbury et al., 2003), neuronal migration (Fukushima et al., 2002) and myelination (reviewed in Tigyi et al., 1995; Hecht et al., 1996; Weiner et al., 1998; Contos et al., 2000; García-Díaz et al., 2014). Finally, in vitro studies have demonstrated that primary neurons and Schwann cells can synthesize and secrete LPA (Fukushima et al., 2000; Weiner et al., 2001).
Little is known about the role of LPA receptor signaling in neurotransmission, but the study of genetically modified mice by deletion of LPA receptors has led to considerable advances in the study of their functions in the CNS. It has been demonstrated that LPA1 receptors are involved in pain transmission in the peripheral nervous system (Renback et al., 2000; Inoue et al., 2004). Furthermore, other studies have identified LPA1 signaling as a mediator of hypoxic damage in the fetal brain and in the initiation of fetal hydrocephalus (Herr et al., 2011; Yung et al., 2011). It is well known that LPA1 receptors are located in many tissues, particularly in brain where the anatomical distribution of these receptors is still being researched. Therefore, we have performed [35S]GTPγS functional autoradiography assays in rat, mouse and human brain with the aim of obtaining more information about the anatomical localization of this type of receptors and of their activity in humans and in rodents. The [35S]GTPγS binding assay measures the level of G protein activation following agonist occupation of a GPCR (Sim et al., 1997). In addition, we have performed MALDI-IMS assay in rodent and human to identify possible PL precursors. The present study contributes to the understanding of the biosynthetic pathways of LPA in human brain.
Materials and methods
Chemicals
[35S]GTPγS (initial specific activity 1250 Ci/mmol) was purchased from Perkin Elmer (Boston MA, USA). Oleoyl-L-α-lysophosphatidic acid sodium salt was obtained from Sigma-Aldrich, (St. Louis, MO, USA), Ki16425 was purchased from Selleckchem (Houston, TX, USA), 2-mercaptobenzothiazole (MBT) was acquired from Sigma-Aldrich (St. Louis, MO, USA). The [14C]-microscales used as standards in the autoradiographic experiments were acquired from Amersham Biosciences-GE (Buckinghamshire, UK) and ARC (St. Louis, MO, USA), BSA (A4503), DL-dithiothreitol (DTT), guanosine-5′-diphosphate (GDP) and guanosine-5′-o-3-triphosphate were provided by Sigma (St. Louis, MO, USA) and the β-radiation sensitive films, Kodak Biomax MR, were supplied by Sigma. Finally, for the preparation of the different buffers, the treatment of slides and film development, all the compounds were of the highest commercially available quality.
Animals and tissue preparation
The wild-type (WT; n=8) mice and maLPA1-null homozygous mice (KO; n=8) used in this study were obtained from a spontaneously established LPA1-null mouse colony, termed maLPA1-null (from Málaga variant of LPA1-null) and maintained in the hybrid C57BL/6J × 129X1/SvJ background. As was previously described (Estivill-Torrús et al. 2008; Matas-Rico et al. 2008), the LPA1-null mice lineage spontaneously occurred during the original colony expansion (Contos et al., 2000). Three month-old wild-type and maLPA1-null male mice were used. Although no littermates were used within a group, littermates were used across groups. These were obtained from the ECAI (common support structures for research) of Animal Experimentation, at the Biomedical Research Institute of Málaga (IBIMA), where their brains were removed and dissected. All the animals were housed with a 12-h light/dark cycle, with water and food provided ad libitum. Experimental protocols were approved by the Local Ethical Committee for Animal Research of the University of Málaga (2012-0001 (2009-0001)) and the University of the Basque Country (CEIAB/21/2010/Rodriguez Puertas).
Male Sprague–Dawley rats (225-275 g) were used. Rats were housed under a 12:12 h light:dark cycle, at 22°C and 65% humidity, with food and water provided ad libitum. Every effort was made to minimize animal suffering and to use the minimum number of animals. Experimental protocols were approved by the Local Ethical Committee for Animal Research at the University of the Basque Country (CEBA/91/2010/Rodriguez Puertas).
All procedures were performed in accordance with European animal research laws (European Communities Council Directives 2010/63/UE, 90/219/CEE, Regulation 1946/2003) and the Spanish National Guidelines for Animal Experimentation and the Use of Genetically Modified Organisms (RD 53/2013 and 178/2004 and D 320/2010; Law 32/2007 and 9/2003).
Rodent brains were quickly removed by dissection after anaesthesia. Then tissues were frozen on dry ice, and kept at -80°C. The brains were cut on a Microm HM550 cryostat (Walldorf, Germany) to obtain 20 μm sections that were mounted onto gelatin-coated slides and stored at -20°C until used.
Postmortem human brain samples
Postmortem human brain tissue samples were obtained from the tissue bank of the Neuropathology Institute of The University Hospital of Bellvitge, Barcelona.
Tissue collection and tracking of medical records were conducted in strict confidentiality at all times and following ethical protocols adopted for post-mortem studies (CEISH/244/2014/Rodriguez Puertas). Brain tissue from 8 male patients, without neuropsychiatric or neurological disease in their medical records, was used as control. The mean ± SD of age was 53 ± 8 years and the postmortem delay was 6 ± 3 h. The samples correspond to tissue containing the following brain areas: frontal cortex (Brodmann area 8), amygdala, basal forebrain, striatum, hippocampus and the adjacent entorhinal cortex.
Postmortem human brain samples, following autopsy, were kept at -80°C and were brought to -20°C to be cut on a cryostat in sections of 20 μm that were mounted onto gelatin-coated slides and stored at -20°C until the binding and/or IMS experiments.
[35S]GTPγS binding assay
Sections were air-dried for 15 min, followed by preincubation in HEPES-based buffer (50 mM HEPES, 100 mM NaCl, 3 mM MgCl2 and 0.2 mM EGTA, BSA 0.5%, pH 7,4) for 30 min at 30°C in a water bath. The preincubation was repeated a second time in a new buffer. The samples were then incubated for 2 h at 30°C in a similar buffer, but which was supplemented with 2 mM GDP, 1 mM DTT, adenosine deaminase (3 mU/ml) and 0.04 nM [35S]GTPγS. The evaluation of [35S]GTPγS basal binding was duplicated by using consecutive slices on different slides. Agonist-stimulated binding was measured under the same conditions in the presence of the selective agonist LPA (10-5 M). The LPA antagonist, Ki16425 (10-5 M), was used together with LPA on a consecutive slide. Non-specific binding was determined in the presence of 10 μM of non-labelled GTPγS on another consecutive slide. Sections were washed twice in HEPES buffer 50 mM (pH 7.4), dipped in distilled water and air-dried. Sections were exposed to Kodak Biomax MR autoradiography film, together with 14C standards for 48 h at 4°C in a hermetically closed cassette.
Image analysis of film autoradiograms
Films were scanned and quantified by transforming the optical densities into nCi/g tissue equivalent (nCi/g t.e.) using NIH-image software (NIH-IMAGE, Bethesda, MA, USA; developed at the U.S National Institutes of Health and freely available on internet at http://rsb.info.nih.gov/nih-image/). This software defines the optical density of an anatomical area from 0 (white) to 256 (black). The [14C]- microscales that were co-exposed together with the slides were used to calibrate the optical densities with the level of radioactivity labeled in the sections.
Thionine staining
Thionine staining was performed to facilitate the identification of neuroanatomical structures, adjacent sections to those used in [35S]GTPγS autoradiography or MALDI-IMS experiments. Tissues mounted onto gelatine-coated slides were hydrated after thawing. Hydration was performed by incubating tissues for 5 minutes in ethanol concentrations in descending order (100%, 96%, 70% and 50%), then sections were submerged in thionine solution for 5 min. Finally, tissues were washed with deionized water and introduced in an ethanol ascendant order solution (50%, 70%, 96% and 100%) to dehydrate the tissue.
Sample preparation for MALDI-IMS
It is fundamental that the original lipid composition and anatomical characteristics of the tissue are preserved throughout the sample-preparation process (Schwartz et al., 2003). The brains were cut on a Microm HM550 cryostat to obtain 20 μm sections and stored at -20°C until the experiment. Once the initial steps of tissue preparation had been completed the matrix was deposited on the tissue surface by sublimation, prior to analysis. For tissue sections mounted on glass slides, sublimation was performed using 300 mg of MBT, by controlling the deposition time and temperature (30 min, 140°C) and the thickness of the matrix layer and by optimizing the signal noise (S/N) ratio of the mass spectra. The sublimation process does not require organic solvents to dilute the chemical matrix, therefore we avoided lipid migration on the tissue slice.
Finally, a re-crystallization of the sample was performed, using a normal glass Petri plate (100 mm diameter × 15 mm depth). A matrix sublimated slide was attached to a stainless steel plate and then 1 ml of methanol (99%) was added to the piece of paper previously placed in the bottom of the Petri plate in order to create a vapor for the re-crystallization process on a hot plate (1 min, 40°C). This step allows one to achieve higher intensities in the detection of the peaks (Yang and Caprioli, 2011).
Mass spectrometer
A MALDI LTQ-XL-Orbitrap (Thermo Fisher, San Jose, CA) equipped with a nitrogen laser (λ = 337 nm, rep. rate = 60 Hz, spot size = 80 × 120 μm) was used for mass analysis. Thermo's ImageQuest and Xcalibur software were used for MALDI-IMS data acquisition. The images were acquired in both negative and positive ion mode. The positive ion range was 500–1000 Da, with 10 laser shots per pixel at a laser fluence of 15 μJ. The negative ion range was 400–1100 Da, with 10 laser shots per pixel at a laser fluence of 15 μJ. The target plate stepping distance was set to 150 μm for both the x- and y-axes by the MSI image acquisition software. The mass resolution was 100,000 in both positive and negative ion mode. As there may be potential displacement of the masses on the tissue due to surface irregularities and other factors, it is necessary to normalize them using the total ion current (TIC).
Image and spectrum analysis for MALDI-IMS
The MALDI images were generated using ImageQuest software (Thermo Scientific). With this software, the m/z range is plotted for signal intensity for each pixel (mass spectrum) across a given area (tissue section). The m/z range of interest was normalized by a ratio of the TIC for each mass spectrum, improving the quality of the images. After normalization of the spectra, the average intensity of each peak was calculated using OriginPro 8 (Northampton MA, USA) software.
Peaks or m/z values assignment to lipid species
The tissue samples analyzed in the present study are complex, containing a large number of lipids that could share similar masses in a quite narrow range of m/z values. Therefore, the experimental m/z values for every peak position were compared to previous assignments of different lipid species using databases such as Lipid MAPS (http://www.lipidmaps.org/) and Madison Metabolomics Consortium and previous published studies, using a 5 ppm mass accuracy as the tolerance window for the assignment. The numbers (x:y) following the glycerolipid species, denote the total length and the number of double bonds of the acyl chains.
Data and statistical analyses
The data corresponding to [35S]GTPγS binding stimulated by the different agonists over the basal values were calculated as net stimulations following the formula: net stimulation (nCi/g) = [35S]GTPγS agonist-stimulated binding - [35S]GTPγS basal binding. Data obtained from the autoradiographic studies were expressed as mean values ± SEM. The differences between brain regions and/or genotypes were analyzed by two-tailed Student's t test. The results were considered significant when p ≤ 0.05.
In MALDI-IMS spectra, the peak with the highest intensity was regarded as 100% (798.5410 PC(34:1)+K+ in positive ion mode, and 885.5494 PI(38:4) and 888.6240 ST(24:1) in gray matter and white matter, respectively, in negative ion mode) and the intensity of the rest of the peaks was expressed as % of the maximum peak intensity. Data were expressed as mean values of % ± SEM and analyzed by Microsoft Excel 2007.
Results
[35S]GTPγS binding assay in mice brain sections
[35S]GTPγS basal binding was obtained in the absence of the agonist and was measured in both 3 month-old maLPA1-null and WT mice. The data obtained for the basal binding were also important for LPA1 receptor mediated effects, since there was an apparent basal signal in brain areas including myelinated white matter. It was found that the deletion of LPA1 receptor in maLPA1-null mice decreased [35S]GTPγS basal binding in some areas of white matter (WM), such as the bundles of fibers in the WM of the cerebellum (WT 282.0 ± 12.6 nCi/g t.e. vs KO 119,4 ± 7.4 nCi/g t.e., p < 0.01), corpus callosum (WT 640.8 ± 28.5 nCi/g t.e. vs KO 175.2 ± 9.8 nCi/g t.e., p < 0.01) and internal capsule (WT 360.6 ± 24.9 nCi/g t.e vs KO 99.1 ± 16.9 nCi/g t.e, p < 0.01), suggesting that LPA1 receptor activity could be another source of basal activity especially evident in the most myelinated white matter areas, e.g. the corpus callosum, the internal capsule and the cerebellum bundles of fibers (Table 1 and Fig. 1).
Table 1.
Autoradiographic densities for the basal binding of [35S]GTPγS in mouse brain (nCi/g t.e).
|
|
||
|---|---|---|
| Basal binding (nCi/g t.e.) | ||
|
| ||
| Brain region | WT | KO |
| Amygdala | 228.5 ± 42.2 | 244.7 ± 44.7 |
| Cerebellum | ||
| White matter | 282.0 ± 12.6 | 119.4 ± 7.4** |
| Gray matter | 194.1 ± 18.6 | 101.2 ± 17.3** |
| Corpus callosum | 640.8 ± 28.5 | 175.2 ± 9.8** |
| Striatum | 469.1 ± 52.3 | 326.2 ± 21.8* |
| Frontal cortex | ||
| Layer I-III | 290.8 ± 32.4 | 228.3 ± 18.2 |
| Layer IV | 295.5 ± 37.2 | 255.0 ± 17,3 |
| Layer V | 328.8 ± 26.9 | 240.3 ± 16.8 |
| Layer VI | 406.3 ± 24.2 | 224.3 ± 19.9** |
| Hippocampus | ||
| Dorsal CA1 radiatum | 297.9 ± 18.4 | 318.8 ± 7.4 |
| Ventral CA3 radiatum | 276.2 ± 20.5 | 209.0 ± 9,9 |
| Internal capsule | 360.6 ± 24.9 | 99.1 ± 16.9** |
| Globus pallidus | 373.5 ± 43.5 | 256.8 ± 14.4 |
Data are mean ± SEM values, from 5 WT and 5 KO animals, in nanocuries per gram of tissue equivalent. The p values were calculated by two-tailed Student's t test,
p ≤ 0.05,
p ≤ 0.01.
Fig. 1.
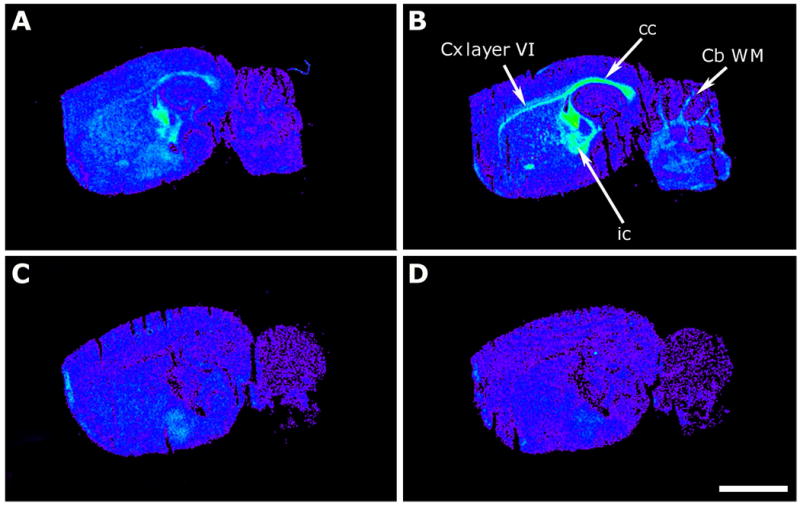
Representative autoradiograms of WT (A,B) and maLPA1-null (C,D) mice in sagittal sections that show [35S]GTPγS basal binding (A,C) and stimulated by LPA (10-5 M) (B,D). Note that the basal binding in WT mice has an anatomical localization pattern similar to the LPA stimulations and that there is no [35S]GTPγS binding in maLPA1-null mice. Cb WM, cerebellum white matter; cc, corpus callosum; Cx layer VI, cortex layer VI; ic, internal capsule. Scale bar = 3 mm.
In addition, we analyzed [35S]GTPγS binding stimulated by the lysophosphatidic agonist, oleoyl-L-α-lysophosphatidic acid sodium salt, in the maLPA1 null and WT mice. Firstly, and in addition to the genotyping, the analysis of receptor activity in maLPA1-null mice allowed us to confirm the deletion of the LPA1 receptor given the resulting absence of any LPA-mediated increase of the [35S]GTPγS binding. The results obtained from the WT mice gave us precise information about the anatomical localization of LPA1 receptors in mice brain, by measuring their ability to activate Gi/o proteins. The highest stimulation induced by LPA over the basal values was obtained in white matter tracts of fibers (Fig. 1 and Table 2). We express the percentage over the basal in corpus callosum (WT 166.9 ± 29.2 % vs KO 0.8 ± 9.3%, p < 0.01), cerebellum WM (WT 76.4 ± 33.0 % vs KO 1.1 ± 25.1 %, p < 0.01) and internal capsule (159.2 ± 39.9 % vs KO -30.0 ± 14.4 %, p < 0.01).
Table 2.
Net [35S]GTPγS binding stimulated by LPA over the basal values, in WT and maLPA1-null mouse brain.
|
|
||
|---|---|---|
| Net LPA-evoked binding (nCi/g t.e) | ||
|
| ||
| Brain region | WT | KO |
| Amygdala | 53.6 ± 52.8 | 45.3 ± 46.1 |
| Cerebellum | ||
| White matter | 176.4 ± 67.7 | - 29.2 ± 22.6** |
| Gray matter | 78.3 ± 72.3 | - 6.8 ± 19.1 |
| Corpus callosum | 1110.2 ± 247.9 | 1.0 ± 16.2** |
| Striatum | 237.1 ± 113.7 | - 17.42 ± 42.5* |
| Frontal cortex | ||
| Layer I-III | - 10.2 ± 13.8 | - 37.7 ± 42.9 |
| Layer IV | - 4.1 ± 25.6 | - 23.5 ± 42.5 |
| Layer V | 56.3 ± 17.0 | - 60.1 ± 27.2* |
| Layer VI | 247.0 ± 32.6 | - 56.6 ± 32.6** |
| Hippocampus | ||
| Dorsal CA1 radiatum | 17.1 ± 33.5 | - 67 ± 95 |
| Ventral CA3 radiatum | 123.7 ± 79.6 | - 20.2 ± 24.3 |
| Internal capsule | 501.5 ± 140.4 | - 18.5 ± 18.6** |
| Globus pallidus | 140.6 ± 75.1 | 16.6 ± 64.8 |
Net LPA-evoked binding (nCi/g t.e) = [35S]GTPγS LPA-stimulated binding - [35S]GTPγS basal binding. Data are mean ± SEM values, in nanocuries per gram of tissue equivalent. The p values were calculated by two-tailed unpaired Student's t test,
p ≤ 0.05,
p ≤ 0.01
[35S]GTPγS binding assay in rat brain sections
[35S]GTPγS binding stimulated by LPA acting as an agonist (oleoyl-L-α-lysophosphatidic acid sodium salt) was analyzed in rat brain slices. The results were similar to those obtained in WT mice. The highest stimulations were found all over white matter areas composed of myelinated fibers tracts. The data obtained, expressed in percentage over the basal in cerebellum WM were: 39.5 ± 13 %, in corpus callosum: 67.1 ± 0.3 % and in the internal capsule: 43.0 ± 2.0 % (Table 3 and Figs. 2 and 3). Ki16245, an antagonist for LPA receptor subtypes LPA1 and LPA3, was used to ensure that the stimulations were mediated by LPA1 receptors, (Ki16245 net stimulations over the basal values: cerebellum WM (-199 ± 2.03 nCi/g t.e.), corpus callosum (-628.7 ± 19.5 nCi/g t.e.) or internal capsule (-269.7 ± 3.0 nCi/g t.e.). In general, LPA-elicited net stimulations of the [35S]GTPγS basal binding were lower than in mice, but basal activity was higher in rat brain for the same WM areas.
Table 3.
[35S]GTPγS basal binding and net LPA-induced binding in different areas of rat brain.
| Brain region | Basal binding (nCi/g t.e) | Net LPA-evoked binding (nCi/g t.e) |
|---|---|---|
| Amygdala | 570.7 ± 43.5 | 46.7 ± 35.2 |
| Cerebellum | ||
| White matter | 229.9 ± 17.6 | 89.2 ± 15.5 |
| Gray matter | 113.9 ± 33.4 | 12.8 ± 3.1 |
| Corpus callosum | 803.5 ± 73.3 | 360 ± 18.4 |
| Striatum | 248.4 ± 29.5 | 23.3 ± 0.5 |
| Frontal cortex | ||
| Layer I-III | 192.7 ± 0.5 | 1.9 ± 0.5 |
| Layer IV | 14.9 ± 1.3 | - 22.5 ± 3.6 |
| Layer V | 258.9 ± 10.0 | - 7.7 ± 0.7 |
| Layer VI | 375.9 ± 4.9 | 165.4 ± 17.4 |
| Hippocampus | ||
| Dorsal CA1 radiata | 266.9 ± 28.9 | 20.1 ± 31.6 |
| Ventral CA3radiata | 275.5 ± 29.6 | 33.8 ± 10.7 |
| Internal capsule | 521.6 ± 5.3 | 206.8 ± 5.5 |
| Globus pallidus | 348.2 ± 13.1 | 37.5 ± 11.7 |
Net LPA-evoked binding (nCi/g t.e) = [35S]GTPγS LPA-stimulated binding - [35S]GTPγS basal binding. Data are mean ± SEM values, in nanocuries per gram of tissue .
Fig. 2.
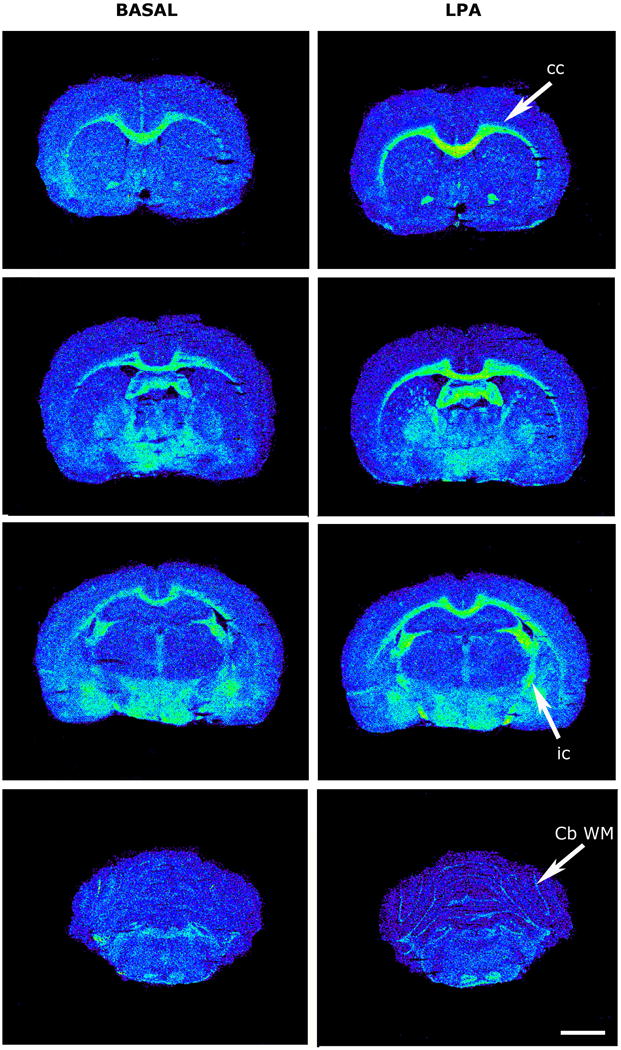
[35S]GTPγS basal binding (left) and stimulated by LPA (right) in coronal sections of rat brain. Cb WM, cerebellum white matter; cc, corpus callosum; ic, internal capsule. Scale bar = 3 mm.
Fig. 3.
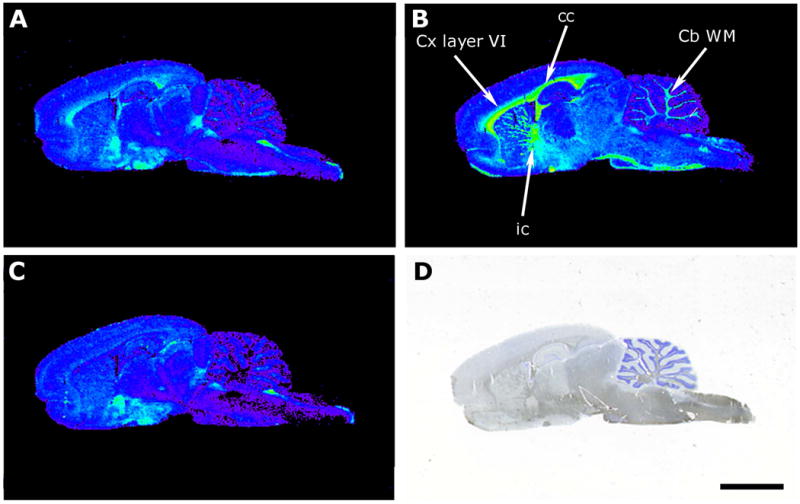
Autoradiographic images showing [35S]GTPγS basal binding in sagittal sections of rat CNS (A), stimulated by LPA (10-5 M) (B) and LPA stimulation antagonized by Ki16425 (10-5 M) (C). Thionine staining (D). Cb WM, cerebellum white matter; cc, corpus callosum; Cx layer VI, cortex layer VI; ic, internal capsule. Scale bar = 3 mm.
[35S]GTPγS binding assay in sections of postmortem human brain
For the [35S]GTPγS binding assay stimulated by the LPA agonist, oleoyl-L-α-lysophosphatidic acid sodium salt, human brain sections from different areas were selected, including the frontal cortex, hippocampus, striatum, amygdala and basal forebrain. The [35S]GTPγS binding induced by LPA in layer VI of frontal cortex (105.0 ± 34.9 %) and in the adjacent white matter region (706.2 ± 257.6 %), was significantly higher than in the other layers of the frontal cortex (Table 4 and Fig. 4). These data were similar to those obtained for the distribution of LPA-mediated effects in rat and mice cortex. In the striatal area, a high stimulation over the [35S]GTPγS basal binding was recorded in the internal capsule (564.1 ± 109.7 %) (Table 4 and Fig. 4). In the hippocampal area, the stimulations over the [35S]GTPγS basal binding induced by LPA, reached the highest levels in oriens (136.1 ± 27 %) and pyramidal layers (107 ± 71.8 %) of CA1 region and in the inner layers of the entorhinal cortex (59.7 ± 9.3 %) (Table 5 and Fig. 4). Finally, in amygdala and basal forebrain there was no LPA induced stimulation. Cortical nucleus of amygdala (-152 ± 17.5 nCi/g t.e.), basal nucleus of amygdala (magnocellular) (-150.5 ± 61.4 nCi/g t.e.), basal nucleus of amygdala (parvicellular) (-159.7 ± 90.9 nCi/g t.e.) and nucleus basalis of Meynert (-25.6 ± 30.7 nCi/g t.e.).
Table 4.
[35S]GTPγS basal binding and net LPA-induced binding in human frontal cortex and striatum.
| Brain region | Basal binding (nCi/g t.e) | Net LPA-evoked binding (nCi/g t.e) |
|---|---|---|
| Frontal cortex | ||
| Layer I-III | 49.5 ± 20.1 | - 11.8 ± 7.2 |
| Layer IV | 54.9 ± 23.1 | - 12.9 ± 9.1 |
| Layer V | 49.8 ± 22.7 | - 3.9 ± 2.8 |
| Layer VI | 46.0 ± 21.7 | 74.5 ± 24.9 |
| White matter | 15.7 ± 2.8 | 117.5 ± 28.5 |
| Striatum | 182.9 ± 55.7 | 109.5 ± 36.6 |
| Internal capsule | 34.6 ± 4.9 | 324.1 ± 101.8 |
Data are mean ± SEM values, in nanocuries per gram of tissue equivalent (nCi/g t.e.).
Fig. 4.
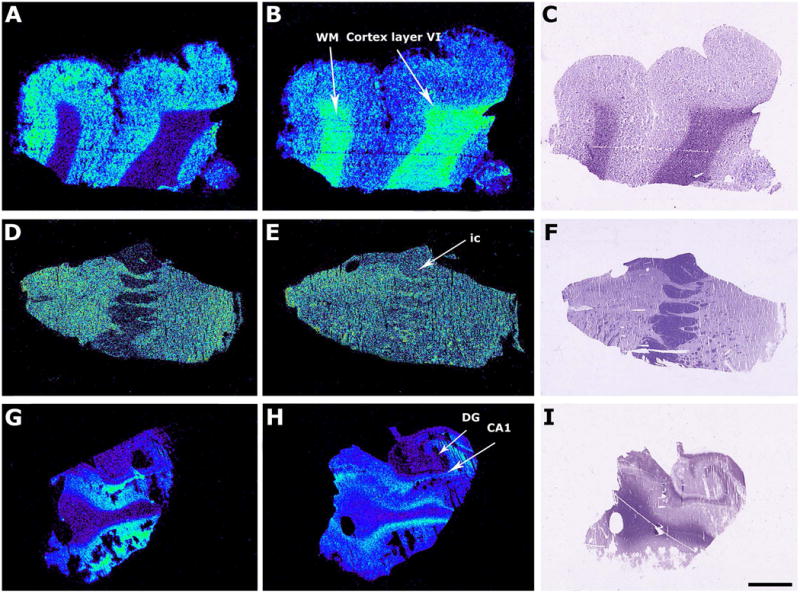
Representative autoradiograms of different regions of human postmortem brain that show [35S]GTPγS basal binding (A, D, G) and stimulated by LPA (10-5 M) (B, E, H) and thionine staining (C, F, I). Frontal cortex (A, B, C), striatum (C, D, E) and hippocampus (G, H, I). Note the stimulation in the presence of LPA in white matter areas, layer VI of frontal cortex and of entorhinal cortex. ic, internal capsule, CA1, Cornus ammonis 1, DG, Dentate gyrus. Scale bar = 3mm.
Table 5.
[35S]GTPγS basal binding and net LPA-induced binding in human hippocampus and entorhinal cortex.
| Brain region | Basal binding (nCi/g t.e.) | Net LPA-evoked binding (nCi/g t.e) |
|---|---|---|
| CA1 | ||
| Lacunosum moleculare | 36.6 ± 10.9 | 37.7 ± 12.0 |
| Oriens | 23.2 ± 20.1 | 44.9 ± 12.8 |
| Pyramidalis | 23.2 ± 4.1 | 27.8 ± 20.9 |
| Radiatum | 40.1 ± 17.5 | 28.8 ± 5.2 |
| Dentate gyrus | ||
| Granular layer | 56.7 ± 15.1 | 12.8 ± 3.1 |
| Hilus | 28.8 ± 6.1 | - 2.5 ± 2.2 |
| Subiculum | ||
| Lacunosum moleculare | 44.4 ± 16.1 | 15.6 ± 12.6 |
| Oriens | 69.6 ± 27.8 | 12.2 ± 7.6 |
| Pyramidalis | 72.9 ± 50.4 | - 26.0 ± 20.8 |
| Radiatum | 55.8 ± 16.5 | 13.7 ± 5.3 |
| Entorhinal area | ||
| Layer I | 126.0 ± 99.7 | - 84.8 ± 71.3 |
| Layer II-III | 98.1 ± 68.7 | - 42.4 ± 30.6 |
| Layer IV-VI | 80.1 ± 43.5 | 30.4 ± 11.2 |
Data are mean ± SEM values, in nanocuries per gram of tissue equivalent.
MALDI-IMS assay in rodent and in frontal cortex postmortem human brain sections
One of the aims of this study was to clarify different components of the LPA signaling system in the CNS, including the anatomical localization of possible PL precursors species of LPA. Therefore, we applied the MALDI-IMS technique to brain slices from mice, rat and postmortem samples of human frontal cortex, both in positive and negative ion detection mode. The methodology was optimized to experimental conditions for lipid detection, including selection of the MBT chemical matrix and deposition by sublimation (Astigarraga et al., 2008; Yang and Caprioli, 2011), as we have described above. We have only selected those peaks (m/z) from the spectra that share a similar anatomical distribution with reported results of LPA1 receptor and/or those obtained from LPA-induced stimulations of [35S]GTPγS basal binding described in the present study. In mice brain we have selected twenty-five different lipid species (Fig. 5), all of them measured in positive ion detection mode, as possible LPA precursor candidates. Some of these lipid species (m/z) that might be potential LPA precursors, have been assigned following previously reported data, but other molecules (m/z) remained as unidentified species. We were able to detect twenty different lipid species as possible LPA precursors in rat brain (Fig. 6). Finally, in the frontal cortex of postmortem human brain we also obtained twenty different species (Fig. 7).
Fig 5.
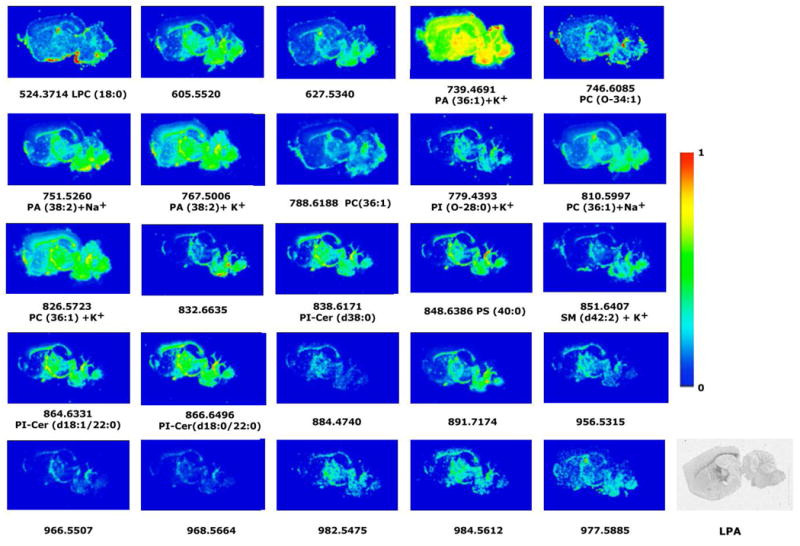
Representative images of the lipid distribution in sagittal sections of mice brain in white matter areas. Only those lipid species that share a similar distribution with LPA1 receptors and might be potential precursors of LPA are shown. The color images were obtained following the IMS conditions of 150 μm of spatial resolution (5475 spectra), 10 shots per spectrum, 2 microscans per point of acquisitions, 15 μJ of laser energy. MBT was used as matrix. The intensity of each lipid species is represented on the color scale, shown on the right side, as a ratio of the most abundant signal. The last image is an autoradiogram showing in gray scale the relative abundance of G proteins activated by the specific agonist of LPA1 receptors.
Fig 6.
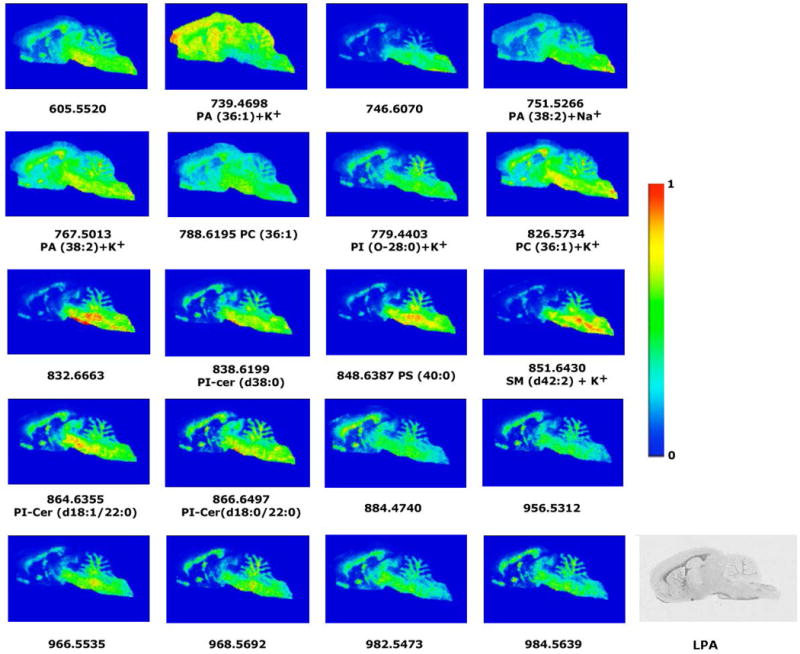
Representative images of the lipid distribution in sagittal sections of rat brain in white matter areas. Only those lipid species that share a similar distribution with LPA1 receptors and might be potential precursors of LPA are shown. The IMS experimental conditions were the following: 100 μm of spatial resolution (18000 spectra), 10 shots per spectrum, 2 microscans per point of acquisitions and 15 μJ of laser energy. MBT was used as matrix. The intensity of each lipid species is represented using the color scale, shown on the right side, as a ratio of the most abundant signal. The last image is an autoradiogram showing in gray scale the relative abundance of G proteins activated by the specific agonist of LPA1 receptors.
Fig 7.
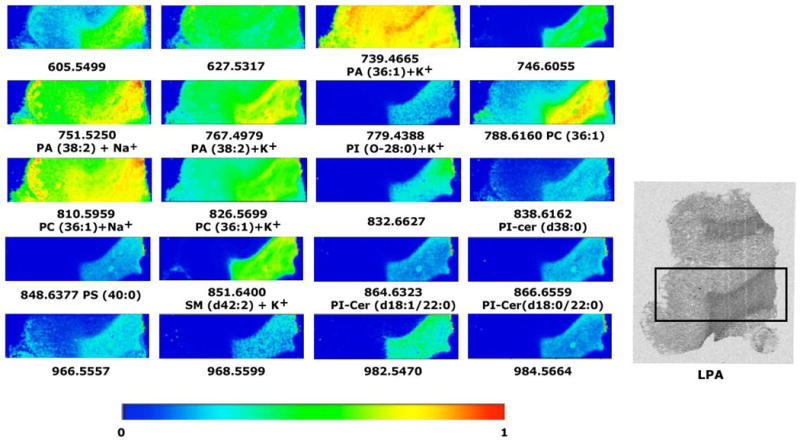
Representative images of the lipid distribution in frontal cortex of postmortem human brain and in the adjacent white matter. Only those lipid species that share a similar distribution with LPA1 receptors and might be potential precursors of LPA are shown. The IMS experimental conditions were the following: 100 μm of spatial resolution (8400 spectra), 10 shots per spectrum, 2 microscans per point of acquisitions and 15 μJ of laser energy. MBT was used as matrix. The intensity of each lipid species is represented using the color scale, in the bottom, as a ratio of the most abundant signal. The last image is an autoradiogram showing in gray scale the relative abundance of G proteins activated by the specific agonist of LPA1 receptors.
For example, PA (36:1) is a potential precursor that is distributed throughout the brain, but has the highest intensities in the corpus callosum (mice: 50.9 ± 3.01%, rat: 50.5 ± 2.1% and human: 49.9 ± 1.8%). Another phospholipid that is also a good candidate for an LPA precursor is PC (36:1), which is distributed in white matter and shows the following intensities in the corpus callosum of mice: 8.9 ± 1.3%, rat: 19.8 ± 3.5% , and human: 18.0 ± 2.8%.
Discussion
The aim of the present study was to characterize the anatomical distribution of LPA1 activity in rodent and human brain based upon the use of the [35S]GTPγS assay, using maLPA1null mice and Ki16425 (LPA1 antagonist) to confirm the obtained distribution. Furthermore, we were able to identify the anatomical distribution of potential PL precursors of LPA by MALDI-IMS assay in rodent and human brain (frontal cortex).
Firstly, the [35S]GTPγS basal binding was calculated in the absence of the agonist. In [35S]GTPγS autoradiography basal binding is the activity detected in brain sections even without the addition of exogenous agonists, representing the constitutive activity of the entire population of Gi/o protein-coupled receptors. The [35S]GTPγS autoradiography technique mainly quantifies the activity mediated by Gi/0 proteins (Harrison and Traynor, 2003). Therefore, the localization that we have described is specific for this G protein subtype. Moreover, [35S]GTPγS basal binding has been detected in previous [35S]GTPγS autoradiographic studies using animal and human brain sections. The [35S]GTPγS basal binding seems to be localized in neuroanatomically distinct structures of the brain (Sim et al., 1995; Laitinen, 1999; Moore et al., 2000; Happe et al., 2000; Aaltonen et al., 2008). However, this basal [35S]GTPγS signal has been a controversial issue since the introduction of this methodology.
Some studies have reported that this basal signal could be due to endogenous ligands retained in the tissue, or to the production or formation of different metabolites acting as GPCR neurotransmitters during the incubation procedures. The formation of adenosine, which activates A1 adenosine receptors, and LPA which acts on LPA1 receptors, may be at least partially, responsible for the [35S]GTPγS basal binding (Laitinen, 1999; Palomaki and Laitinen, 2006; Aaltonen et al., 2008). Considering the results obtained in the present study in maLPA1-null mice, we suggest that part of the basal activity recorded in myelinated white matter areas by [35S]GTPγS autoradiography could be a consequence of LPA1 receptor activation by their own LPA endogenous ligand. The fact that maLPA1-null mice did not show basal binding in white matter areas supports this idea. Furthermore, LPA1 receptor-mediated stimulation of [35S]GTPγS basal binding was blocked when using the LPA1 receptor antagonist, Ki16425. The antagonist diminished [35S]GTPγS basal binding to levels even lower than the Gi/o protein basal activity recorded in an adjacent brain section without ligands. The contribution of endogenous LPA to [35S]GTPγS basal binding, at least in autoradiographic studies of white matter tracts of myelinated brain areas, should be taken in account in future studies. The term “constitutive GPCR activity” may also be an experimental artifact generated by the binding of endogenous ligands that are not removed from their binding sites in GPCR during the pre-incubation processes (Palomaki and Laitinen 2006; Aaltonen et al., 2008, 2012). GPCRs for neurotransmitters of lipid molecules such as LPA, which may also be called neurolipids, are candidates for [35S]GTPγS basal binding in autoradiographic studies because they are present in physiological in vitro assay conditions of pH , temperature, salts, etc.
Over the last decade, the LPA signaling system and the localization of different LPA receptor subtypes in the CNS, as well as the different responses that LPA evokes have been widely studied (Chun, 1999; Chun et al., 2000; Contos et al., 2000; Fukushima et al., 2001, 2002; Fukushima, 2004; Dubin et al., 2010; Choi and Chun, 2013). Most of the neurobiological information comes from studies of the first LPA receptor, LPA1. The identification of this receptor came from fundamental studies on the development of the embryonic cerebral cortex (Hecht et al., 1996). The neurophysiology of LPA signaling requires identification of the cell subtypes that express LPA receptors in the CNS. Specifically, high expression of LPA1 receptors has been reported in neuronal progenitors (Fukushima et al., 1998; Contos et al., 2000; Estivill-Torrús et al., 2008), adult neurons from hippocampus (Pilpel and Segal, 2006), periaqueductal gray matter (Castilla-Ortega et al., 2014) and amygdala (Pedraza et al., 2014), oligodendrocytes (Weiner et al., 1998; Moller et al., 1999; García-Díaz et al., 2014), Schwann cells (Weiner and Chun, 1999; Weiner et al., 2001) and microglia (Moller at al., 2001). The expression in astrocytes is still questioned because it was not detected by in situ hybridization. However, significant mRNA expression levels have been detected in cultured astrocytes (Tabuchi et al., 2000; Spohr et al., 2008), and signaling mechanisms and the effects on neuronal differentiation have also been studied (Rao et al., 2003; Spohr et al., 2008, 2014). In contrast, the anatomical distribution of LPA1 activity in the mammalian CNS has not been well defined. For this reason we have carried out the present study by applying the [35S]GTPγS assay to rat, mouse and human postmortem brain samples, as compared to mouse LPA1 knockout tissues. The obtained results indicate that the previously reported anatomical localization of LPA1 receptor expression overlaps with [35S]GTPγS activity in myelinated white matter areas, such as corpus callosum, internal capsule, hippocampus, fimbria and white matter of the cerebellum (Aaltonen et al., 2008). The [35S]GTPγS binding stimulated by LPA was similar to or higher than the activity recorded for other GPCR in CNS, especially in white matter brain areas (Rodríguez-Puertas et al., 2000). In addition, we identified high activity of LPA1 receptors in layer (VI) of the frontal cortex. This high stimulation in the white matter and deep layers of cortex might be explained as a vestige of prenatal development. During embryonic development LPA1 gene expression is high within a neocortical neurogenic region called the ventricular zone (VZ) and the superficial marginal zone that is contiguous with the developing meninges (Hecht et al., 1996; Estivill-Torrús et al., 2008). However, VZ does not exist in adult brain, although Lpar1 expression is evident in cells present within developing white matter tracts and occurs during myelination (Weiner et al., 1998). More recently, a loss of myelination in maLPA1 mice has also been described (Garcia-Díaz et al., 2014). The pattern of Lpar1 expression is similar in rodent and human. However, semi-quantitative changes in the basal activity of white matter areas in rodent and human samples were detected. In rodents the basal activity in white matter areas was high, but in humans it was very low, which might be biological, but could well be due to degradation associated with the postmortem interval (González-Maeso et al., 2002, Barreda-Gómez et al., 2014) during which the endogenous LPA ligand could be degraded. Further studies would be necessary to address this possibility.
The localization described in the present study is for LPA1 coupled to Gi/0 protein. It is known that LPA1 receptors could also be coupled to other G protein subtypes (Gα12/13, Gαq/11c) (reviewed in Choi and Chun, 2013) that cannot be detected by using this technique. Further studies of receptor autoradiography would be necessary in order to quantify all the LPA1 receptors in the brain. Then, the co-localization of LPA/LPA1 could be performed if a methodological approach similar to that recently used in kidney to detect LPA by IMS were also applied to brain tissue (Grove et al., 2014).
Activation of LPA1 requires LPA, and therefore we assessed the anatomical localization of the different potential PL precursors of LPA by using IMS-MALDI assay in rodent brain. Like many other biologically active lipids, LPA can be formed locally on demand to act near its site of synthesis (Tokumura, 1995), as well as being supplied through blood fractions. As has been stated in the Introduction, PLA1-2 and ATX are involved in the major routes of LPA synthesis and the latter has a high level of expression in brain, especially in the choroid plexus (Yung et al., 2014). As a large number of lipid mass spectra were detected for both rodent and human brains it was necessary to limit the search to the lipid species (m/z) with a similar anatomical distribution to LPA1 receptors, and similar to the localization pattern that we obtained by LPA mediated [35S]GTPγS binding autoradiography. In the mouse brain, twenty-five potential lipid species compatible with being LPA precursors were identified as having a similar distribution to LPA1 receptors. Twenty PLs were identified in rat CNS as possible LPA precursors and the same number were also identified in frontal cortex slices from autopsied human brain samples.
PA and PC species with long fatty acid chains are predominant among the lipid species that have been previously identified, although most remain unidentified. We also considered prior studies showing that PC is a source of PA (Foster, 2013), and possible biosynthetic pathway of LPA commences with PA and is enzymatically processed by PLA1 or PLA2 enzymes (Fourcade et al., 1995; Hiramatsu et al., 2003). The resulting LPA species with a long, unsaturated or saturated fatty acyl chains can activate LPA1 receptors (Bandoh et al., 2000). Of the detected lipid species, at least four may be PL precursors for LPA: PA (36:1)+K+, PA (38:2:)+Na+, PC (18:0/18:1) and PC (O-16:0/18:1). For the assignment of the rest of the unidentified species, a detailed MS/MS study would be necessary, however such studies lack the anatomical resolution of the IMS method employed here.
In summary, the present study neuroanatomically maps active LPA1 receptors by analyzing LPA-mediated [35S]GTPγS binding in rodent and human brain, with validation of the signal in mice through the use of LPA1 knockout mutants, identifying white matter myelinated areas of the mammalian brain. In addition, the anatomical distribution of possible PL precursors for LPA was identified, indicating multiple potential precursor species that could result in LPA1 activation. Future studies examining degradative enzymes and processes that alter both receptor activity and ligand availability will further clarify the mechanisms of LPA signalling in both the healthy and diseased brain.
Supplementary Material
Acknowledgments
Supported by grants from the regional Basque Government IT584-13 and Spanish Government, Ministry for Health, I. S. C. III PI 10/01202- co-funded by European Research Development Fund. Technical support and personnel provided by SGIKER (UPV/EHU, MICINN, GV/E.G., ESF) is gratefully acknowledged. JC was supported by the NIH (NS084398).
Abbreviations used in text
- GPCR
G protein-coupled receptors
- LPA
lysophosphatidic acid
- PL
phospholipid
- SC
Schwann Cells
- cc
corpus callosum, Cx layer VI, frontal cortex layer VI
- cb WM
cerebellum white matter
- ic
internal capsule
- VZ
ventricular zone
- TIC
total ion current
References
- Aaltonen N, Lehtonen M, Varonen K, Goterris GA, Laitinen JT. Lipid phosphate phosphatase inhibitors locally amplify lysophosphatidic acid LPA1 receptor signalling in rat brain cryosections without affecting global LPA degradation. BMC Pharmacol. 2012;12:7–2210. 12–7. doi: 10.1186/1471-2210-12-7. [DOI] [PMC free article] [PubMed] [Google Scholar]
- Aaltonen N, Palomaki VA, Lecklin A, Laitinen JT. Neuroanatomical mapping of juvenile rat brain regions with prominent basal signal in [(35)S]GTPgammaS autoradiography. J Chem Neuroanat. 2008;35:233–241. doi: 10.1016/j.jchemneu.2007.12.003. [DOI] [PubMed] [Google Scholar]
- Allard J, Barron S, Trottier S, Cervera P, Daumas-Duport C, Leguern E, Brice A, Schwartz JC, Sokoloff P. Edg-2 in myelin-forming cells: isoforms, genomic mapping, and exclusion in Charcot-Marie-Tooth disease. Glia. 1999;26:176–185. doi: 10.1002/(sici)1098-1136(199904)26:2<176::aid-glia8>3.0.co;2-k. [DOI] [PubMed] [Google Scholar]
- An S, Goetzl EJ, Lee H. Signaling mechanisms and molecular characteristics of G protein-coupled receptors for lysophosphatidic acid and sphingosine 1-phosphate. J Cell Biochem Suppl. 1998;30-31:147–157. [PubMed] [Google Scholar]
- Aoki J. Mechanisms of lysophosphatidic acid production. Semin Cell Dev Biol. 2004;15:477–489. doi: 10.1016/j.semcdb.2004.05.001. [DOI] [PubMed] [Google Scholar]
- Aoki J, Inoue A, Okudaira S. Two pathways for lysophosphatidic acid production. Biochim Biophys Acta. 2008;1781:513–518. doi: 10.1016/j.bbalip.2008.06.005. [DOI] [PubMed] [Google Scholar]
- Astigarraga E, Barreda-Gómez G, Lombardero L, Fresnedo O, Castaño F, Giralt MT, Ochoa B, Rodríguez-Puertas R, Fernández JA. Profiling and imaging of lipids on brain and liver tissue by matrix-assisted laser desorption/ ionization mass spectrometry using 2-mercaptobenzothiazole as a matrix. Anal Chem. 2008;80:9105–14. doi: 10.1021/ac801662n. [DOI] [PubMed] [Google Scholar]
- Bandoh K, Aoki J, Hosono H, Kobayashi S, Kobayashi T, Murakami-Murofushi K, Tsujimoto M, Arai H, Inoue K. Molecular cloning and characterization of a novel human G-protein-coupled receptor, EDG7, for lysophosphatidic acid. J Biol Chem. 1999;274:27776–27785. doi: 10.1074/jbc.274.39.27776. [DOI] [PubMed] [Google Scholar]
- Bandoh K, Aoki J, Taira A, Tsujimoto M, Arai H, Inoue K. Lysophosphatidic acid (LPA) receptors of the EDG family are differentially activated by LPA species. Structure-activity relationship of cloned LPA receptors. FEBS Lett. 2000;478:159–165. doi: 10.1016/s0014-5793(00)01827-5. [DOI] [PubMed] [Google Scholar]
- Barreda-Gómez G, Giralt MT, Pazos A, Rodriguez-Puertas R. Galanin activated G-proteins in human and rat central nervous systems. Neuropeptides. 2014;48:295–304. doi: 10.1016/j.npep.2014.06.002. [DOI] [PubMed] [Google Scholar]
- Bishop WR, Bell RM. Assembly of phospholipids into cellular membranes: biosynthesis, transmembrane movement and intracellular translocation. Annu Rev Cell Biol. 1988;4:579–610. doi: 10.1146/annurev.cb.04.110188.003051. [DOI] [PubMed] [Google Scholar]
- Caprioli RM, Farmer TB, Gile J. Molecular imaging of biological samples: localization of peptides and proteins using MALDI-TOF MS. Anal Chem. 1997;69:4751–4760. doi: 10.1021/ac970888i. [DOI] [PubMed] [Google Scholar]
- Castilla-Ortega E, Escuredo L, Bilbao A, Pedraza C, Orio L, Estivill-Torrús G, Santín LJ, De Fonseca FR, Pavón FJ. 1-Oleoyl lysophosphatidic acid: a new mediator of emotional behavior in rats. PLoS One. 2014;9(1):e85348. doi: 10.1371/journal.pone.0085348. [DOI] [PMC free article] [PubMed] [Google Scholar]
- Choi JW, Chun J. Lysophospholipids and their receptors in the central nervous system. Biochim Biophys Acta. 2013;1831:20–32. doi: 10.1016/j.bbalip.2012.07.015. [DOI] [PMC free article] [PubMed] [Google Scholar]
- Chun J. Lysophospholipid receptors: implications for neural signaling. Crit Rev Neurobiol. 1999;13:151–168. doi: 10.1615/critrevneurobiol.v13.i2.20. [DOI] [PubMed] [Google Scholar]
- Chun J, Weiner JA, Fukushima N, Contos JJ, Zhang G, Kimura Y, Dubin A, Ishii I, Hecht JH, Akita C, Kaushal D. Neurobiology of receptor-mediated lysophospholipid signaling. From the first lysophospholipid receptor to roles in nervous system function and development. Ann N Y Acad Sci. 2000;905:110–117. doi: 10.1111/j.1749-6632.2000.tb06543.x. [DOI] [PubMed] [Google Scholar]
- Contos JJ, Ishii I, Chun J. Lysophosphatidic acid receptors. Mol Pharmacol. 2000;58:1188–1196. doi: 10.1124/mol.58.6.1188. [DOI] [PubMed] [Google Scholar]
- Das AK, Hajra AK. Quantification, characterization and fatty acid composition of lysophosphatidic acid in different rat tissues. Lipids. 1989;24:329–333. doi: 10.1007/BF02535172. [DOI] [PubMed] [Google Scholar]
- Dubin AE, Herr DR, Chun J. Diversity of lysophosphatidic acid receptor-mediated intracellular calcium signaling in early cortical neurogenesis. J Neurosci. 2010;30:7300–7309. doi: 10.1523/JNEUROSCI.6151-09.2010. [DOI] [PMC free article] [PubMed] [Google Scholar]
- Erickson JR, Wu JJ, Goddard JG, Tigyi G, Kawanishi K, Tomei LD, Kiefer MC. Edg-2/Vzg-1 couples to the yeast pheromone response pathway selectively in response to lysophosphatidic acid. J Biol Chem. 1998;273:1506–1510. doi: 10.1074/jbc.273.3.1506. [DOI] [PubMed] [Google Scholar]
- Estivill-Torrús G, Llebrez-Zayas P, Matas-Rico E, Santin L, Pedraza C, De Diego I, Del Arco I, Fernandez-Llebrez P, Chun J, de Fonseca FR. Absence of LPA1 signaling results in defective cortical development. Cereb Cortex. 2008;18:938–950. doi: 10.1093/cercor/bhm132. [DOI] [PubMed] [Google Scholar]
- Fernández JA, Ochoa B, Fresnedo O, Giralt MT, Rodriguez-Puertas R. Matrix-assisted laser desorption ionization imaging mass spectrometry in lipidomics. Anal Bioanal Chem. 2011;401:29–51. doi: 10.1007/s00216-011-4696-x. [DOI] [PubMed] [Google Scholar]
- Fischer DJ, Liliom K, Guo Z, Nusser N, Virag T, Murakami-Murofushi K, Kobayashi S, Erickson JR, Sun G, Miller DD, Tigyi G. Naturally occurring analogs of lysophosphatidic acid elicit different cellular responses through selective activation of multiple receptor subtypes. Mol Pharmacol. 1998;54:979–988. doi: 10.1124/mol.54.6.979. [DOI] [PubMed] [Google Scholar]
- Foster DA. Phosphatidic acid and lipid-sensing by m TOR. Trends Endocrinol Metab. 2013;24:272–278. doi: 10.1016/j.tem.2013.02.003. [DOI] [PMC free article] [PubMed] [Google Scholar]
- Fourcade O, Simon MF, Viode C, Rugani N, Leballe F, Ragab A, Fournie B, Sarda L, Chap H. Secretory phospholipase A2 generates the novel lipid mediator lysophosphatidic acid in membrane microvesicles shed from activated cells. Cell. 1995;80:919–927. doi: 10.1016/0092-8674(95)90295-3. [DOI] [PubMed] [Google Scholar]
- Fukushima N. LPA in neural cell development. J Cell Biochem. 2004;92:993–1003. doi: 10.1002/jcb.20093. [DOI] [PubMed] [Google Scholar]
- Fukushima N, Ishii I, Contos JJ, Weiner JA, Chun J. Lysophospholipid receptors. Annu Rev Pharmacol Toxicol. 2001;41:507–534. doi: 10.1146/annurev.pharmtox.41.1.507. [DOI] [PubMed] [Google Scholar]
- Fukushima N, Kimura Y, Chun J. A single receptor encoded by vzg-1/lpA1/edg-2 couples to G proteins and mediates multiple cellular responses to lysophosphatidic acid. Proc Natl Acad Sci U S A. 1998;95:6151–6156. doi: 10.1073/pnas.95.11.6151. [DOI] [PMC free article] [PubMed] [Google Scholar]
- Fukushima N, Weiner JA, Chun J. Lysophosphatidic acid (LPA) is a novel extracellular regulator of cortical neuroblast morphology. Dev Biol. 2000;228:6–18. doi: 10.1006/dbio.2000.9930. [DOI] [PubMed] [Google Scholar]
- Fukushima N, Ye X, Chun J. Neurobiology of lysophosphatidic acid signaling. Neuroscientist. 2002;8:540–550. doi: 10.1177/1073858402238513. [DOI] [PubMed] [Google Scholar]
- Gaits F, Fourcade O, Le Balle F, Gueguen G, Gaige B, Gassama-Diagne A, Fauvel J, Salles JP, Mauco G, Simon MF, Chap H. Lysophosphatidic acid as a phospholipid mediator: pathways of synthesis. FEBS Lett. 1997;410:54–58. doi: 10.1016/s0014-5793(97)00411-0. [DOI] [PubMed] [Google Scholar]
- García-Díaz B, Riquelme R, Varela-Nieto I, Jiménez AJ, de Diego I, Gómez-Conde AI, Matas-Rico E, Aguirre JA, Chun J, Pedraza C, Santín LJ, Fernández O, Rodríguez de Fonseca F, Estivill-Torrús G. Loss of lysophosphatidic acid receptor LPA1 alters oligodendrocyte differentiation and myelination in the mouse cerebral cortex. Brain Struct Funct. 2014 doi: 10.1007/s00429-014-0885-7. [DOI] [PubMed] [Google Scholar]
- Gerrard JM, Robinson P. Identification of the molecular species of lysophosphatidic acid produced when platelets are stimulated by thrombin. Biochim Biophys Acta. 1989;1001:282–285. doi: 10.1016/0005-2760(89)90112-4. [DOI] [PubMed] [Google Scholar]
- Goetzl EJ, An S. Diversity of cellular receptors and functions for the lysophospholipid growth factors lysophosphatidic acid and sphingosine 1-phosphate. FASEB J. 1998;12:1589–1598. [PubMed] [Google Scholar]
- González-Maeso J, Torre I, Rodriguez-Puertas R, Garcia-Sevilla JA, Guimon J, Meana JJ. Effects of age, postmortem delay and storage time on receptor-mediated activation of G-proteins in human brain. Neuropsychopharmacology. 2002;26:468–478. doi: 10.1016/S0893-133X(01)00342-6. [DOI] [PubMed] [Google Scholar]
- Grove KJ, Voziyan PA, Spraggins JM, Wang S, Paueksakon P, Harris RC, Hudson BG, Caprioli RM. Diabetic nephropathy induces alterations in the glomerular and tubule lipid profiles. J Lipid Res. 2014;55:1375–1385. doi: 10.1194/jlr.M049189. [DOI] [PMC free article] [PubMed] [Google Scholar]
- Happe HK, Bylund DB, Murrin LC. Alpha(2)-adrenoceptor-stimulated GTP gamma S binding in rat brain: an autoradiographic study. Eur J Pharmacol. 2000;399:17–27. doi: 10.1016/s0014-2999(00)00380-0. [DOI] [PubMed] [Google Scholar]
- Harrison C, Traynor JR. The [35S]GTPgammaS binding assay: approaches and applications in pharmacology. Life Sci. 2003;74:489–508. doi: 10.1016/j.lfs.2003.07.005. [DOI] [PubMed] [Google Scholar]
- Harrison SM, Reavill C, Brown G, Brown JT, Cluderay JE, Crook B, Davies CH, Dawson LA, Grau E, Heidbreder C, Hemmati P, Hervieu G, Howarth A, Hughes ZA, Hunter AJ, Latcham J, Pickering S, Pugh P, Rogers DC, Shilliam CS, Maycox PR. LPA1 receptor-deficient mice have phenotypic changes observed in psychiatric disease. Mol Cell Neurosci. 2003;24:1170–1179. doi: 10.1016/j.mcn.2003.09.001. [DOI] [PubMed] [Google Scholar]
- Hayashi K, Takahashi M, Nishida W, Yoshida K, Ohkawa Y, Kitabatake A, Aoki J, Arai H, Sobue K. Phenotypic modulation of vascular smooth muscle cells induced by unsaturated lysophosphatidic acids. Circ Res. 2001;89:251–258. doi: 10.1161/hh1501.094265. [DOI] [PubMed] [Google Scholar]
- Hecht JH, Weiner JA, Post SR, Chun J. Ventricular zone gene-1 (vzg-1) encodes a lysophosphatidic acid receptor expressed in neurogenic regions of the developing cerebral cortex. J Cell Biol. 1996;135:1071–1083. doi: 10.1083/jcb.135.4.1071. [DOI] [PMC free article] [PubMed] [Google Scholar]
- Herr KJ, Herr DR, Lee CW, Noguchi K, Chun J. Stereotyped fetal brain disorganization is induced by hypoxia and requires lysophosphatidic acid receptor 1 (LPA1) signaling. Proc Natl Acad Sci U S A. 2011;108:15444–15449. doi: 10.1073/pnas.1106129108. [DOI] [PMC free article] [PubMed] [Google Scholar]
- Hiramatsu T, Sonoda H, Takanezawa Y, Morikawa R, Ishida M, Kasahara K, Sanai Y, Taguchi R, Aoki J, Arai H. Biochemical and molecular characterization of two phosphatidic acid-selective phospholipase A1s, mPA-PLA1alpha and mPA-PLA1beta. J Biol Chem. 2003;278:49438–49447. doi: 10.1074/jbc.M213018200. [DOI] [PubMed] [Google Scholar]
- Inoue M, Rashid MH, Fujita R, Contos JJ, Chun J, Ueda H. Initiation of neuropathic pain requires lysophosphatidic acid receptor signaling. Nat Med. 2004;10:712–718. doi: 10.1038/nm1060. [DOI] [PubMed] [Google Scholar]
- Ishii I, Contos JJ, Fukushima N, Chun J. Functional comparisons of the lysophosphatidic acid receptors, LP(A1)/VZG-1/EDG-2, LP(A2)/EDG-4, and LP(A3)/EDG-7 in neuronal cell lines using a retrovirus expression system. Mol Pharmacol. 2000;58:895–902. doi: 10.1124/mol.58.5.895. [DOI] [PubMed] [Google Scholar]
- Ishii I, Fukushima N, Ye X, Chun J. Lysophospholipid receptors: signaling and biology. Annu Rev Biochem. 2004;73:321–354. doi: 10.1146/annurev.biochem.73.011303.073731. [DOI] [PubMed] [Google Scholar]
- Jalink K, Eichholtz T, Postma FR, van Corven EJ, Moolenaar WH. Lysophosphatidic acid induces neuronal shape changes via a novel, receptor-mediated signaling pathway: similarity to thrombin action. Cell Growth Differ. 1993;4:247–255. [PubMed] [Google Scholar]
- Jalink K, Hengeveld T, Mulder S, Postma FR, Simon MF, Chap H, van der Marel GA, van Boom JH, van Blitterswijk WJ, Moolenaar WH. Lysophosphatidic acid-induced Ca2+ mobilization in human A431 cells: structure-activity analysis. Biochem J. 1995;307(Pt 2):609–616. doi: 10.1042/bj3070609. [DOI] [PMC free article] [PubMed] [Google Scholar]
- Kihara Y, Maceyka M, Spiegel S, Chun J. Lysophospholipid receptor nomenclature review: IUPHAR Review 8. Br J Pharmacol. 2014;171:3575–3594. doi: 10.1111/bph.12678. [DOI] [PMC free article] [PubMed] [Google Scholar]
- Kingsbury MA, Rehen SK, Contos JJ, Higgins CM, Chun J. Non-proliferative effects of lysophosphatidic acid enhance cortical growth and folding. Nat Neurosci. 2003;6:1292–1299. doi: 10.1038/nn1157. [DOI] [PubMed] [Google Scholar]
- Kotarsky K, Boketoft A, Bristulf J, Nilsson NE, Norberg A, Hansson S, Owman C, Sillard R, Leeb-Lundberg LM, Olde B. Lysophosphatidic acid binds to and activates GPR92, a G protein-coupled receptor highly expressed in gastrointestinal lymphocytes. J Pharmacol Exp Ther. 2006;318:619–628. doi: 10.1124/jpet.105.098848. [DOI] [PubMed] [Google Scholar]
- Kranenburg O, Poland M, van Horck FP, Drechsel D, Hall A, Moolenaar WH. Activation of RhoA by lysophosphatidic acid and Galpha12/13 subunits in neuronal cells: induction of neurite retraction. Mol Biol Cell. 1999;10:1851–1857. doi: 10.1091/mbc.10.6.1851. [DOI] [PMC free article] [PubMed] [Google Scholar]
- Laitinen JT. Selective detection of adenosine A1 receptor-dependent G-protein activity in basal and stimulated conditions of rat brain [35S]guanosine 5′-(gamma-thio)triphosphate autoradiography. Neuroscience. 1999;90:1265–1279. doi: 10.1016/s0306-4522(98)00571-5. [DOI] [PubMed] [Google Scholar]
- Lee H, Goetzl EJ, An S. Lysophosphatidic acid and sphingosine 1-phosphate stimulate endothelial cell wound healing. Am J Physiol Cell Physiol. 2000;278:C612–8. doi: 10.1152/ajpcell.2000.278.3.C612. [DOI] [PubMed] [Google Scholar]
- Matas-Rico E, Garcia-Diaz B, Llebrez-Zayas P, Lopez-Barroso D, Santin L, Pedraza C, Smith-Fernandez A, Fernandez-Llebrez P, Tellez T, Redondo M, Chun J, De Fonseca FR, Estivill-Torrus G. Deletion of lysophosphatidic acid receptor LPA1 reduces neurogenesis in the mouse dentate gyrus. Mol Cell Neurosci. 2008;39:342–355. doi: 10.1016/j.mcn.2008.07.014. [DOI] [PMC free article] [PubMed] [Google Scholar]
- Moller T, Contos JJ, Musante DB, Chun J, Ransom BR. Expression and function of lysophosphatidic acid receptors in cultured rodent microglial cells. J Biol Chem. 2001;276:25946–25952. doi: 10.1074/jbc.M102691200. [DOI] [PubMed] [Google Scholar]
- Moller T, Musante DB, Ransom BR. Lysophosphatidic acid-induced calcium signals in cultured rat oligodendrocytes. Neuroreport. 1999;10:2929–2932. doi: 10.1097/00001756-199909290-00010. [DOI] [PubMed] [Google Scholar]
- Moore RJ, Xiao R, Sim-Selley LJ, Childers SR. Agonist-stimulated [35S]GTPgammaS binding in brain modulation by endogenous adenosine. Neuropharmacology. 2000;39:282–289. doi: 10.1016/s0028-3908(99)00112-4. [DOI] [PubMed] [Google Scholar]
- Noguchi K, Ishii S, Shimizu T. Identification of p2y9/GPR23 as a novel G protein-coupled receptor for lysophosphatidic acid, structurally distant from the Edg family. J Biol Chem. 2003;278:25600–25606. doi: 10.1074/jbc.M302648200. [DOI] [PubMed] [Google Scholar]
- Palomaki VA, Laitinen JT. The basic secretagogue compound 48/80 activates G proteins indirectly via stimulation of phospholipase D-lysophosphatidic acid receptor axis and 5-HT1A receptors in rat brain sections. Br J Pharmacol. 2006;147:596–606. doi: 10.1038/sj.bjp.0706671. [DOI] [PMC free article] [PubMed] [Google Scholar]
- Pedraza C, Sánchez-López J, Castilla-Ortega E, Rosell-Valle C, Zambrana-Infantes E, García-Fernández M, Rodriguez de Fonseca F, Chun J, Santín LJ, Estivill-Torrús G. Fear extinction and acute stress reactivity reveal a role of LPA(1) receptor in regulating emotional-like behaviors. Brain Struct Funct. 2014;219:1659–1672. doi: 10.1007/s00429-013-0592-9. [DOI] [PubMed] [Google Scholar]
- Pieringer RA, Bonner H, Jr, Kunnes RS. Biosynthesis of phosphatidic acid, lysophosphatidic acid, diglyceride, and triglyceride by fatty acyltransferase pathways in Escherichia coli. J Biol Chem. 1967;242:2719–2724. [PubMed] [Google Scholar]
- Pilpel Y, Segal M. The role of LPA1 in formation of synapses among cultured hippocampal neurons. J Neurochem. 2006;97:1379–1392. doi: 10.1111/j.1471-4159.2006.03825.x. [DOI] [PubMed] [Google Scholar]
- Rao TS, Lariosa-Willingham KD, Lin FF, Palfreyman EL, Yu N, Chun J, Webb M. Pharmacological characterization of lysophospholipid receptor signal transduction pathways in rat cerebrocortical astrocytes. Brain Res. 2003;990:182–194. doi: 10.1016/s0006-8993(03)03527-3. [DOI] [PubMed] [Google Scholar]
- Renback K, Inoue M, Yoshida A, Nyberg F, Ueda H. Vzg-1/lysophosphatidic acid-receptor involved in peripheral pain transmission. Brain Res Mol Brain Res. 2000;75:350–354. doi: 10.1016/s0169-328x(99)00333-2. [DOI] [PubMed] [Google Scholar]
- Rodríguez-Puertas R, González-Maeso J, Meana JJ, Pazos A. Autoradiography of receptor-activated G-proteins in post mortem human brain. Neuroscience. 2000;96:169–80. doi: 10.1016/s0306-4522(99)00527-8. [DOI] [PubMed] [Google Scholar]
- Schwartz SA, Reyzer ML, Caprioli RM. Direct tissue analysis using matrix-assisted laser desorption/ionization mass spectrometry: practical aspects of sample preparation. J Mass Spectrom. 2003;38:699–708. doi: 10.1002/jms.505. [DOI] [PubMed] [Google Scholar]
- Shano S, Moriyama R, Chun J, Fukushima N. Lysophosphatidic acid stimulates astrocyte proliferation through LPA1. Neurochem Int. 2008;52:216–220. doi: 10.1016/j.neuint.2007.07.004. [DOI] [PMC free article] [PubMed] [Google Scholar]
- Sim LJ, Selley DE, Childers SR. Autoradiographic visualization in brain of receptor-G protein coupling using [35S]GTP gamma S binding. Methods Mol Biol. 1997;83:117–132. doi: 10.1385/0-89603-495-X:117. [DOI] [PubMed] [Google Scholar]
- Sim LJ, Selley DE, Childers SR. In vitro autoradiography of receptor-activated G proteins in rat brain by agonist-stimulated guanylyl 5′-[gamma-[35S]thio]-triphosphate binding. Proc Natl Acad Sci U S A. 1995;92:7242–7246. doi: 10.1073/pnas.92.16.7242. [DOI] [PMC free article] [PubMed] [Google Scholar]
- Spohr TC, Choi JW, Gardell SE, Herr DR, Rehen SK, Gomes FC, Chun J. Lysophosphatidic acid receptor-dependent secondary effects via astrocytes promote neuronal differentiation. J Biol Chem. 2008;283:7470–7479. doi: 10.1074/jbc.M707758200. [DOI] [PMC free article] [PubMed] [Google Scholar]
- Spohr TC, Dezonne RS, Rehen SK, Gomes FC. LPA-primed astrocytes induce axonal outgrowth of cortical progenitors by activating PKA signaling pathways and modulating extracellular matrix proteins. Front Cell Neurosci. 2014;8:296. doi: 10.3389/fncel.2014.00296. [DOI] [PMC free article] [PubMed] [Google Scholar]
- Sugiura T, Nakane S, Kishimoto S, Waku K, Yoshioka Y, Tokumura A, Hanahan DJ. Occurrence of lysophosphatidic acid and its alkyl ether-linked analog in rat brain and comparison of their biological activities toward cultured neural cells. Biochim Biophys Acta. 1999;1440:194–204. doi: 10.1016/s1388-1981(99)00127-4. [DOI] [PubMed] [Google Scholar]
- Sun Y, Kim NH, Yang H, Kim SH, Huh SO. Lysophosphatidic acid induces neurite retraction in differentiated neuroblastoma cells via GSK-3beta activation. Mol Cells. 2011;31:483–489. doi: 10.1007/s10059-011-1036-0. [DOI] [PMC free article] [PubMed] [Google Scholar]
- Tabuchi S, Kume K, Aihara M, Shimizu T. Expression of lysophosphatidic acid receptor in rat astrocytes: mitogenic effect and expression of neurotrophic genes. Neurochem Res. 2000;25:573–582. doi: 10.1023/a:1007542532395. [DOI] [PubMed] [Google Scholar]
- Tham C, Lin F, Rao TS, Yu N, Webb M. Microglial activation state and lysophospholipid acid receptor expression. International Journal of Developmental Neuroscience. 2003;21:431–443. doi: 10.1016/j.ijdevneu.2003.09.003. [DOI] [PubMed] [Google Scholar]
- Tigyi G, Fischer DJ, Sebok A, Yang C, Dyer DL, Miledi R. Lysophosphatidic acid-induced neurite retraction in PC12 cells: control by phosphoinositide-Ca2+ signaling and Rho. J Neurochem. 1996;66:537–548. doi: 10.1046/j.1471-4159.1996.66020537.x. [DOI] [PubMed] [Google Scholar]
- Tigyi G, Hong L, Yakubu M, Parfenova H, Shibata M, Leffler CW. Lysophosphatidic acid alters cerebrovascular reactivity in piglets. Am J Physiol. 1995;268:H2048–55. doi: 10.1152/ajpheart.1995.268.5.H2048. [DOI] [PubMed] [Google Scholar]
- Tigyi G, Parrill AL. Molecular mechanisms of lysophosphatidic acid action. Prog Lipid Res. 2003;42:498–526. doi: 10.1016/s0163-7827(03)00035-3. [DOI] [PubMed] [Google Scholar]
- Tokumura A. A family of phospholipid autacoids: occurrence, metabolism and bioactions. Prog Lipid Res. 1995;34:151–184. doi: 10.1016/0163-7827(95)00001-g. [DOI] [PubMed] [Google Scholar]
- Tokumura A, Iimori M, Nishioka Y, Kitahara M, Sakashita M, Tanaka S. Lysophosphatidic acids induce proliferation of cultured vascular smooth muscle cells from rat aorta. Am J Physiol. 1994;267:C204–10. doi: 10.1152/ajpcell.1994.267.1.C204. [DOI] [PubMed] [Google Scholar]
- Touboul D, Piednoel H, Voisin V, De La Porte S, Brunelle A, Halgand F, Laprevote O. Changes of phospholipid composition within the dystrophic muscle by matrix-assisted laser desorption/ionization mass spectrometry and mass spectrometry imaging. Eur J Mass Spectrom (Chichester, Eng) 2004;10:657–664. doi: 10.1255/ejms.671. [DOI] [PubMed] [Google Scholar]
- Weiner JA, Chun J. Schwann cell survival mediated by the signaling phospholipid lysophosphatidic acid. Proc Natl Acad Sci U S A. 1999;96:5233–5238. doi: 10.1073/pnas.96.9.5233. [DOI] [PMC free article] [PubMed] [Google Scholar]
- Weiner JA, Fukushima N, Contos JJ, Scherer SS, Chun J. Regulation of Schwann cell morphology and adhesion by receptor-mediated lysophosphatidic acid signaling. J Neurosci. 2001;21:7069–7078. doi: 10.1523/JNEUROSCI.21-18-07069.2001. [DOI] [PMC free article] [PubMed] [Google Scholar]
- Weiner JA, Hecht JH, Chun J. Lysophosphatidic acid receptor gene vzg-1/lpA1/edg-2 is expressed by mature oligodendrocytes during myelination in the postnatal murine brain. J Comp Neurol. 1998;398:587–598. [PubMed] [Google Scholar]
- Yang J, Caprioli RM. Matrix sublimation/recrystallization for imaging proteins by mass spectrometry at high spatial resolution. Anal Chem. 2011;83:5728–5734. doi: 10.1021/ac200998a. [DOI] [PMC free article] [PubMed] [Google Scholar]
- Ye X, Fukushima N, Kingsbury MA, Chun J. Lysophosphatidic acid in neural signaling. Neuroreport. 2002;13:2169–2175. doi: 10.1097/00001756-200212030-00002. [DOI] [PubMed] [Google Scholar]
- Yoshida K, Nishida W, Hayashi K, Ohkawa Y, Ogawa A, Aoki J, Arai H, Sobue K. Vascular remodeling induced by naturally occurring unsaturated lysophosphatidic acid in vivo. Circulation. 2003;108:1746–1752. doi: 10.1161/01.CIR.0000089374.35455.F3. [DOI] [PubMed] [Google Scholar]
- Yung YC, Mutoh T, Lin ME, Noguchi K, Rivera RR, Choi JW, Kingsbury MA, Chun J. Lysophosphatidic acid signaling may initiate fetal hydrocephalus. Sci Transl Med. 2011;3 doi: 10.1126/scitranslmed.3002095. 99ra87. [DOI] [PMC free article] [PubMed] [Google Scholar]
- Yung YC, Stoddard NC, Chun J. LPA receptor signaling: pharmacology, physiology, and pathophysiology. J Lipid Res. 2014;55:1192–1214. doi: 10.1194/jlr.R046458. [DOI] [PMC free article] [PubMed] [Google Scholar]
Associated Data
This section collects any data citations, data availability statements, or supplementary materials included in this article.