

Significance
Plastics are a contaminant of emerging concern accumulating in marine ecosystems. Plastics tend to break down into small particles, called microplastics, which also enter the marine environment directly as fragments from a variety of sources, including cosmetics, clothing, and industrial processes. Given their ubiquitous nature and small dimensions, the ingestion and impact of microplastics on marine life are a cause for concern, notably for filter feeders. Oysters were exposed to polystyrene microparticles, which were shown to interfere with energy uptake and allocation, reproduction, and offspring performance. A drop in energy allocation played a major role in this reproductive impairment. This study provides ground-breaking data on microplastic impacts in an invertebrate model, helping to predict ecological impact in marine ecosystems.
Keywords: microplastic, reproduction, energy allocation, oyster
Abstract
Plastics are persistent synthetic polymers that accumulate as waste in the marine environment. Microplastic (MP) particles are derived from the breakdown of larger debris or can enter the environment as microscopic fragments. Because filter-feeder organisms ingest MP while feeding, they are likely to be impacted by MP pollution. To assess the impact of polystyrene microspheres (micro-PS) on the physiology of the Pacific oyster, adult oysters were experimentally exposed to virgin micro-PS (2 and 6 µm in diameter; 0.023 mg·L−1) for 2 mo during a reproductive cycle. Effects were investigated on ecophysiological parameters; cellular, transcriptomic, and proteomic responses; fecundity; and offspring development. Oysters preferentially ingested the 6-µm micro-PS over the 2-µm-diameter particles. Consumption of microalgae and absorption efficiency were significantly higher in exposed oysters, suggesting compensatory and physical effects on both digestive parameters. After 2 mo, exposed oysters had significant decreases in oocyte number (−38%), diameter (−5%), and sperm velocity (−23%). The D-larval yield and larval development of offspring derived from exposed parents decreased by 41% and 18%, respectively, compared with control offspring. Dynamic energy budget modeling, supported by transcriptomic profiles, suggested a significant shift of energy allocation from reproduction to structural growth, and elevated maintenance costs in exposed oysters, which is thought to be caused by interference with energy uptake. Molecular signatures of endocrine disruption were also revealed, but no endocrine disruptors were found in the biological samples. This study provides evidence that micro-PS cause feeding modifications and reproductive disruption in oysters, with significant impacts on offspring.
Plastic production is continually increasing, with 299 million metric tons produced in 2013 and estimations of 33 billion tons for 2050 (1). Plastic waste entering the oceans was calculated for 2010 at 4–12 million tons per year (2). The consequences of macroplastic debris for wildlife are becoming well documented (3). Microplastic (MP) particles, defined as plastic particles smaller than 5 mm (4), derived from the fragmentation of larger debris (5, 6) or enter the environment directly as microscopic fragments (7). MP pollution in the world’s oceans has been recently estimated at over 5 trillion floating particles, corresponding to 250,000 tons (8).
Given the ubiquitous nature and small dimensions of MP (9), their ingestion and subsequent impact on marine life is a growing cause for concern, notably for suspension filter-feeding species, which filter large water volumes and may ingest large quantities of particles (10–13). Effects of MP ingestion have already been studied in several filter-feeding species, such as mussels (14–17), sea cucumbers (18), lungworms (13, 19), and some zooplankton (20–22). These studies mainly showed a reduction of feeding activity (19), reserve depletion (13), inflammatory responses (15, 17), and translocation of MP into the circulatory system (14, 17). Effects on fitness have been reported, with decreases in survival and fecundity in copepods (20, 22) and reproductive disruption in Daphnia (21). At cellular and molecular levels, alterations of immunological responses, neurotoxic effects, and the onset of genotoxicity have been observed in mussels exposed to polycyclic aromatic hydrocarbon-contaminated polystyrene particles (17). Additional impacts may arise from harmful plastic additives and persistent organic pollutants adsorbed on MP, which are known to be taken up and accumulated by living organisms (23).
In this study, the effects of MP exposure were assessed on reproductively active Crassostrea gigas adults and their offspring. The Pacific oyster was chosen because of its world-wide production, economic importance as seafood, and important role in estuarine and coastal habitats (24). A 2-mo exposure of adult oysters to microsized polystyrene spheres (micro-PS, 2 and 6 µm, 0.023 mg·L−1) was performed under controlled conditions suitable for germ-cell maturation. Polystyrene is one of the most commonly used plastic polymers worldwide, often found in microplastics sampled at sea (25, 26). In our study, toxic endpoints were investigated through an integrative approach, covering data from molecular and cellular parameters to ecophysiological behavior and energy budget modeling. Our results show that experimental micro-PS exposure on adult oysters affects feeding, absorption efficiency, gamete quality, and fecundity, as well as impacting offspring growth.
Results
Ingestion and Fate of Micro-PS.
Average daily ingestion of micro-PS particles was 14 ± 2% of the 2-µm particles and 69 ± 6% of the 6-µm particles supplied. From histological analysis, micro-PS particles were only detected in the stomach and intestine (Fig. 1) and did not reveal cellular inflammatory features in exposed animals.
Fig. 1.

Histology panels. Micropolystyrene beads of 2 and 6 µm were observed in the stomach lumen (A and B) and intestine (C and D) of exposed oysters but not in the digestive tubules (E). No beads were observed in control oysters. ct: conjunctive tissue; ce: ciliated epithelium; cs: crystalline style; dt: digestive tubule; lu: lumen; 6 µm: 6-µm polystyrene beads, 2 µm: 2-µm polystyrene beads.
Algal Consumption, Absorption Efficiency, and Growth.
Over the whole experiment, algal consumption was 4.30 × 10⁶ ± 9.05 × 105 μm3 of algae per oyster−1·h−1 with micro-PS and 4.26 × 10⁶ ± 1.05 μm3 of algae per oyster−1·h−1 for the control. The two-way ANOVA revealed significantly higher algal consumption for exposed oysters (+3%, P < 0.01), a significant date effect, and a date-exposure interaction (P < 0.001). Absorption efficiency was 51.8 ± 7.2% and 46.6 ± 7.9% on average for micro-PS and control treatments, respectively. The two-way ANOVA revealed significantly higher absorption efficiency for exposed oysters (+11%, P < 0.01). A significant date effect was observed (P < 0.001). No significant difference in condition index was observed between exposed and control oysters (0.09 ± 0.01 and 0.10 ± 0.01, respectively).
Hemocyte Counts and Morphological and Functional Characteristics.
Hyalinocytes and granulocytes were larger in exposed oysters (+6.7% and +16.1%, respectively) than in controls (P < 0.001) (Fig. S1). Significant interactions between date and exposure factors were found in oxidative activity for both hemocyte populations (P < 0.01). The post hoc test indicated that oxidative activity was higher in exposed oysters than in controls at T1 (+54% on average for both hemocyte types) and was lower at T2 (−31%) and T3 (−29.1%).
Fig. S1.

Boxplots of oyster hemocyte parameters showing significant condition effect or condition–time interaction in the two-way ANOVA. T1, sampling time 1 (2 wk of micro-PS exposure); T2, sampling time 2 (5 wk); T3, sampling time 3 (8 wk); MP, micropolystyrene exposed oysters; C, control oysters (n = 24). Letters represent statistically different groups calculated by the least significant difference post hoc test.
Reproduction, Gamete Quality, and Larval Development.
Histological examination at T3 revealed that all control and exposed oysters were in stage 3, corresponding to ripeness.
For females, the total number of oocytes collected by stripping and oocyte diameter were significantly lower in exposed females than controls (−38%, P < 0.01 and −5%, P < 0.05, respectively). Total numbers of oocytes were 2.3 × 10⁶ ± 0.6 for the exposed females and 3.8 × 10⁶ ± 0.9 for controls. Oocyte diameter was 30.6 ± 0.9 µm for exposed females and 32.2 ± 1.1 µm for the control females. As an oocyte quality proxy, D-larval yield was estimated after making crosses by mixing oocytes collected from exposed and control females with control spermatozoa. A significant reduction in D-larval yield was observed in exposed females (29.6 ± 0.3%) compared with control females (49.8 ± 1.6%).
For males, significantly lower sperm velocity (−23%, P < 0.05) was observed in exposed individuals (59.5 ± 14.5 µm/s−1, P < 0.05) compared with controls (77.5 ± 9.3 µm/s−1). The percentage of motile sperm was similar between the two treatments, 40 ± 16% and 51 ± 11% for exposed and control males, respectively.
Finally, the larval growth was significantly slower (P < 0.001) (Fig. 2) in progeny issued from exposed genitors than in progeny issued from control genitors. A mean reduction in size of 18.6% was observed at 17 d postfertilization: mean shell length was 279.8 ± 12.5 µm for control progeny and 227.5 ± 8.5 µm for progeny issued from exposed genitors, for which a 6-d lag in time to metamorphosis was observed.
Fig. 2.
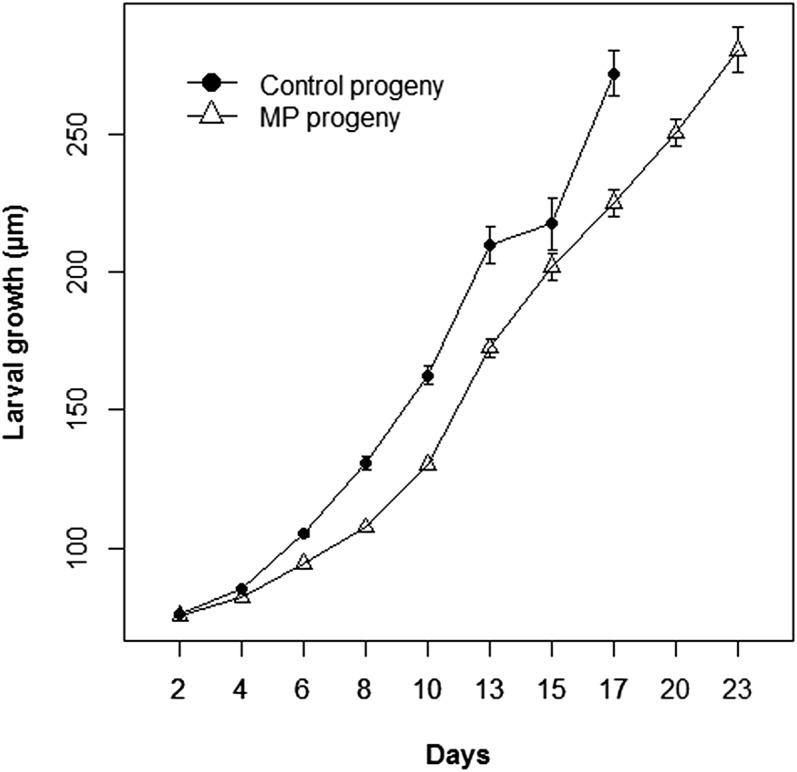
Larval growth. Larval size up to metamorphosis. Larval groups were obtained by crossing gametes collected from control genitors (control progeny) and from oysters exposed to micropolystyrene beads (MP progeny). A settlement delay of 6 d was observed in MP progeny compared with controls. For each group, mean and confidence intervals were obtained from triplicate larval rearing (n > 30).
Transcriptomic and Proteomic Analyses.
In the digestive gland, 76 transcripts were differentially expressed between exposed and control oysters [P < 1.10−4, false-discovery rate (FDR) < 5%] (Dataset S1) and 1,266 transcripts were differentially expressed between sampling times T1 and T3 (P < 0.01, FDR < 5%). Two clusters of transcripts with similar expression patterns, down-regulated (cluster 1, n = 51) and up-regulated (cluster 2, n = 25), were revealed in exposed digestive glands compared with controls (Fig. S2). Response to glucocorticoid stimulus, fatty acid catabolic processes, respiratory burst, and cellular response to mechanical stimulus were the main significantly enriched Gene Ontology (GO) biological processes.
Fig. S2.

Heatmaps of differentially expressed transcripts in female oyster digestive glands (A), gonads (B), and oocytes (C). For A and B, columns represent the averaged mRNA levels for each group (n = 5–8; T1 = sampling time 1, 2 wk of exposure; T3 = sampling time 3, 8 wk of exposure; MP = oysters exposed to polystyrene microbeads, T = control oysters). For C, individual samples are presented corresponding to oocytes collected in three exposed and five control females. Expression levels are shown with a color scale in which shades of red represent higher expression and shades of green represent lower expression.
In gonads, 46 transcripts were differentially expressed between exposed and control oysters (P < 0.01, FDR < 5%) (Dataset S2), and 8,136 between the sampling time T1 and T3 (P < 1.10−7, FDR < 5%). Two distinct clusters with similar expression patterns were found, with transcripts down-regulated (cluster 1, n = 31) and up-regulated (cluster 2, n = 15) in exposed gonads compared with controls (Fig. S2). Glutamine biosynthetic processes, positive regulation of insulin secretion, positive regulation of epithelial cell proliferation, and ovarian follicle cell–cell adhesion were among the significantly enriched GO biological processes.
In oocytes, 81 transcripts were differentially expressed between the two treatments (P < 0.01, FDR < 5%) (Dataset S3); 41 transcripts appeared to be down-regulated (cluster 1, n = 41) and 40 up-regulated (cluster 2, n = 40) in oocytes collected from exposed females compared with controls (Fig. S2). Proteolysis, embryo development, and ion binding were some of the enriched GO biological processes. Finally, the proteome of oocytes revealed two abundant protein spots that showed a marked difference between exposed and control samples. These two spots were identified as arginine kinase, characterized by a lower amount in oocytes collected from exposed females, and the protein severin, which was present in a higher amount in oocytes collected from exposed females than in oocytes collected from controls.
Dynamic Energy Budget Model Simulations.
Control oysters were simulated with standard dynamic energy budget (DEB)-model parameters (action of energy used for growth plus somatic maintenance, κ = 0.45, and volume-specific cost of maintenance [ṗM] = 44 J⋅cm−3⋅d−1) and with the absorption efficiency measured in the control (Fig. 3, “control”). Exposed oysters were simulated with standard DEB model parameters and the absorption efficiency measured for this condition (Fig. 3, “micro-PS.std”). Simulated relative differences in final dry flesh mass (DFM) and oocyte production were overestimated compared with values observed at T3. To make the model parameters fit with observed DFM and oocyte production, numerous simulations were performed with a set of parameter values (κ from 0 to 1 and [ṗM] from 0 to 200 J⋅cm−3⋅d−1). The best fit between observations and simulations (Fig. 3, “micro-PS.cal”) was reached with a single set of the two parameters κ = 0.77 and [ṗM] = 84 J⋅cm−3⋅d−1, which corresponds to increases of 71% and 90% beyond standard values, respectively.
Fig. 3.

DEB modeling. DEB model simulations for the DFM and oocyte number. Simulations named “control” represent simulations with standard parameters (i.e., fraction of energy allocated to soma, κ = 0.45, and volume-specific cost for maintenance, [ṗM] = 44 J⋅cm−3⋅d−1) and with absorption efficiency measured in controls. Simulations named “micro-PS.std” represent simulations with standard parameters and with absorption efficiency measured for oysters exposed to micropolystyrene. Simulations named “micro-PS.cal” represent simulations with calibrated parameters (i.e., κ = 0.77 and [ṗM] = 84 J⋅cm−3⋅d−1) and with absorption efficiency measured for exposed oysters. Initial and final dry flesh mass and oocyte production observed are plotted.
Chemical Analysis.
Following methods described in the Supporting Information, analyses on extracted micro-PS particles detected bibenzyl and 1(2H)naphthalenone,3,4,dihydro4phenyl with >90% correspondences (Fig. S3). Analyses in the aqueous phase or digestive styles did not show any molecules leaching from micro-PS particles compared with the controls, with a detection limit at 0.1 ng·L−1 for compounds with a log Kow less than 3.
Fig. S3.

Micro-PS chemical analysis. Scan chromatogram of micro-PS extracted with dichloromethane (A). Superimposed scan chromatograms of control digestive styles (black) and digestive styles with micro-PS particles (red) (B).
Discussion
Ingestion and Fate of Micro-PS in Oyster.
Micro-PS were efficiently ingested by filtration in oysters, presumably because of their similarity in size and shape to phytoplankton. Oysters preferentially ingested the 6-µm micro-PS over the 2-µm-diameter particles. This result may be explained by the oyster particle selection mechanism, which is 100% efficient for 5- to 6-µm particles (27). Ingested micro-PS particles were visually observed in feces (under microscope) and no accumulation in the gut was observed on histological slides, suggesting a high potential of egestion of micro-PS. However, smooth and spherical micro-PS beads differ greatly from plastic debris, such as the fibers and fragments of varying form and roughness present in the marine environment. Therefore, caution must be taken when extrapolating the rapid egestion rate observed here (28). Despite evidence of MP translocation in bivalves from some other studies (14, 15, 17), here no evidence of micro-PS transfer from the digestive tract to the circulatory system and other tissues was detected on the histological slides. Future studies on marine bivalves should address translocation processes by testing nonspherical fragments down to nano-sized particles, the size class most prone to this phenomenon via transcellular uptake in the gastrointestinal epithelium in mammals (29).
Impacts of Micro-PS on Energy Uptake and Allocation.
Consumption of microalgae and absorption efficiency appeared significantly higher in exposed oysters, suggesting a compensatory effect on food intake and absorption efficiency and an enhancement of mechanical digestion. Indeed, an improvement of mechanical disruption in the stomach of mussels was demonstrated in response to moderate silt ingestion, which enhances clearance rate and absorption efficiency (30). Nevertheless, increased food consumption can be viewed as compensation to adjust energy intake in response to digestive interference caused by micro-PS in the gut. The variations in mRNA levels of lipid-related proteins, such as enzymes involved in fatty acid oxidation, also suggest impairment of fatty acid metabolism and reduced energy intake from food (31). In any case, this compensation is insufficient to counterbalance the energy-flow disruption induced by micro-PS uptake as demonstrated by DEB modeling. Energy flows seem to shift toward organism maintenance and structural growth at the expense of reproduction. A recent study on mussels revealed increased energy consumption measured by respiration in MP-exposed animals, suggesting increased stress and energy demand to maintain homeostasis (16). Furthermore, in our data, there are signs of disturbance of homeostasis reflected by changes in hemocyte size and oxidative activity (32), and enrichment of transcripts involved in the response to glucocorticoid stimulus GO process. Glucocorticoids are hormonal corticosteroids involved in stress response, able to inhibit the expression of enzymes involved in fatty acid oxidation (33, 34).
Micro-PS Impaired Gametogenesis, Gamete Quality, and Fecundity.
Strong negative effects were observed on reproductive health indices, which significantly impacted fecundity and offspring performance during larval stages. The 23% reduction in sperm velocity in exposed oysters may lower their ability to fertilize oocytes. Indeed, in sea urchin a decrease in sperm motility was linked to an increase in the number of sperm required for fertilization success (35). Oyster oocyte number and size in micro-PS–exposed oysters were also significantly reduced over the same period (−38% and −5%, respectively). As oocyte quality predictors, mean oocyte diameter has been identified as a direct consequence of nutrition (36), supporting the hypothesis of energetic disruption in exposed oysters. Moreover, egg size and shape have been found to be positively related to larval survival and growth in subsequent progeny (37). In oocytes, maternally inherited mRNAs can have multiple functions, from regulation of cell-cycle progression and cellular metabolism, to regulation of developmental processes, such as fertilization, activation of zygotic transcription, and formation of body axes (38). Ion binding was greatly affected by MP exposure: 10 transcripts coding for proteins involved in this function were differentially expressed. Transcripts coding for proteins involved in Ca2+ binding may have affected the Ca2+ signaling pathway in exposed oocytes, thus affecting oocyte maturation (39). Severin is a Ca2+-dependent actin-binding protein regulating the completion of cell division (40); its up-regulation may reflect a deleterious effect of micro-PS on cytoskeletal dynamics, which are essential during oocyte maturation, fertilization, and subsequent embryo development (41). Other candidates, down-regulated in exposed oocytes, also indicate potential impairment of embryo development: transcripts in the categories of embryogenesis, cell differentiation, and proliferation, and the arginine kinase protein, responsible in invertebrates for ATP buffering on phosphagens, which are essential for embryo biosynthetic activities (42). A large alteration in fecundity, estimated through D-larval yield, offspring growth, and settlement, was observed for larvae produced from gametes collected from micro-PS exposed oysters. Negative effects of MP had already been observed on fecundity in copepods using similar micro-PS (20), and in Daphnia exposed to nano-PS, where numbers and body size of neonates fell and malformation rates rose (21). The parental effect of micro-PS on subsequent offspring growth may potentially affect recruitment of wild and farmed populations of Pacific oysters, with consequences for both ecology and aquaculture.
DEB modeling showed that the energy fraction allocated to reproduction seemed to shift toward structural growth and high maintenance costs. Disruption of energy balance may result from the down-regulation of several transcripts coding for proteins involved in the insulin pathway, with GO terms corresponding to cell proliferation and differentiation processes, in both digestive gland and gonads. The insulin pathway plays a crucial role in mobilizing reserves during gametogenesis, and has an essential role in germinal cell proliferation and maturation (43). We thus hypothesize that micro-PS exposure negatively impacts cell proliferation and differentiation processes in gonads through the down-regulation of genes responding to insulin signaling. Furthermore, a G protein-coupled receptor transcript, also down-regulated in digestive gland, has a key role in the reproductive function, binding the kisspeptin hormone responsible for the gonadotropic axis in vertebrates (44). The differential expression of hormone receptors or transcripts involved in different hormonal pathways in micro-PS–exposed animals suggests endocrine disruption. Endocrine system function can be affected by factors such as stress or endocrine-disrupting chemicals. A disturbance in individual energetics revealed by DEB modeling suggested that micro-PS particles have threatened the physiological integrity of oysters and consequently increased the maintenance costs, as described in response to various stresses and species (45–47). Micro-PS particles may potentially act as endocrine disruptors. The chemical analyses of virgin micro-PS only revealed bibenzyl and 1(2H)naphthalenone,3,4,dihydro4phenyl in destructive conditions after dichloromethane extraction. Bibenzyl-diol core molecules may have endocrine disruption properties, as established in mammal cells, because they are structural analogs of estrogens (48). No substances were found in seawater or in the digestive style extracts used to mimic oyster digestive conditions in vitro. However, it is now known that endocrine disrupters are often present below the detection limits and that bio-assays are sometimes more powerful than chemical quantification methods to detect their presence and effect (49). Although we cannot establish an impact of these molecules in our experiment, reprotoxic effects induced by virgin MP have recently been revealed in Daphnia (21) and in fish (50), suggesting that they could be a concern for endocrine disruption, induced by MP alone or in combination with other persistent pollutants.
Implications.
The micro-PS concentration tested in the present study was below the one estimated in Besseling et al. (21) that may occur at the sediment−water interface, where wild oysters live (Table S1). The exposed mass concentration (0.023 mg·L−1) was also in the range of the highest estimated field concentration >333 µm, from manta trawl sampling (Table S1), based on the assumption of a steady fragmentation of plastic debris (9, 51). It should, nonetheless, be noted that there is a lack of consistent field evaluations of the presence of microplastics as small as those used in the present study. This is mainly because of methodological limitations: current methods exclude the possibility of quantifying small size domains [reviewed by Filella (51)]. Moreover, assuming no waste management infrastructure improvements, the cumulative quantity of plastic waste available to enter the marine environment from land is predicted to increase by an order-of-magnitude by 2025 (2), especially in estuaries and coastal waters where oysters live and where waters are greatly influenced by increased human expansion. Therefore, our study also contributes to an early warning system and provides stakeholders with the necessary data to limit the impact of the microplastic legacy in decades to come.
Table S1.
Highest microplastic concentrations measured in nature and used in some experimental studies, including the present one
| Source | In situ location or experiment* | Size | Plastic type and polymer† | Mass concentration in standard unit mg·L−1 | Mass concentration in original unit‡ |
| (65) | California current system | >333 µm | Fragments | 5.33 | |
| (66) | South Pacific Gyre | >333 µm | Fragments, lines, films spheres, | 0.073§ | 732 g·km−2 |
| (67) | North Pacific Central Gyre | >333 µm | Fragments, lines, films | 3.02§ | 30,169 g·km−2 |
| (68) | Danube¶ | >500 µm | Pellets, flakes, spherules | 0.697 | |
| (69) | India, Sediment | >0.45 µm | Fragments, PU, PA, PS, PES | 162ll | 89 mg·kg−1 dry weight |
| (10) | Exp, mussel | 30 nm | Spheres, PS | 100–200–300 | |
| (15) | Exp, mussel | 1−80 µm | Particles, HDPE | 2,500 | |
| (17) | Exp, mussel | <100 μm | Particles, PS, PE | 1,500 | |
| (21) | Exp, Daphnia | ∼70 nm | Spheres, PS | 0.22–150 | |
| Present study | Exp, oyster | 2 and 6 µm | Spheres, PS | 0.023 |
Exp indicates experimental study, for which targeted species was added.
HDPE: high-density polyethylene particle; PA: polyamides (nylon); PE: polyethylene; PES: polyester; PS: polystyrene; PU: polyurethane.
When estimates in mg·L−1 were calculated, original published data are given.
For these two manta trawl samplings, mass concentration was estimated on reported concentrations in g·km−2, with an estimated trawling depth of 0.01 m, as done by Besseling et al. (21).
Estimated to directly enter the Black Sea, considered as a proxy of the concentration in the Danube estuary, where there are populations of wild oysters.
A concentration in pore water of 162 mg·L−1 was estimated by Besseling et al. (21), based on a mean concentration of 89 mg·kg−1 dry sediment (69) and with a sediment density of 2 kg·L−1 and a water content of 50% on mass basis. This estimate can go up to 780 mg·L−1 for the highest reported concentration in sediment (i.e., 391 mg·kg−1 dry sediment) (70).
To conclude, this study highlighted microplastic impacts on energy uptake and allocation and on reproductive health indices (i.e., quantity and quality of gametes produced), when oysters were exposed to micro-PS during gametogenesis. Strong negative effects were shown on broodstock fecundity and offspring growth at larval stages. The two explanatory hypotheses discussed in the present paper, a fall in energy allocated to reproduction via interference in digestive processes and endocrine disruption, are not mutually exclusive. We believe that, considering the strength of the impact on reproductive health indices, both forms of disruption may have occurred. However, the absence of endocrine disruptor detection in biological samples prevents us from drawing stronger conclusions about this second hypothesis. Transcriptomic profiles support this hypothesis, notably highlighting an alteration in glucocorticoid response, insulin pathway, and fatty-acid metabolism in oysters in response to micro-PS exposition. Further investigations are now necessary: first, to provide full environmental data on small microplastics <10 µm, requiring fundamental analytical developments (51) and, second, to compare our experimental results with in situ and experimental studies that closely mimic in situ conditions, in particular by using different shapes and forms of MP representative of those found in the field.
Methods
Experimental Exposure of Adult Oysters to Micro-PS.
The experimental procedures comply with French law and with institutional guidelines. Adult oysters purchased from a commercial hatchery (18 mo, 16.9 ± 5.3 g) were transferred to Institute Français de Recherche pour l’Exploitation de la Mer’s experimental facilities in March 2013. Histological visual inspection showed they were at reproductive stage 0 to early stage 1, corresponding to an undifferentiated state or developing early active gametogenesis (52). After acclimatization, the oysters were conditioned for 2 mo under suitable conditions for germ cell maturation (52). The oysters were placed in six experimental 50-L tanks (40 oysters per tank) supplied with filtered (1 µm), UV-treated running seawater (12.5 L·h−1) at 17.1 ± 0.5 °C and 34 PSU, and fed continuously on a mixed diet of two microalgae (Tisochrysis lutea, formerly Isochrysis sp., Tahitian strain: T. iso; CCAP 927/14, and Chaetoceros gracilis, UTEX LB2658) at a daily ratio equal to 8% dry weight algae/dry weight oyster. Control and micro-PS exposed treatments were set up with three tanks per condition. For each treatment, a fourth tank was deployed without oysters to evaluate algal and micro-PS sinking or sticking to the tank walls. To prevent micro-PS sinking, the water inflow was pressurized to create recirculating flow in the tank, and air bubbling was used. To reduce MP clumping and sticking to the flask walls, micro-PS particles were supplied to tanks with Tween-20 at a final concentration of 0.0002%. The same concentration of Tween-20 was supplied to the control tanks.
The purchased micro-PS were yellow-green fluorescent polystyrene beads (2 and 6 µm; Polysciences). These were supplied continuously to the tanks by peristaltic pumps from a concentrated micro-PS solution, maintained in a glass flask on a magnetic stirrer. Micro-PS concentrations were daily counted on an EasyCyte Plus flow cytometer (Guava-Merck-Millipore) giving an inflow concentration of 2,062 ± 170 and 118 ± 15 beads per mL−1 for 2- and 6-µm particles, respectively (namely a mass concentration of 0.023 mg·L−1) corresponding to an inflow daily ratio of 9.6-mg micro-PS d−1. The mass concentration in the surrounding water was of 0.01 mg·L−1 (i.e., 1,816 ± 76 and 21 ± 6 beads per mL−1 for 2- and 6-µm particles, respectively), which is far lower than most to which marine invertebrates have been exposed (from 0.8 to 2,500 mg·L−1) (10, 15, 17, 21) (Table S1). Microplastic concentration corresponded to 0.21% of the volume (µm3) of algae supplied.
Ecophysiological Measurements.
Once a day, inflow and outflow seawater was sampled from each tank. Phytoplankton counts were made using an electronic particle counter (Multisizer 3 equipped with a 100-μm aperture tube) to provide 50 d of continuous data. Algal consumption (C) was expressed in algal cell volume per oyster per day (μm3 oyster−1/d−1), as in Savina and Pouvreau (53). Polystyrene particle ingestion (I) was estimated in percentage micro-PS ingested: I = [(Ii−Io−Ib)/Ii] × 100, Ii being number of beads at the inlet, Io number of beads at the outlet, Ib number of beads remaining in the tank without oysters by subtracting inlet from outlet. Once a week, feces were collected from each tank to calculate the absorption efficiency (absorption efficiency, percent) of organic matter from ingested food (53).
Sampling.
At the beginning and the end of the experiment, 12 oysters per condition were killed to measure biometric parameters (total, shell, and dry weight). Condition index was calculated as: dry weight/(total weight-shell weight). At 2, 5, and 8 wk after the beginning of exposure (corresponding to T1, T2, and T3, respectively), eight animals per tank were sampled for flesh weight, hemolymph [taken as described by Haberkorn et al. (54)], and a transversal section of the gonadic area for histological examination. The remainder of the gonad and digestive gland were immediately frozen in liquid nitrogen for subsequent analyses. Oocytes were collected from five females per treatment, filtered in a 40-µm sieve, counted and transferred into 1.5 mL Extract-all reagent (Eurobio) (20,000 oocytes) and 5 mL lysis buffer (55) (200,000 oocytes) for RNA and protein analyses, respectively. For gamete quality measurements and larval rearing, gametes were collected at T3 in nine control and nine exposed animals of each sex by stripping the gonads.
Gamete Quality Analyses.
Sperm movement was triggered using a two-step dilution in an activating solution and analyzed using a CASA plug-in for ImageJ software. The percentage of motile spermatozoa and their velocity (VAP: Velocity of the Average Path) were assessed on a minimum of 30 spermatozoa, according to Suquet et al. (56). Oocyte diameter was assessed using ImageJ, by measuring Feret diameter. Triplicate lots of 25,000 oocytes per exposed and control female were fertilized using a nonlimiting sperm to oocyte ratio from a pool of three control males. D-larval yield was estimated at 48 h postfertilization: (number of D-larvae per 25,000 eggs) × 100.
Larval Rearing.
To test for impact on offspring, fertilizations were performed in triplicate for each condition; three pools of oocytes were fertilized separately using a pool of sperm at a ratio of 30 spermatozoa per oocyte. Embryos were maintained 48 h at 25 °C in 150-L tanks in 1-µm filtered seawater at a concentration of 50 embryos per mL−1. D-larvae were then transferred to 5-L cylindrical triplicate tanks at the density of 50 larvae per mL−1, and maintained in a flow-through rearing system (50% seawater renewal h−1, 25 °C, 34 PSU). Algae (T. lutea and C. gracilis) were continuously supplied as described by Gonzales Araya et al. (57). Larvae were sampled every 2–3 d and stored in a 0.1% formaldehyde-seawater solution until image analysis for size monitoring. Morphological competence for metamorphosis was determined when ≥50% of larvae reached the eyed-larvae stage. Larval size was assessed by measuring shell length using image analysis on at least 30 larvae per tank per day of sampling (WinImager 2.0 and Imaq Vision Builder 6.0 software for image capture and analysis, respectively).
Hemolymph Flow Cytometry Analysis.
Morphological parameters and oxidative activity of hemocyte subpopulations were measured as described by Haberkorn et al. (54) on 50-µL hemolymph using a FACScalibur (BD Biosciences) flow cytometer, equipped with a 488-nm argon laser.
Histology.
A 3-mm cross section of the visceral mass was excised in front of the pericardic region and immediately fixed in modified Davidson’s solution (52); n-butyl alcohol was used as a fixative to preserve the fluorescent polystyrene beads (58). Slides were examined under a light microscope to determine gametogenic stage. Presence of micro-PS in tissues was determined by examination of histological slides under a LEICA DMIRB inverted microscope (Leica Microsystems). Pictures were taken using a Retigua 2000R color camera and ImageJPro software.
Protein Extraction and Proteomic Analysis.
Total proteins were extracted and analyzed using 2D electrophoresis, and spots were quantified in Coomassie blue-stained gels as in Corporeau et al. (55). In-gel digestion was performed for excised spots based on their differential expression, as quantified using Progenesis SameSpots v1.5 software (Nonlinear Dynamics), followed by LC-MS/MS analyses (55).
RNA Extraction, Amplification, Labeling, and Microarray Hybridization.
Total RNA was isolated using Extract-all reagent (Eurobio) at a concentration of 1 mL/50 mg powder, treated with DNase I (Sigma, 1 U·µg−1 total RNA) and assayed for concentration and quality following Sussarellu et al. (59). For microarray hybridizations, 200 ng of total RNA (51 samples for gonads and digestive gland from females sampled at T1 and T3; and 8 oocyte samples taken at T3) were indirectly labeled with Cy3, using the Low Input Quick Amp labeling kit. Hybridization and scanning were performed on Agilent 60-mer 4 × 44K custom microarrays containing 31,918 C. gigas contigs (59).
Preprocessing and Microarray Data Analysis.
Microarray data were processed and analyzed using the language R/BioConductor (60) as in Sussarellu et al. (59). Normalized hybridization values were deposited in the Gene Expression Omnibus (GEO) repository with the accession number GSE71845. Statistical analyses to identify the differentially expressed transcripts in digestive glands and gonads were carried out by ANOVA. The fixed factors for the two-way ANOVA were treatment (MP exposure vs. control) and sampling time (T1 or T3). For oocytes, differentially expressed transcripts were detected by t test. The FDR associated with the selected transcripts was determined by: [total number of analyzed transcripts (31,918) × P value/number of differentially expressed transcripts] × 100; the FDR cut-off value was 5%. Hierarchical clustering was performed using the Ward method, and 1-correlation as dissimilarity matrix. Putative annotations of transcripts were identified using ngKlast software (KL Korilog Bioinformatics Solutions) against a protein database (E-value 1.0 × 10e−5) obtained from the C. gigas sequenced genome and transcriptome on GenBank (61). GO terms were obtained using ngKlast against the Swissprot database (E-value 1.0 × 10e−5). GO terms enrichment analysis was performed using the Fisher’s Exact test on Blast2Go (62).
Dynamic Energy Budget Design.
The DEB model simulations were performed as in Bernard et al. (63) to evaluate how physiological changes induced by micro-PS exposition affect energy fluxes and could explain observed phenotypic changes. The DEB model describes dynamics of four state variables: (i) the energy stored in reserves, E; (ii) energy allocated to structural growth, EV; (iii) energy allocated to development and reproduction, ER; and (iv) energy used in the construction of gametes, EGO (see ref. 63 for a full description). Initial state was obtained from the initial biometrics measurements and maturity observations. Oocyte production was calculated according to an energy content of 9.3 × 10⁻⁴ J·oocyte−1. Two parameters, namely the allocation fraction to structural growth and structural maintenance from reserves (the remainder being allocated to development/reproduction and maturity maintenance, κ) and the volume specific cost for maintenance rate ([ṗM], J⋅cm−3⋅d−1), were free fitted to evaluate the disturbance level in terms of micro-PS exposure that would lead to the observed growth and reproductive traits.
Statistical Analysis.
All analysis data were processed and analyzed using the language R/BioConductor (60), R Development Core Team (2008) by ANOVA (fixed factors were condition and sampling date) or t tests. Normality was screened on residuals and further tested using the Shapiro–Wilk test. When necessary, data were log-transformed, and angular transformation was used for percentage data. Homogeneity of variance matrices was assessed with a Fligner test. Least-significant difference post hoc tests were performed to discriminate groups. Data are expressed as mean ± confidence intervals (α = 5%). Analyses of microarray data are detailed above in the microarray data analysis section.
Methods of Micro-PS Chemical Analysis
Organic molecules leaching from micro-PS were measured either by: (i) dichloromethane extraction, (ii) in seawater, or (iii) in digestive styles by Stir Bar Sorptive Extraction (SBSE) (64). Micro-PS particles were extracted for 30 min using dichloromethane (Carlo Erba), then filtered with 0.7 µm GF/F WHATMAN filters. Extracted particles were analyzed by liquid injection in pulsed splitless mode at 300 °C, as described in Lacroix et al. (64), operating the mass spectrometer in scan mode. For the seawater samples, micro-PS were put in 100 mL seawater for 24 h at a similar experimental concentration, and SBSE were stirred in solution at 700 rpm for 2 h. For digestive styles, two pools of five styles collected in adult oysters were analyzed (control sample containing 10 µL Milli-Q water 0.1% Tween-20 and a sample containing 6,107 mL−1 of micro-PS particles in addition). Samples were incubated at room temperature for 24 h on an oscillating mixer, then 5 mL of reverse-osmosis water were added to the sample and SBSE were introduced for a 16 h period of stirring at 700 rpm. For both the aqueous phase and digestive styles, SBSE were removed from the solution, rinsed with reverse osmosis water, dried and placed on the automatic sampler to thermally desorb the compounds before GC/MS analysis following Lacroix et al. (64), using an Agilent 5975 Mass Selective Detector in scan mode.
Supplementary Material
Acknowledgments
We thank F. Galgani, M. Van der Meulen, L. Devriese, D. Vethaak, T. Maes, D. Mazurais, M. Alunno-Bruscia, S. Pouvreau, and P. Boudry for helpful discussions; H. McCombie for her help in editing the English; C. Laot, C. Quéré, M. Boulais, P. Le Souchu, P. Miner, B. Petton, A. L. Cassonne, and N. Le Cuff for technical assistance; all the staff of the Argenton hatchery; and the staff of the INSERM U1078 microarray core facility (Brest, France) and of the Proteomics Core Facility Biogenouest, INSERM U1085 (Rennes, France). This study was partly funded by the MICRO EU Interreg-funded project MicroPlastics (MICRO 09-002-BE).
Footnotes
The authors declare no conflict of interest.
This article is a PNAS Direct Submission. M.A.X. is a guest editor invited by the Editorial Board.
Data deposition: The data reported in this paper have been deposited in the Gene Expression Omnibus (GEO) database, www.ncbi.nlm.nih.gov/geo (accession no. GSE71845).
See Commentary on page 2331.
This article contains supporting information online at www.pnas.org/lookup/suppl/doi:10.1073/pnas.1519019113/-/DCSupplemental.
References
- 1.Rochman CM, et al. Policy: Classify plastic waste as hazardous. Nature. 2013;494(7436):169–171. doi: 10.1038/494169a. [DOI] [PubMed] [Google Scholar]
- 2.Jambeck JR, Geyer R, Wilcox C, et al. Plastic waste inputs from land into the ocean. Science. 2015;347(6223):768–771. doi: 10.1126/science.1260352. [DOI] [PubMed] [Google Scholar]
- 3.Wilcox C, Van Sebille E, Hardesty BD. Threat of plastic pollution to seabirds is global, pervasive, and increasing. Proc Natl Acad Sci USA. 2015;112(38):11899–11904. doi: 10.1073/pnas.1502108112. [DOI] [PMC free article] [PubMed] [Google Scholar]
- 4.Arthur C, Baker J, Bamford H, editors. 2009. Proceedings of the International Research Workshop on the Occurrence, Effects, and Fate of Microplastic Marine Debris. September 9–11, 2008. NOAA Technical Memorandum NOS-OR&R-30. p 530.
- 5.Costa MF, et al. On the importance of size of plastic fragments and pellets on the strandline: a snapshot of a Brazilian beach. Environ Monit Assess. 2010;168(1-4):299–304. doi: 10.1007/s10661-009-1113-4. [DOI] [PubMed] [Google Scholar]
- 6.Andrady AL. Microplastics in the marine environment. Mar Pollut Bull. 2011;62(8):1596–1605. doi: 10.1016/j.marpolbul.2011.05.030. [DOI] [PubMed] [Google Scholar]
- 7.Cole M, Lindeque P, Halsband C, Galloway TS. Microplastics as contaminants in the marine environment: A review. Mar Pollut Bull. 2011;62(12):2588–2597. doi: 10.1016/j.marpolbul.2011.09.025. [DOI] [PubMed] [Google Scholar]
- 8.Eriksen M, et al. Plastic pollution in the world’s oceans: More than 5 trillion plastic pieces weighing over 250,000 tons afloat at sea. PLoS One. 2014;9(12):e111913. doi: 10.1371/journal.pone.0111913. [DOI] [PMC free article] [PubMed] [Google Scholar]
- 9.Cózar A, et al. Plastic debris in the open ocean. Proc Natl Acad Sci USA. 2014;111(28):10239–10244. doi: 10.1073/pnas.1314705111. [DOI] [PMC free article] [PubMed] [Google Scholar]
- 10.Wegner A, Besseling E, Foekema EM, Kamermans P, Koelmans AA. Effects of nanopolystyrene on the feeding behavior of the blue mussel (Mytilus edulis L.) Environ Toxicol Chem. 2012;31(11):2490–2497. doi: 10.1002/etc.1984. [DOI] [PubMed] [Google Scholar]
- 11.Cole M, et al. Microplastic ingestion by zooplankton. Environ Sci Technol. 2013;47(12):6646–6655. doi: 10.1021/es400663f. [DOI] [PubMed] [Google Scholar]
- 12.Browne MA, Niven SJ, Galloway TS, Rowland SJ, Thompson RC. Microplastic moves pollutants and additives to worms, reducing functions linked to health and biodiversity. Curr Biol. 2013;23(23):2388–2392. doi: 10.1016/j.cub.2013.10.012. [DOI] [PubMed] [Google Scholar]
- 13.Wright SL, Rowe D, Thompson RC, Galloway TS. Microplastic ingestion decreases energy reserves in marine worms. Curr Biol. 2013;23(23):R1031–R1033. doi: 10.1016/j.cub.2013.10.068. [DOI] [PubMed] [Google Scholar]
- 14.Browne MA, Dissanayake A, Galloway TS, Lowe DM, Thompson RC. Ingested microscopic plastic translocates to the circulatory system of the mussel, Mytilus edulis (L) Environ Sci Technol. 2008;42(13):5026–5031. doi: 10.1021/es800249a. [DOI] [PubMed] [Google Scholar]
- 15.von Moos N, Burkhardt-Holm P, Köhler A. Uptake and effects of microplastics on cells and tissue of the blue mussel Mytilus edulis L. after an experimental exposure. Environ Sci Technol. 2012;46(20):11327–11335. doi: 10.1021/es302332w. [DOI] [PubMed] [Google Scholar]
- 16.Van Cauwenberghe L, Claessens M, Vandegehuchte MB, Janssen CR. Microplastics are taken up by mussels (Mytilus edulis) and lugworms (Arenicola marina) living in natural habitats. Environ Pollut. 2015;199:10–17. doi: 10.1016/j.envpol.2015.01.008. [DOI] [PubMed] [Google Scholar]
- 17.Avio CG, et al. Pollutants bioavailability and toxicological risk from microplastics to marine mussels. Environ Pollut. 2015;198:211–222. doi: 10.1016/j.envpol.2014.12.021. [DOI] [PubMed] [Google Scholar]
- 18.Graham ER, Thompson JT. Deposit- and suspension-feeding sea cucumbers (Echinodermata) ingest plastic fragments. J Exp Mar Biol Ecol. 2009;368(1):22–29. [Google Scholar]
- 19.Besseling E, Wegner A, Foekema EM, van den Heuvel-Greve MJ, Koelmans AA. Effects of microplastic on fitness and PCB bioaccumulation by the lugworm Arenicola marina (L.) Environ Sci Technol. 2013;47(1):593–600. doi: 10.1021/es302763x. [DOI] [PubMed] [Google Scholar]
- 20.Lee K-WW, Shim WJ, Kwon OY, Kang J-HH. Size-dependent effects of micro polystyrene particles in the marine copepod Tigriopus japonicus. Environ Sci Technol. 2013;47(19):11278–11283. doi: 10.1021/es401932b. [DOI] [PubMed] [Google Scholar]
- 21.Besseling E, Wang B, Lürling M, Koelmans AA. Nanoplastic affects growth of S. obliquus and reproduction of D. magna. Environ Sci Technol. 2014;48(20):12336–12343. doi: 10.1021/es503001d. [DOI] [PMC free article] [PubMed] [Google Scholar]
- 22.Cole M, Lindeque P, Fileman E, Halsband C, Galloway TS. The impact of polystyrene microplastics on feeding, function and fecundity in the marine copepod Calanus helgolandicus. Environ Sci Technol. 2015;49(2):1130–1137. doi: 10.1021/es504525u. [DOI] [PubMed] [Google Scholar]
- 23.Teuten EL, Rowland SJ, Galloway TS, Thompson RC. Potential for plastics to transport hydrophobic contaminants. Environ Sci Technol. 2007;41(22):7759–7764. doi: 10.1021/es071737s. [DOI] [PubMed] [Google Scholar]
- 24.Chapman RW, et al. The transcriptomic responses of the eastern oyster, Crassostrea virginica, to environmental conditions. Mol Ecol. 2011;20(7):1431–1449. doi: 10.1111/j.1365-294X.2011.05018.x. [DOI] [PubMed] [Google Scholar]
- 25.Barnes DK, Galgani F, Thompson RC, Barlaz M. Accumulation and fragmentation of plastic debris in global environments. Philos Trans R Soc Lond B Biol Sci. 2009;364(1526):1985–1998. doi: 10.1098/rstb.2008.0205. [DOI] [PMC free article] [PubMed] [Google Scholar]
- 26.Browne MA, Galloway TS, Thompson RC. Spatial patterns of plastic debris along Estuarine shorelines. Environ Sci Technol. 2010;44(9):3404–3409. doi: 10.1021/es903784e. [DOI] [PubMed] [Google Scholar]
- 27.Ward JE, Shumway SE. Separating the grain from the chaff: Particle selection in suspension- and deposit-feeding bivalves. J Exp Mar Biol Ecol. 2004;300(1-2):83–130. [Google Scholar]
- 28.Lusher AL, McHugh M, Thompson RC. Occurrence of microplastics in the gastrointestinal tract of pelagic and demersal fish from the English Channel. Mar Pollut Bull. 2013;67(1-2):94–99. doi: 10.1016/j.marpolbul.2012.11.028. [DOI] [PubMed] [Google Scholar]
- 29.Hussain N, Jaitley V, Florence AT. Recent advances in the understanding of uptake of microparticulates across the gastrointestinal lymphatics. Adv Drug Deliv Rev. 2001;50(1-2):107–142. doi: 10.1016/s0169-409x(01)00152-1. [DOI] [PubMed] [Google Scholar]
- 30.Navarro E, Iglesias JIPIP, Camacho APP, Labarta U. The effect of diets of phytoplankton and suspended bottom material on feeding and absorption of raft mussels (Mytilus galloprovincialis Lmk) J Exp Mar Biol Ecol. 1996;198(2):175–189. [Google Scholar]
- 31.Bayne BL. Phenotypic flexibility and physiological tradeoffs in the feeding and growth of marine bivalve molluscs. Integr Comp Biol. 2004;44(6):425–432. doi: 10.1093/icb/44.6.425. [DOI] [PubMed] [Google Scholar]
- 32.Donaghy L, et al. Reactive oxygen species in unstimulated hemocytes of the pacific oyster Crassostrea gigas: A mitochondrial involvement. PLoS One. 2012;7(10):e46594. doi: 10.1371/journal.pone.0046594. [DOI] [PMC free article] [PubMed] [Google Scholar]
- 33.Nagao M, Parimoo B, Tanaka K. Developmental, nutritional, and hormonal regulation of tissue-specific expression of the genes encoding various acyl-CoA dehydrogenases and alpha-subunit of electron transfer flavoprotein in rat. J Biol Chem. 1993;268(32):24114–24124. [PubMed] [Google Scholar]
- 34.Lettéron P, et al. Glucocorticoids inhibit mitochondrial matrix acyl-CoA dehydrogenases and fatty acid beta-oxidation. Am J Physiol. 1997;272(5 Pt 1):G1141–G1150. doi: 10.1152/ajpgi.1997.272.5.G1141. [DOI] [PubMed] [Google Scholar]
- 35.Levitan DR. Sperm velocity and longevity trade off each other and influence fertilization in the sea urchin Lytechinus variegatus. Proc Biol Sci. 2000;267(1443):531–534. doi: 10.1098/rspb.2000.1032. [DOI] [PMC free article] [PubMed] [Google Scholar]
- 36.Cannuel R, Beninger PG. Is oyster broodstock feeding always necessary? A study using oocyte quality predictors and validators in Crassostrea gigas. Aquat Living Resour. 2005;18(1):35–43. [Google Scholar]
- 37.Baynes SM, Howell BR. The influence of egg size and incubation temperature on the condition of Solea solea (L.) larvae at hatching and first feeding. J Exp Mar Biol Ecol. 1996;199(1):59–77. [Google Scholar]
- 38.Mtango NR, Potireddy S, Latham KE. Oocyte quality and maternal control of development. Int Rev Cell Mol Biol. 2008;268:223–290. doi: 10.1016/S1937-6448(08)00807-1. [DOI] [PubMed] [Google Scholar]
- 39.Leclerc C, Guerrier P, Moreau M. Role of dihydropyridine-sensitive calcium channels in meiosis and fertilization in the bivalve molluscs Ruditapes philippinarum and Crassostrea gigas. Biol Cell. 2000;92(3-4):285–299. doi: 10.1016/s0248-4900(00)01069-8. [DOI] [PubMed] [Google Scholar]
- 40.Rohlfs M, Arasada R, Batsios P, Janzen J, Schleicher M. The Ste20-like kinase SvkA of Dictyostelium discoideum is essential for late stages of cytokinesis. J Cell Sci. 2007;120(Pt 24):4345–4354. doi: 10.1242/jcs.012179. [DOI] [PubMed] [Google Scholar]
- 41.Sinsimer KS, Lee JJ, Thiberge SY, Gavis ER. Germ plasm anchoring is a dynamic state that requires persistent trafficking. Cell Reports. 2013;5(5):1169–1177. doi: 10.1016/j.celrep.2013.10.045. [DOI] [PMC free article] [PubMed] [Google Scholar]
- 42.Iyengar MR, et al. Expression of creatine kinase isoenzyme during oogenesis and embryogenesis in the mouse. Dev Biol. 1983;96(1):263–268. doi: 10.1016/0012-1606(83)90327-5. [DOI] [PubMed] [Google Scholar]
- 43.Gricourt L, Mathieu M, Kellner K. An insulin-like system involved in the control of Pacific oyster Crassostrea gigas reproduction: hrIGF-1 effect on germinal cell proliferation and maturation associated with expression of an homologous insulin receptor-related receptor. Aquaculture. 2006;251(1):85–98. [Google Scholar]
- 44.Tena-Sempere M. The roles of kisspeptins and G protein-coupled receptor-54 in pubertal development. Curr Opin Pediatr. 2006;18(4):442–447. doi: 10.1097/01.mop.0000236396.79580.cc. [DOI] [PubMed] [Google Scholar]
- 45.Kooijman SALM. Dynamic Energy Budget Theory for Metabolic Organisation. Cambridge Univ Press; Cambridge, UK: 2010. [DOI] [PubMed] [Google Scholar]
- 46.Muller EB, Nisbet RM, Berkley HA. Sublethal toxicant effects with dynamic energy budget theory: Model formulation. Ecotoxicology. 2010;19(1):48–60. doi: 10.1007/s10646-009-0385-3. [DOI] [PMC free article] [PubMed] [Google Scholar]
- 47.Huvet A, et al. Disruption of amylase genes by RNA interference affects reproduction in the Pacific oyster Crassostrea gigas. J Exp Biol. 2015;218(Pt 11):1740–1747. doi: 10.1242/jeb.116699. [DOI] [PubMed] [Google Scholar]
- 48.Waibel M, et al. Bibenzyl- and stilbene-core compounds with non-polar linker atom substituents as selective ligands for estrogen receptor beta. Eur J Med Chem. 2009;44(9):3412–3424. doi: 10.1016/j.ejmech.2009.02.006. [DOI] [PMC free article] [PubMed] [Google Scholar]
- 49.Kiyama R, Wada-Kiyama Y. Estrogenic endocrine disruptors: Molecular mechanisms of action. Environ Int. 2015;83:11–40. doi: 10.1016/j.envint.2015.05.012. [DOI] [PubMed] [Google Scholar]
- 50.Rochman CM, Kurobe T, Flores I, Teh SJ. Early warning signs of endocrine disruption in adult fish from the ingestion of polyethylene with and without sorbed chemical pollutants from the marine environment. Sci Total Environ. 2014;493:656–661. doi: 10.1016/j.scitotenv.2014.06.051. [DOI] [PubMed] [Google Scholar]
- 51.Filella M. Questions of size and numbers in environmental research on microplastics: Methodological and conceptual aspects. Environ Chem. 2015;12(5):527–538. [Google Scholar]
- 52.Fabioux C, et al. Temperature and photoperiod drive Crassostrea gigas reproductive internal clock. Aquaculture. 2005;250(1-2):458–470. [Google Scholar]
- 53.Savina M, Pouvreau S. A comparative ecophysiological study of two infaunal filter-feeding bivalves: Paphia rhomboïdes and Glycymeris glycymeris. Aquaculture. 2004;239(1-4):289–306. [Google Scholar]
- 54.Haberkorn H, et al. Cellular and biochemical responses of the oyster Crassostrea gigas to controlled exposures to metals and Alexandrium minutum. Aquat Toxicol. 2014;147:158–167. doi: 10.1016/j.aquatox.2013.12.012. [DOI] [PubMed] [Google Scholar]
- 55.Corporeau C, et al. Proteomic identification of quality factors for oocytes in the Pacific oyster Crassostrea gigas. J Proteomics. 2012;75(18):5554–5563. doi: 10.1016/j.jprot.2012.07.040. [DOI] [PubMed] [Google Scholar]
- 56.Suquet M, et al. Survival, growth and reproduction of cryopreserved larvae from a marine invertebrate, the Pacific oyster (Crassostrea gigas) PLoS One. 2014;9(4):e93486. doi: 10.1371/journal.pone.0093486. [DOI] [PMC free article] [PubMed] [Google Scholar]
- 57.Gonzalez Araya R, Mingant C, Petton B, Robert R. Influence of diet assemblage on Ostrea edulis broodstock conditioning and subsequent larval development. Aquaculture. 2012;364-365:272–280. [Google Scholar]
- 58.Callebaut M, Meeussen C. Method for the preservation of polystyrene latex beads in tissue sections. Stain Technol. 1989;2(64):100–102. doi: 10.3109/10520298909108055. [DOI] [PubMed] [Google Scholar]
- 59.Sussarellu R, et al. Additive transcriptomic variation associated with reproductive traits suggest local adaptation in a recently settled population of the Pacific oyster, Crassostrea gigas. BMC Genomics. 2015;16(1):808. doi: 10.1186/s12864-015-1972-8. [DOI] [PMC free article] [PubMed] [Google Scholar]
- 60.Gentleman RC, et al. Bioconductor: Open software development for computational biology and bioinformatics. Genome Biol. 2004;5(10):R80. doi: 10.1186/gb-2004-5-10-r80. [DOI] [PMC free article] [PubMed] [Google Scholar]
- 61.Zhang G, et al. The oyster genome reveals stress adaptation and complexity of shell formation. Nature. 2012;490(7418):49–54. doi: 10.1038/nature11413. [DOI] [PubMed] [Google Scholar]
- 62.Conesa A, et al. Blast2GO: A universal tool for annotation, visualization and analysis in functional genomics research. Bioinformatics. 2005;21(18):3674–3676. doi: 10.1093/bioinformatics/bti610. [DOI] [PubMed] [Google Scholar]
- 63.Bernard I, de Kermoysan G, Pouvreau S. Effect of phytoplankton and temperature on the reproduction of the Pacific oyster Crassostrea gigas: Investigation through DEB theory. J Sea Res. 2011;66(4):349–360. [Google Scholar]
- 64.Lacroix C, et al. Development of an innovative and “green” stir bar sorptive extraction-thermal desorption-gas chromatography-tandem mass spectrometry method for quantification of polycyclic aromatic hydrocarbons in marine biota. J Chromatogr A. 2014;1349:1–10. doi: 10.1016/j.chroma.2014.04.094. [DOI] [PubMed] [Google Scholar]
- 65.Gilfillan LR, Ohman MD, Doyle MJ, Watson W. Occurrence of plastic micro-debris in the southern California current system. CCOFI Rep. 2009;50:123–133. [Google Scholar]
- 66.Eriksen M, et al. Plastic pollution in the South Pacific subtropical gyre. Mar Pollut Bull. 2013;68(1-2):71–76. doi: 10.1016/j.marpolbul.2012.12.021. [DOI] [PubMed] [Google Scholar]
- 67.Moore CJ, Moore SL, Leecaster MK, Weisberg SB. A comparison of plastic and plankton in the north Pacific central gyre. Mar Pollut Bull. 2001;42(12):1297–1300. doi: 10.1016/s0025-326x(01)00114-x. [DOI] [PubMed] [Google Scholar]
- 68.Lechner A, et al. The Danube so colourful: A potpourri of plastic litter outnumbers fish larvae in Europe’s second largest river. Environ Pollut. 2014;188:177–181. doi: 10.1016/j.envpol.2014.02.006. [DOI] [PMC free article] [PubMed] [Google Scholar]
- 69.Reddy MS, Adimurthy S, Ramachandraiah G. Description of the small plastics fragments in marine sediments along the Alang-Sosiya ship-breaking yard, India. Estuar Coast Shelf Sci. 2006;68(3-4):656–660. [Google Scholar]
- 70.Claessens M, De Meester S, Van Landuyt L, De Clerck K, Janssen CR. Occurrence and distribution of microplastics in marine sediments along the Belgian coast. Mar Pollut Bull. 2011;62(10):2199–2204. doi: 10.1016/j.marpolbul.2011.06.030. [DOI] [PubMed] [Google Scholar]
Associated Data
This section collects any data citations, data availability statements, or supplementary materials included in this article.