

Significance
The mechanisms through which successful immunotherapy induces possible deletion, replacement, or reprogramming of T cells are unknown. By evaluating the expression of T-cell–related genes, and using appropriate multivariate statistical approaches, our data show that successful immunotherapy can induce previously unidentified CD4+ T-cell subtypes during treatment that could help to predict an “immune-tolerant” clinical phenotype identified after cessation of treatment. The ability to use “anergic” transcriptional phenotypes in single T cells to predict successful “immune tolerance” induction in the clinic setting, as suggested by our findings, could lead to transformative impacts in the field of immunotherapy.
Keywords: immunotherapy, T cells, gene expression, tolerance, anergy
Abstract
Allergen immunotherapy can desensitize even subjects with potentially lethal allergies, but the changes induced in T cells that underpin successful immunotherapy remain poorly understood. In a cohort of peanut-allergic participants, we used allergen-specific T-cell sorting and single-cell gene expression to trace the transcriptional “roadmap” of individual CD4+ T cells throughout immunotherapy. We found that successful immunotherapy induces allergen-specific CD4+ T cells to expand and shift toward an “anergic” Th2 T-cell phenotype largely absent in both pretreatment participants and healthy controls. These findings show that sustained success, even after immunotherapy is withdrawn, is associated with the induction, expansion, and maintenance of immunotherapy-specific memory and naive T-cell phenotypes as early as 3 mo into immunotherapy. These results suggest an approach for immune monitoring participants undergoing immunotherapy to predict the success of future treatment and could have implications for immunotherapy targets in other diseases like cancer, autoimmune disease, and transplantation.
Allergen immunotherapy (IT) is a process in which small amounts of allergen are given over time to the allergic individual until they can safely tolerate high amounts of allergen with no signs of clinical symptoms (1–9). In the regimen of oral IT for peanut-allergic patients (identified by an allergic reaction during a standardized blinded food challenge to peanut), small amounts of peanut flour protein are ingested and escalated to a servings-worth of peanut protein (4 g of peanut protein) over a period of 2–3 y (6-7). Most patients require continuous frequent (e.g., daily) exposure to such therapy for beneficial clinical outcomes. Mechanistic studies of oral IT to food allergens, although limited to date, show that plasma markers such as IgE and IgG4 immunoglobulins, skin test markers, component testing, and basophil activation tests are only weakly predictive of long-term clinical success (10–16). T cells are critical upstream regulators of allergic sensitization that are required to help B cells to synthesize IgE/IgG4 immunoglobulins, which then can activate or inhibit basophils and mast cells (10–17). Moreover, successful IT is associated with the development of regulatory T cells (Tregs) that are thought to dampen allergic reactivity to offending allergens (7). We therefore focused on finding T-cell markers of immune tolerance that could be detected early in the peripheral blood during IT. CD4+ T cells can be relatively long-lived (compared with plasma proteins and basophils) and changes detected early in populations of T cells could perhaps predict longer-lasting successful IT. For example, in one of the first studies in peanut allergen IT to withdraw therapy for more than 10 wk, we previously showed that despite negative skin tests to peanut, and high IgG4/low specific IgE levels to peanut, and decreased basophil reactivity to the allergen, some patients who withdrew from therapy for 3–6 mo were still reactive upon rechallenge with peanut (7). However, that study was limited because of uncertainty whether the T cells monitored were peanut specific. Furthermore, many other T-cell markers which could play a role in immune tolerance (18) were not analyzed (7).
Therefore, in the current study, we focused our research on peanut-specific T cells by using tetramer technology, and we performed multiplex transcriptional profiling on single CD4+ T cells. We hypothesized that allergic individuals have a complex set of antigen-specific and nonspecific CD4+ T lymphocytes, including allergic, nonallergic, anergic, and regulatory subtypes that undergo induction and/or transitions during IT. In addition, we posit that there may be certain subsets of CD4+ T lymphocytes that could predict more permanent vs. transient vs. refractory outcomes in IT. To test this hypothesis, we chose a model of antigen-specific oral IT for peanut allergens, and studied peripheral blood samples from the peanut-allergic and control participants in a small, phase 1 IT clinical study (7), while excluding potentially confounding variables, such as simultaneous exposure to multiple antigens and use of concomitant immunosuppressive agents. To enable the recovery of comparable allergen-specific T-cell populations, we limited the analyses to those participants whose specific HLA haplotypes matched available allergen-specific HLA-dextramer sorting reagents. Allergen-specific T cells were collected at four time points during the first 18 mo of IT (Fig. 1). In accordance with a previously published protocol (7), participants who had no signs of clinical reactivity on a standardized food challenge (i.e., to 4 g of peanut protein) at 24 mo were withdrawn from peanut IT for an additional 3 mo, and tested for any signs of allergic reactivity at 27 mo with the same standardized food challenge. Participants were defined functionally as either “immune tolerant” (i.e., no allergic reaction with the food challenge at 27 mo and thus possibly representing a more permanent clinical outcome), “desensitized” (i.e., any allergic reaction with the food challenge at 27 mo and thus possibly representing a more transient clinical outcome), or “refractory” (i.e., daily allergic symptoms to less than 300 mg peanut protein for at least 3 mo). Importantly, immunophenotyping of samples from these participants was done by blinded laboratory staff and were conducted before clinical outcomes of the participants had been determined, therefore permitting us to determine, once the study was completed, whether specific CD4+ T-cell subtypes could serve as possible predictors of immune tolerance.
Fig. 1.

Allergen-specific CD4+ T cells are collected before and throughout IT treatment and analyzed for gene expression at the single-cell level. Schematic of the overall oral IT study and the time-point analysis. Allergen-specific CD4+ T cells were sorted from peripheral blood monocytes from HLA-DR4+ and HLA-DR15+ peanut-allergic participants by HLA-matched Ara h 2-MHC dextramer reagents on FACS into individual wells, followed by transcriptional profiling of a targeted phenotypic marker panel by Fluidigm Biomark.
Prior transcriptional profiling studies of lymphocytes have been based on analyses of bulk cellular populations, making it impossible to discern the cell-fate pathways and clonal relatedness of individual T cells or even clusters of T cells of a common phenotype (7, 19, 20). By contrast, functional phenotyping a single-cell level allows one to discern and quantify individual cell phenotypes among complex mixtures of T cells. We sorted dextramer+ and dextramer− CD4+ T cells for single-cell gene-expression profiling (21) to investigate their ontogeny in vivo. Transcript profiling was limited to 22 markers using Fluidigm Biomark technology (22). Biological controls were obtained to compare healthy controls vs. subjects with peanut allergy at pretreatment, healthy controls vs. patients undergoing IT treatment, patients at pretreatment vs. during IT treatment, and dextramer+ vs. dextramer− CD4+ T cells (Figs. 2 and 3). We first performed univariate analysis comparing gene profiles of the sorted CD4+ cells, which demonstrated significance (P < 0.00057, Table 1) for many individual immune markers such as IL-13, CD25, IL-17A, IL-4, and ITGα4β7 between comparison groups. Interestingly, during IT some markers (CD28, CD27) seemed to “normalize” to healthy control levels but others, such as CCR7, CD25, and forkhead box P3 (FOXP3), remained significantly different (P < 0.00057, Table 1).
Fig. 2.

CD4+ T cells form clusters with distinct gene expression, with allergen-specific cells preferentially occupying IL4+/IL13+/CD69+ cluster 4 and FOXP3+/IL10+/CD25+ cluster 5. (A) Gap statistics graph illustrating the elbow method for determining the number of k-means clusters that best represents the variance observed in single-cell gene-expression data. Seven clusters were chosen. (B) Fraction of dextramer+ and dextramer− CD4+ T cells which belong to each cluster, and a heat map profile of relative gene expression for each cluster. *P < 0.0073, ns = not significant (χ2 tests with Bonferroni-corrected P-value cutoff for multiple testing). (C) Interquartile ranges of relative gene expression for each of the seven clusters.
Fig. 3.

Antigen-specific CD4+ T cells form seven cluster phenotypes with distinct gene expression. PCA representation of variations in cell phenotypes, plotting cells along (A) PC1 and PC2; (B) PC1, PC2, and PC3. The cells of all participants at all time points are colored according to the CD4+ T-cell clusters to which they were assigned using k-means. Variance accounted for by each PC: PC1 = 32.8%, PC2 = 15.8%, PC3 = 8.83%, PC4 = 6.34%.
Table 1.
Pairwise comparison of individual gene expression
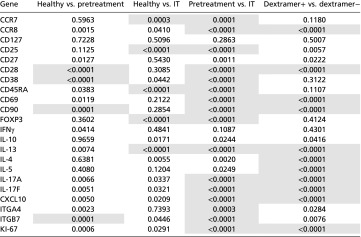 |
P values for t tests of pairwise comparisons of individual gene expression of CD4+ cells for healthy vs. pretreatment cells, healthy vs. IT cells, pretreatment vs. IT cells, and dextramer+ vs. dextramer− cells. Bonferonni-corrected P-value cutoff: P < 0.00057. Pretreatment cells include all cells from all pretreatment time points, and IT cells include all cells from all IT time points (IT-1, IT-2, IT-3, IT-4). Pretreatment cells and IT cells are from the same individuals.
Bonferroni-corrected P-value cutoff for each gene is 0.00057.
Significant differences in gene expression (shaded).
We next performed multivariate analysis of multiple immune markers simultaneously to detect possible novel CD4+ T lymphocyte subtypes. Phenotype clustering of single-cell gene-expression profiles obtained over the course of IT revealed distinct phenotypic clusters of CD4+ T cells, with marker combinations characteristic of Th2 “allergic” (IL4+/IL13+), “nonallergic” (IFN-γ+), “regulatory” (FOXP3+/CD25+/IL10+), and “anergic” (CD28-/CD38-/IFN-γ/IL4-/IL13-/IL10-) CD4+ T-cell subsets (Figs. 4 and 5). In summary, our data show, for the first time to our knowledge, that during the course of IT, antigen-specific CD4+ T cells of diverse T-cell receptor (TCR) clonal origin expanded in frequency, and transitioned from allergic and regulatory to anergic and nonallergic phenotypes, changes that were associated with decreased allergic symptoms and the development of operationally defined immune tolerance.
Fig. 4.

Cluster 6 T-cell receptor nonresponsive (CD28-/CD38-) noninterleukin secreting (IL13-/IL4-/IL10-/IL5-/IFNγ-) antigen-specific CD4+ T cells expand and allergy symptoms diminish over the course of IT. (A) Interquartile ranges for ppm of antigen-specific CD4+ T cells from pooled healthy (n = 7), pretreatment (n = 5), IT-1 (n = 5), IT-2 (n = 5), IT-3 (n = 2), and IT-4 (n = 2) participants. *P < 0.01, ns = not significant (t tests comparing each time point to healthy controls with Bonferroni-corrected p-value cutoff for multiple testing). (B) The fractional proportion of dextramer+ CD4+ T cells in each phenotype cluster from all participants at each IT time point IT-1 (n = 5), IT-2 (n = 5), IT-3 (n = 2), and IT-4 participants (n = 2), pretreatment (n = 5), and healthy controls (n = 7). (C) Percentage of doses resulting in allergy symptoms observed within 2 h of daily peanut ingestion within each IT time frame drawing from all IT participants.
Fig. 5.

Temporal expression of CD4+ T-cell clusters reveals individualized patterns associated with clinical phenotypes. (A) Two-dimensional PCA of antigen-specific CD4+ T cells from all healthy subjects (green), and all pretreatment time points (black), IT-1 (yellow), IT-2 (orange), IT-3 (pink), and IT-4 (red) time points for IT participants. Variance accounted for by PCs: PC1 = 32.8%, PC2 = 15.8%. (B) Representative phenotypic shifts across IT time points from one immune tolerant subject, one refractory subject, and one desensitized subject, displayed via 2D-PCA for antigen-specific CD4+ T cells from immune-tolerant, desensitized, or refractory participants over the course of IT. Gray dots represent cells from other participants. (C) Interquartile range of “phenotypic shift” distances for dextramer+ CD4+ T cells from individual participants between IT time points. The one immune-tolerant subject, one refractory subject, and one desensitized subject are the same individuals that appear in B. Higher shift values indicate greater average change in CD4+ allergen-specific phenotype between time points. Phenotype shifts were for months 0–18 during IT, whereas “desensitized/immune tolerant/refractory” status was determined at month 27. *P < 0.001, ns = not significant (one-way ANOVAs). The calculations were performed from every cell in one time point to every cell in the next time point within an individual. The total number of cell–cell comparisons are summarized in Table S2.
Results
CD4+ T-cell Transcriptional Profiling.
We performed transcriptional profiling of individual dextramer+ and dextramer− CD4+ T lymphocytes throughout the course of IT in vivo, using a regimen of peanut oral IT to test our hypothesis. IT was given to peanut-allergic participants, who had no other known allergies, under a published protocol (7), and peripheral blood was collected from these participants at different time points before treatment (pretreatment time points) and during IT at 3 mo (IT-1), 6–7 mo (IT-2), 9–10 mo (IT-3), and 11–18 mo (IT-4) (Fig. 1). One IT-3 blood draw was performed at 9 mo and the other was performed at 10 mo, whereas one IT-4 blood draw was performed at 11 mo and the other at 18 mo. Participants from whom blood was drawn pretreatment are the same individuals from whom blood was drawn during IT. CD4+ lymphocytes from each participant were labeled with dextramers specific for the peanut-derived antigen Ara h 2 23 (Fig. 1), the most widely recognized peanut antigen among allergic individuals (23) and dextramer+ and dextramer− CD4+ T cells were sorted separately into single-cell wells, followed by profiling of genes expressed in T cells like CD69, Ki67, CD28, CD38, CD27, CD127, IL-4, IL-13, IFN-γ, ITGα4β7, FOXP3, and IL-10 and others (Table S1) to generate heat maps and determine immunophenotyping of CD4+ T-cell subtypes (Fig. S1) (24).
Table S1.
Biomarker panel markers
| Number | Biomarker |
| 1 | ITGA4 (α4 integrin) |
| 2 | ITGB7 (β7 integrin) |
| 3 | CCR7 |
| 4 | CCR8 |
| 5 | CD25 |
| 6 | CD27 |
| 7 | CD28 |
| 8 | CD38 |
| 9 | CD45RA |
| 10 | CD69 |
| 11 | CD90 |
| 12 | CD127 |
| 13 | FoxP3 |
| 14 | IFNγ |
| 15 | IL-4 |
| 16 | IL-5 |
| 17 | IL-10 |
| 18 | IL-13 |
| 19 | IL-17A |
| 20 | IL-17F |
| 21 | CXCL10 (IP-10) |
| 22 | Ki-67 |
| 23 | CD19 (− control) |
| 24 | 18S (+ control) |
Fig. S1.

Single-cell gene-expression analyses of CD4+ T cells in allergic disease identifies differential gene expression. (A) Heat map of differential gene expression among all individual cells (rows) and 22 T-cell–related genes (columns) up-regulated (red) or down-regulated (green). Unsupervised k-means clustering divided individual cells into seven clusters, indicated to the right of the heat map. (B) Heat map of differential gene expression (red = up-regulated, yellow = down-regulated) for all individual cells, (C) negatively sorted cells (dextramer−), (D) positively sorted cells (dextramer +), (E) cells from nonallergic participants, (F) cells from IT-treated participants, and (G) cells from non–IT-treated allergic participants). Dendrograms in A–G show clustering of markers based on similarity of expression profile using the complete linkage clustering.
Table S2.
RMSD cell comparisons
| Subject | Pretreatment > IT-1 | IT-1 > IT-2 | IT-2 > IT-3 |
| Immune tolerant | 476 | 308 | 1,034 |
| Desensitized | 3,496 | 1,380 | 780 |
| Refractory | 1,000 | 1,175 | 3,666 |
Cell comparisons per subject per time point in RMSD calculation for Fig. 5C.
t tests of individual gene expression for dextramer+ CD4+ T cells between healthy controls vs. pretreatment (all pretreatment time points), healthy controls vs. IT treatment (all IT time points), pretreatment vs. IT treatment, and dextramer+ vs. dextramer− CD4+ T cells, identified several shared significant markers (P < 0.00057) across two or more comparisons, particularly CD28, IL-10, FOXP3, IL-17a, ITGα4β7, IL-13, CCR7, CCR8, and CD25 (Table 1). The most frequent statistically significant changes (P < 0.00057) were detected in the pretreatment vs. IT treatment comparison. In addition, there were several markers that were statistically different between dextramer+ and dextramer− CD4+ T cells (Table 1). Notably, the elbow method for gap statistics performed on all data (including all healthy, pretreatment, and IT cells) identified seven clusters of CD4+ T cells with distinct gene-expression patterns (Fig. 2A). The elbow method for gap statistics looks at the percentage of variance explained as a function of the number of clusters in a data set, seeking to choose a number of clusters so that adding more clusters does not significantly improve the modeling of the data (25). Each of the seven clusters identified had a particular “phenotype” assigned using the expression level, or absence, of specific transcripts (Fig. 2 B and C, Table 2, and Fig. S2). Within most clusters, there were allergen-positive CD4+ T lymphocytes and, to a lesser extent, negatively sorted (dextramer−) cells (which represent a cell population that is over 90% nonspecific because these cells do not have a TCR cognate for the peanut peptide-MHC used in the staining reagent) (26) (Fig. 2B). Comparison of the dextramer+ vs. dextramer− composition of each cluster by t tests showed statistically significant (P < 0.01) different proportions of antigen-specific CD4+ T cells in each cluster, except cluster 7 (Fig. 2B). Cluster 1, IFNγ-expressing cluster 2, and nonallergic cluster 3 were primarily composed of dextramer− or “antigen-nonspecific” cells. The allergic cluster 4 and regulatory cluster 5 consisted exclusively of dextramer+ or “antigen-specific” cells, whereas anergic memory cluster 6 was primarily composed of dextramer+, antigen-specific cells. IL-10 expressing cluster 7 exhibited a roughly equal mixture of antigen specific and antigen nonspecific cells (Fig. 2B).
Table 2.
CD4+ T-cell cluster characteristics
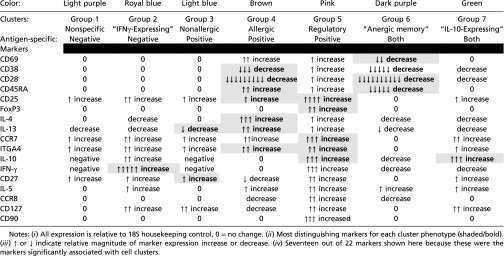 |
Fig. S2.

IT changes gene expression among antigen-specific CD4+ T-cell clusters. Relative transcript expression levels for individual markers from antigen-specific CD4+ T-cell clusters from healthy nonallergic (green), pretreatment participants (black), and participants during IT at IT-1 (yellow), IT-2 (orange), IT-3 (pink), and IT-4 (red) time points for (A) cluster 1, (B) cluster 2, (C) cluster 3, (D) cluster 4, (E) cluster 5, (F) cluster 6, and (G) cluster 7.
Dextramer+ cells are strongly enriched for allergy-associated phenotypes, demonstrating the specificity of the dextramer reagents used (Fig. 2B). Nonspecific binding of dextramer reagents would assume to sample randomly from antigen-specific and antigen-nonspecific T cells, and therefore to resemble the phenotypic distribution of the background population and not to enrich specifically for allergy-related phenotypes. However, the phenotypic characterization of the dextramer+ cells is consistent with what is currently assumed regarding the phenotypes of allergen-specific T cells, including being greatly enriched IL4+/IL13+ cells as well as FOXP3+/IL10+/CD25+ cells compared with dextramer-cell types (Fig. 2B).
Differential Cluster Gene Expression.
Gene-expression profiling allowed the phenotypic categorization of particular CD4+ T-cell clusters, including cluster 5, which exhibited increased IL-10, CD25, and FOXP3 expression, features associated with Tregs (27, 28), cluster 4, with increased IL-4 and IL-13 and low CD27, features linked to allergic Th2 cells (2), cluster 6, with low CD28 and Ki-67, features linked to anergic T cells (29), cluster 3, with high CD27 and low IL-4 and IL-13 expression, features linked to nonallergic cells (2), and cluster 2, with increased IFN-γ, a feature linked to Th1 cells (30) (Fig. 2 B and C, Table 2, and Fig. S2). Interestingly, only the anergic cluster 6 had a memory phenotype, exhibiting low CD45RA expression (Fig. 2 B and C, Table 2, and Fig. S2).
We next used principal components analysis (PCA) to globally visualize gene expression of single CD4+ T cells. PCA allows for data visualization by reducing the dimensionality of the data by deriving principal components (PCs) that account for the variation in the data. Plotting the individual cells along the first 2–3 PCs showed a clear separation of distinct CD4+ T-cell clusters, including separation and clustering of allergic cluster 4, regulatory cluster 5, and anergic memory cluster 6 (Fig. 3 A and B). Plotting along PC2 and PC3 continued to show distinct separation of CD4+ T-cell clusters, despite accounting for a smaller percentage of the data’s variance than PC1 and PC2 (Fig. 3B).
IT Changes Cluster Proportion.
Because previous studies showed that IT induces phenotypic changes in bulk T cells (31), we visualized the changing composition of all seven clusters in antigen-specific CD4+ T cells from individual participants during the course of IT. Compared with healthy controls, IT participants had significantly increased frequencies of antigen-specific CD4+ T cells over the duration of treatment (P < 0.01) (Fig. 4A). In Fig. 4, it appears that whereas healthy individuals have a distribution of phenotypes in their allergen-specific CD4+ T cells that are similar to allergic patients, it is the number of these cells that is significantly different at some time points during IT (Fig. 4A). The allergic individuals have less cluster 4 (IL4+/IL13+) cells at baseline, but more cluster 1 (also IL4+/IL13+) cells than healthy controls.
Antigen-specific CD4+ T-cell clusters were recognized that were associated with IT vs. pretreatment (Fig. 4B). At IT-1 (3 mo into IT), compared with pretreatment, there was an increase in CD4+ T cells in the allergic cluster 4 and anergic memory cluster 6, and a decrease in CD4+ T cells in regulatory cluster 5 (Fig. 4B). As IT progressed, the anergic memory cluster 6 markedly increased, which was associated with a decrease in allergic cluster 4, beginning at IT-2 (6–7 mo into IT), and a reduction of allergy symptoms (Fig. 4B). Interestingly, at IT-2 there was an increase in nonallergic cluster 3 and a maintenance of IL-10-expressing cluster 7. Importantly, over time, the anergic memory cluster 6 increased at later IT time points (IT 3 and 4) compared with earlier IT time points (pretreatment, IT-1, and IT-2) (Fig. 4B). Further, CD4+ T cells in regulatory cluster 5 decreased as IT progressed, and were undetectable at IT-4 (at 11–18 mo into IT) compared with pretreatment.
Antigen nonspecific cells did not exhibit significant changes in cluster distribution during IT, indicating that IT induced changes predominately among antigen-specific CD4+ T cells (Fig. S3A). When observing the distribution of antigen-specific CD4+ T cells in an individual participant, the relative contribution of anergic memory cluster 6 continued to increase as IT progressed (Fig. S3B). Peanut-allergic participants at pretreatment and healthy controls maintained an equal distribution of cells across the different clusters over time, although some nonstatistically significant (P > 0.05) fluctuations in clusters were observed (Fig. S3 C and D).
Fig. S3.

CD4+ T cells of altered phenotypes expand or contract over time and during IT. The fractional proportion of each CD4+ T-cell cluster for (A) negatively sorted CD4+ T cells (antigen nonspecific) at pretreatment (n = 3) and at IT-2 (n = 3) from all individuals from whom negatively sorted cells were acquired, (B) antigen-specific CD4+ T cells from a single subject at pretreatment: 1 (−6 mo), 2 (−3 mo), and 3 (0 mo), and during IT at IT-1, IT-2, and IT-3, (C) antigen-specific CD4+ T cells from healthy control participants at pretreatment (n = 7) and 6 mo later without IT (n = 7), and (D) antigen-specific CD4+ T cells from allergic participants at pretreatment (n = 5) and 6 mo later without IT (n = 5).
Importantly, we juxtaposed the aggregated clinical symptoms of the participants undergoing IT with the same time points in which immune monitoring occurred (Fig. 4C). As a participant ingests the food allergen as part of their IT regimen, we found that allergic symptoms such as skin rash, abdominal pain, and respiratory symptoms decreased in frequency over the time course of IT. This decrease in allergic reaction frequency over time in IT is associated with the concomitant increase in the anergic memory CD4 antigen-specific immunophenotype (Fig. 4 B and C).
Furthermore, other immune markers were examined in these same participants, including skin tests, basophil activation tests, and levels of IgG4 and IgE antibodies. Tests in healthy controls did not show significant activation of their basophils upon stimulation with peanut compared with media (less than 3% difference in percentage of CD63+ cells for all patients), nor did healthy controls have high levels of IgE specific to peanut (<0.35 kUA/L for all individuals) or IgG4 specific to peanut (<0.14 mgA/L for all individuals). Although there were differences in basophil activation, IgE levels, skin tests, and IgG4 levels among allergic individuals, we found that in the small group of subjects analyzed, none of these markers were specifically associated with immune-tolerant vs. desensitized vs. refractory clinical phenotypes (Fig. S4). Importantly, changes in certain T-cell phenotypes occurred before changes in levels of IgE or IgG4, or in results of basophil activation (Fig. S5).
Fig. S4.

Basophil activation and IgE and IgG4 levels among allergic participants are not predictive of clinical outcome. (A) Difference of percentage of CD63+ cells when stimulated with peanut vs. media for individual participants. (B) Concentration of IgE in the blood of individual participants. (C) Concentration of IgG4 in the blood of individual participants. Each line represents measurements from a single individual. Healthy control status and clinical outcome for allergic participants are indicated in the figure legend.
Fig. S5.

Comparison of biomarkers shows timing of phenotypic shifts. A comparison among allergic individuals of average IgE concentration, average IgG4 concentration, average basophil activation, and fractional proportion of T cells in cluster 6 as a percentage of each marker’s level at baseline. Mean concentrations are calculated at each time point using data from each individual who donated a sample at that time point.
Distinct Clustering Linked to Tolerance.
We next tested whether the changes in phenotypes of antigen-specific CD4+ T cells could be used to predict individual clinical outcomes following IT. To do this, we visualized transitions in CD4+ T-cell phenotypes during the course of IT among individual participants for whom we later determined clinical phenotypes of refractory, immune tolerant, or “desensitized.” PCA permitted us to detect distinct T-cell clusters over time during IT, with distinct individual gene-expression patterns for T cells in each cluster at each IT time point (Fig. 5 A and B and Table 1). At pretreatment, there was a diversity of clusters represented for all participants. Interestingly, in both the refractory and immune-tolerant patients, there were no allergic cells at pretreatment but at IT-1 there was a significant transition toward allergic cluster 4 cells for the refractory clinical phenotype with an indistinct scattering of cells across several clusters as IT progressed (Fig. 5 A and B). Whereas cells remained partly scattered across clusters in the desensitized clinical phenotype during IT, there was some transition toward nonallergic and anergic memory clusters as IT progressed (Fig. 5B). In contrast, for the immune-tolerant clinical phenotype, cells transitioned distinctly to nonallergic cluster 3 and anergic memory cluster 6 during IT (Fig. 5B).
A comparison of levels of each biomarker per cluster demonstrated significant differences (P < 0.00057) in the pretreatment vs. IT groups and a shift over time toward the anergic memory cluster (Table 1). The phenotypic shift distance, a measure of variation in all markers for each cell from one IT time point to the next, revealed that immune-tolerant and desensitized clinical phenotypes had statistically significant (P < 0.001) reduced variance in the later stages of IT (Fig. 5C). The refractory clinical phenotype, however, exhibited greater phenotypic shifting throughout IT (P < 0.001) (Fig. 5C). Overall, antigen-specific CD4+ T cells in immune-tolerant and desensitized individuals appeared to settle on anergic memory or nonallergic immunophenotypes during IT, whereas those in the refractory clinical phenotype continued to represent several different phenotypes.
CD4+ T-Cell TCR and Gene Expression.
Because successful IT induced significant increases in anergic memory and nonallergic CD4+ T-cell clusters, we sought to define the characteristics of CD4+ T-cell clones in a representative immune-tolerant clinical phenotype. We sequenced TCRs and determined additional gene expression in individual antigen-specific and nonspecific CD4+ T cells (21) from an immune-tolerant participant at IT-2, when several of the phenotypic transitions began to emerge (Figs. 4B and 5B). By doing this, we gained insight into the clonal TCR and additional gene-expression changes linked to tolerance induction.
Both antigen-specific and nonspecific CD4+ T cells were observed to be polyclonal, indicating no particular TCR bias (Fig. 6). TGF-β1, which has been linked to tolerance induction and Th2 inhibition, was expressed by several clones (Fig. 6) (32, 33). Runt-related transcription factor, RUNX1, which represses Th2 programming (34), was expressed in multiple clones (Fig. 6). Interestingly, GATA-3, the transcriptional regulator of Th2 development, was expressed in several antigen-nonspecific clones, often in association with TGF-β1, and not IL-13, a Th2 cytokine (Fig. 6). The Th1 cytokine, TNFα, was expressed by many clones, often concurrently with TGF-β1, but not necessarily with T-BET, the transcriptional regulator of Th1 development (Fig. 6). Expression of TNFα is consistent with presence of Th1 cells; however, it is difficult to draw definitive conclusions based on a limited number of cells. Few other cytokine transcripts were expressed by the selected clones, including limited expression of IFN-γ, IL-13, IL-12, and IL-21. The follicular helper T-cell (Tfh) lineage commitment factor BCL-6, was expressed by some antigen-specific clones, raising the possibility that Tfh may have a role in tolerance induction during IT (Fig. 6). Additionally, one FOXP3-expressing clone was observed (Fig. 6). Although all dextramer+ cells were unique, in 1,000 repeat random subsamplings of 13 CDR3 sequences from 5′RACE-derived, naive TCR repertoire, four motifs (GLT, PTG, LTD, and RVA) were found to be significantly elevated above expectation in the dextramer+ set (P < 0.01). These four motifs occur in partially overlapping regions in the middle of TCRb CDR3, shared across 4 of the 13 recovered dextramer+ single cells. Overall, during successful IT, it is possible to observe marked expression of tolerogenic TGF-β1 and indistinct lineage commitment or cytokine expression by CD4+ T cells.
Fig. 6.

Single-cell TCR sequencing and gene expression during successful IT demonstrates tolerogenic gene expression without defined lineage commitment. TCR sequencing of CDR3 regions and Vβ, Vα, Jα, and Jβ use, and RT-PCR of transcript expression, for individual sorted dextramer+ or dextramer− CD4+ T cells at IT-2 from one participant later determined to be immune tolerant. Shaded boxes represent gene expression of FOXP3, GATA3, IFN-γ, IL-13, IL-12, IL-21, T-BET, TGF-β1, TNFα, BCL-6, RUNX1, or RUNX3. Horizontal line separates data from dextramer− cells (above the line) and dextramer+ cells (below the line).
Discussion
Our goal in this study was to identify mechanisms involved in IT by using single-cell gene profiling, combined with multivariate statistical analyses. Quantifying single-cell gene expression has applications across many biological fields (35–37). High-throughput transcriptional profiling of single cells and computational modeling enabled us to track, on an unprecedented level, the molecular details of CD4+ lymphocytes during IT in vivo. We found evidence of both antigen-specific and -nonspecific CD4+ lymphocytes belonging to seven different phenotypic clusters with distinct gene-expression profiles. Many of our computational analyses of phenotypic transitions were possible only with data derived from single cells. In particular, our data showed significant distinct transitions in antigen-specific CD4+ T cells that were not observed in antigen-nonspecific CD4+ T cells. Notably, shifts in T-cell populations appeared before significant changes in basophil activation, IgE levels, or IgG4 levels, and were more predictive than such tests of an individual participant’s clinical outcome (Figs. 4 and 5 and Fig. S4). These findings demonstrate the potential importance of monitoring T cells during IT and suggest that single-cell approaches may be useful for future studies on the effects of IT and the immune monitoring of individuals undergoing IT. Further, significant differences in CD28 and CD38 expression between experimental groups suggest that it would be interesting in future studies to monitor other cell types, such as B cells and natural killer cells, which express the same markers as the T cells we monitored in our study.
Although Ara h 2 is only one among multiple clinically relevant peanut allergens, it is of great significance that this single representative allergen allows for complex insights into the cellular mechanisms of the allergic process. It is significant that strong statistical statements and predictive observations can be made using Ara h 2 as a single representative allergen. It is possible that the population of dextramer− cells could contain some CD4+ T cells specific against other peanut allergen peptides displayed on the same or other HLA molecules. However, given the frequency of the known immunodominant peanut-specific cells (5–20 cells per million) (Fig. 4A), even with 1,000 different peanut epitopes just as immunodominant as the one we investigated, with each represented at 20 parts per million, we would expect less than 1 in 50 T cells would be allergen-specific from the circulating CD4+T-cell repertoire, and thus would not affect our statistical results in any meaningful way. Further, it is worth noting that although cells were obtained from the peripheral blood rather than the gut, studies in celiac disease have indicated that several days after ingesting bread, gliadin-specific T cells appear in the peripheral blood (38). Therefore, we speculate that daily exposure to peanuts through oral IT may contribute, via egress of peanut-specific T cells from the gut to the blood, to elevations in the frequencies of peanut-specific T cells in the peripheral blood of patients during IT.
Although there was a relatively small sample size of participants in our study, we were able to follow their single cells sequentially over time and therefore perform detailed, multidimensional comparisons against a previous time point. To address the small sample size, we conducted studies in many control settings (i.e., health controls vs. allergic controls, pretreatment vs. treatment, negative-sorted vs. positive tetramer-sorted cells) to best determine the biological significance of our findings. Sequential single-cell gene-expression measurements in CD4+ T lymphocytes during the course of IT identified unique sets of T-cell clusters that were significantly linked to the immune-tolerant clinical phenotype. As IT progressed, anergic memory and nonallergic antigen-specific CD4+ T lymphocytes were significantly induced only in the immune-tolerant individuals. A regulatory CD4+ T-lymphocyte cluster was also observed as having CD45RA expression. Perhaps there is meaningful variation in the intermediate region of the CD45RA expression and further studies will be done to characterize these potential regulatory populations. The regulatory cluster expressed CD127, suggesting that it is likely an induced regulatory T-cell subset, not a thymic-derived regulatory subset (3, 27, 39. At the same time points, the desensitized clinical phenotype exhibited a greater dispersion of cells across the different clusters, with only some transitions toward nonallergic and anergic memory clusters. Notably, the desensitized subject was the only one of these three subjects to have allergic cells pretreatment. This might be predictive of clinical outcome. In contrast, in the refractory clinical phenotype, cells spread indistinctly across several different clusters as IT progressed. Of interest is a shift in the refractory patient from no allergic cells at pretreatment to a large number of allergic cells at IT-1 (correlating with the peak of allergic symptoms) before transitioning toward anergic and nonallergic phenotypes at later IT time points. This spike in allergic cells coinciding with IT-1, which was not seen in either the immune-tolerant or desensitized patient, may be predictive of the refractory clinical phenotype. By using current single-cell sorting technology, we were able to distinguish distinct anergic and nonallergic cellular phenotypes that could not have been identified using traditional immunophenotyping methods (39). Defining phenotypic transition patterns in antigen-specific and antigen-nonspecific lymphocytes during successful IT might allow us to infer the timing of expression changes in key genes associated with induction of tolerance.
We defined the anergic memory phenotype by the lack of costimulatory receptor CD28 and the proliferation-associated antigen Ki-67, and low-to-absent expression of the early activation marker CD69, indicating a nonproliferating, nonactivated phenotype with diminished CD28 signaling potential, which has been linked to anergic CD4+ T cells (40). However, our current single-cell gene-expression study was technically limited by the number of markers that could be used for the comprehensive detection of anergic cells. Using a more expansive panel of anergy markers (i.e., Cbl-b, GRAIL, program-death-1, and cytotoxic T-lymphocyte-associate protein-4) (20, 41–45) may elucidate in greater detail the transitioning phenotypes of anergic cells during IT.
Although the generation of long-lived memory lymphocytes would seem to be an essential feature of IT, we observed several changes in the naive antigen-specific and -nonspecific CD4+ T cells. Most importantly, the predominant anergic cluster 6 lymphocytes induced during IT had a memory phenotype and were increased substantially over all other clusters. Although there is background variability between subjects at pretreatment time points, the expansion of the anergic cluster 6 can be seen to be much larger than any background variation (Fig. 4) and was statistically significant compared with background (P < 0.01). This may indicate that repeated antigen treatments during the course of IT may be critical for anergy induction in memory CD4+ T cells, and for the promotion of a tolerogenic environment that inhibits pathogenic CD4+ T-cell recruitment and aberrant responses (43). Although we do not usually think of anergic cells as a population that proliferates, there are some plausible explanations of this observed phenomenon. A change in IL-2 production could account for this expansion. Also, it is plausible that through the course of IT other nonanergic cell types are activated and proliferate before becoming anergic. These cells may then act upon subsequent allergen exposure, suppressing the allergic response. It would be interesting in future studies to further elucidate the mechanism of this observed expansion, and to define in greater detail the phenotype of these cells, measuring the presence of cytokines (such as IL-2) and markers of effector memory T cells (such as CD62L).
Our results also suggest that successful IT can induce polyclonal antigen-specific and -nonspecific CD4+ T cells, with indistinct lineage commitment, possibly indicating their functional plasticity and transitory phenotype. During successful IT, several clones expressed TGF-β1, which has been linked to anergy and tolerance induction during IT, typically by way of Tregs (31). Further, clones expressing GATA-3 also largely coexpressed TGF-β1, which inhibits GATA-3–driven Th2 differentiation (33). This may be another indication of transitory CD4+ T-cell phenotypes within a successfully treated individual, with allergic Th2 cells undergoing transcriptional reprogramming to tolerogenic TGF-β1-expressing cells. Additionally, several clones expressing TNFα also coexpressed TGF-β1, again indicating functional plasticity and transitory phenotypes of CD4+ T cells during IT.
The results of the TCR sequencing gives confidence that the cells we sequenced are representative of a larger pool of antigen-specific T cells and do not display only clones that were greatly expanded. Initially when performing our phenotype analysis we did have some concerns that there might be large clonal expansions that would bias our analysis of T-cell phenotypes toward the most expanded T cells. However, in our TCR sequencing analysis, we determined that the recovered populations are quite diverse. This implies that the total number of allergen-specific clones is considerably larger than the number of T cells that we characterized, and that the single-cell phenotyping analysis performed was sampling phenotypes from almost entirely nonredundant clones. Further, evidence of specific shared and overlapping CDR3 motifs could possibly indicate that a diverse population of clones converges to recognize pMHC complexes with similar selected amino acid motifs. In future studies, this suggests that such motifs could be used to recognize allergen-specific T cells from primary sequence (21). Although we only acquired TCR sequencing data during treatment, it would be interesting in future studies to match TCR sequencing data obtained during treatment to TCR sequencing data acquired before treatment begins to answer important questions pertaining to clonal transformation during IT treatment.
Studies of antigen-specific IT have implicated FOXP3-expressing Treg induction in association with immune tolerance in allergy, diabetes, and multiple sclerosis (7, 46–49), and a subversion of Th2 or Th1 responses in allergy and diabetes, respectively (47, 48, 50). However, we observed a reduction in allergic Th2 cells and a reduction in antigen-specific regulatory cells in the peripheral blood over time during IT. Preferential deletion of antigen-specific Th2 cells has previously been observed following IT (1) and decreased Treg over time in IT has been reported (7, 15). Further repertoire analysis of CD4+ T cells during IT may reveal the preferential deletion or reprogramming of T cells based on factors like functional avidity or structural TCR avidity. Additionally, several IT studies, particularly for allergy, have identified changes in antigen-specific IgE and IgG responses, regulatory B cells, and basophils associated with tolerance induction (13, 17, 39, 46, 51).
In conclusion, our study is the first, to our knowledge, to show complex phenotypic transitions in CD4+ T cells during IT. By analyzing the gene-expression patterns of individual CD4+ lymphocytes, we were able to reconstruct the pathways of these cells as they transitioned to “tolerant” or “nontolerant” states. This approach has yielded previously unidentified insights into the potential mechanisms of tolerance induction during oral IT. Although our study has used oral IT in food allergy as a model treatment, the mechanisms we have uncovered and the methods we have applied could be relevant to other forms of IT and disease states associated with modulation of the immune system, such as cancer, autoimmune diseases, and transplantation. The data presented here provide important insights into the changes in gene expression and T-cell phenotypes that may occur during successful IT.
Materials and Methods
Study Design.
The study was designed to discern the changes in CD4+ T-cell phenotypes that underpin the induction of immune tolerance in oral IT. To this end, we isolated CD4+ T cells from IT participants and healthy controls (individuals who have no known allergies and have not taken drugs that are known to influence peripheral T-cell response) at predefined time points (Table 3), sorted individual T cells, and performed single-cell gene-expression analyses and TCR sequencing and phenotyping on these isolated cells. The protocol for this study was reviewed and approved by the Institutional Review Board (IRB) of Stanford University. Written informed consent was obtained for all participants before entering the study.
Table 3.
Summary of demographics of participants
| Participant type | Number of participants | IT time points, mo | Frequency of CD4+Dex+, median (range) | Age, median (range) | Sex | HLA type |
| Healthy controls | 7 | −3, 0 | 22.5 (3–55) | 38 (32–47) | Males = 1 | 1501 = 4 |
| Females = 6 | DRB4 = 3 | |||||
| Pretreatment participants | 5 | −6, −3, 0 | 27.5 (9–48) | 10 (8–15) | Males = 1 | 1501 = 2 |
| Females = 4 | DRB4 = 3 | |||||
| IT participants | 5 | 3, 6–7, 9–10, 11–18 | 44 (14–78) | 10 (8–15) | Males = 1 | 1501 = 2 |
| Females = 4 | DRB4 = 3 |
Participants and IT.
Participants with matching HLA types, HLA-DRB1*1501 and HLA-DRB4, compatible with peanut-derived Ara h 2 peptide dextramers from a previous recent study (7), were enrolled in this pilot study. Double-blind, placebo-controlled food challenges (DBPCFCs) occurred at screening and clinical reactivity was determined.
Clinical reactivity is defined as any sign of allergic reaction. The oral IT protocol was conducted in a hospital setting with trained staff. Healthy controls were proven to be nonallergic via serum IgE less than 0.35 kU/L and no clinical symptoms consistent with atopy and no positive food challenges. Peanut allergy participants were confirmed using DBPCFCs conducted under an IRB-approved protocol at Stanford University School of Medicine. Participant demographics can be found in Table 3. Further subject information, including eligibility criteria, and further IT details, including food challenge dosing protocol, have been previously published (7).
Cell Preparation and Sorting.
From each subject, 20–40 mL of blood was obtained during the afternoon and placed on a rotator overnight before being processed in the morning the following day. Basophil activation assays were performed as previously described (52). Specific IgE and IgG4 were measured (Stanford Clinical Laboratories). CD4+ T cells were isolated using the Human CD4+ T-cell enrichment kit (StemCell Technologies), according to the manufacturer’s protocol. CD4+ T cells were activated with phorbol myristate acetate (PMA) at 20 ng/mL and Ionomycin at 1 μg/mL at 37 °C for 1.5 h to up-regulate cytokine expression. After washing twice, CD4+ T cells were stained with PE-labeled Ara h 2 dextramers [DRB1*1501 and DRB4; Ara h 2 (120-139, RQQEQQFKRELRNLPQQCGL)] (Immudex) at room temperature for 45 min. Cells were then stained with anti-CD3 V500, anti-CD4 APC-H7, anti-CD8 FITC, anti-CD14 FITC, anti-CD19 FITC (BD Biosciences), anti-CD45RA brilliant violet 421 (BioLegend), anti-CD56 FITC, and anti-CD294 Alexa Fluor 647 (BD Biosciences) for 20 min at 4 °C. Cells were washed and incubated with anti-PE magnetic beads (Miltenyi Biotec), according to the manufacturer’s protocol, and a 1/20 fraction was saved for analysis. The other fraction was passed through a magnetic column (Miltenyi Biotec). The bound, PE-labeled cells were flushed and collected. Cells in the bound fraction and the fraction not passed through the column were stained with 7-AAD (BD Biosciences) for 10 min before flow cytometry. Dextramer-stained T cells were sorted as single cells into individual wells of a 96-well plate. Cells were stored in reverse transcriptase reaction buffer at −80 °C until use. Flow cytometric data were acquired on a BD Fluorescence Activated Cell Sorting (FACS) Aria (BD Biosciences) and the data analyzed using FlowJo (FlowJo).
Fluidigm.
This assay was performed by the Human Immune Monitoring Center at Stanford University. For single sorted cells, RT-PCR was performed directly in a 96-well PCR plate (ABI) containing lysis buffer (Invitrogen) by using SuperScript III One-Step RT-PCR System with PlatinumTaq (CellDirect kit, Invitrogen). PreAmp was performed on a thermocycler using the TaqMan PreAmp Master Mix Kit (Invitrogen) added to cDNA and 0.2× pooled Taqman assays. RT enzyme was inactivated and the Taq polymerase reaction was started by bringing the sample to 95 °C for 2 min. The cDNA was preamplified for 18 cycles by denaturing at 95 °C for 15 s, annealing at 60 °C for 4 min. The resulting cDNA product was diluted 1:2 with 1× TE buffer (Invitrogen). Next, 2× Applied Biosystems Taqman Master Mix, Fluidigm Sample Loading Reagent, and preamplified cDNA were mixed and loaded into the 48.48 Dynamic Array (Fluidigm) sample inlets, followed by loading 10× assays into the assay inlets. Manufacturer’s instructions for chip priming, pipetting, mixing, and loading onto the BioMark system were followed. Real-time PCR was carried out with the following conditions: 10 min at 95 °C, followed by 50 cycles of 15 s at 95 °C and 1 min at 60 °C. Data were analyzed using Fluidigm software. All reactions were performed in duplicate or triplicate, and Ct values were normalized to the 18S positive control.
TCR Sequencing and Phenotyping.
TCR sequencing and phenotypic analyses were performed as previously described (21). Briefly, PCR sequence and gene-expression analysis from single cells were obtained by a series of nested PCRs for multiple Vα, Vβ, Jα, Jβ, Cα, and Cβ regions and multiple genes, including FOXP3, GATA-3, IFN-γ, IL-13, IL-12, IL-21, T-BET, TGF-β1, TNFα, BCL6, RUNX1, and RUNX3. Bar-coding PCRs were used to track PCR products from individual cells that were sequenced using the Illumina MiSeq platform (Illumina Inc.).
Initial Data Transformation.
Initial Fluidigm output consists of marker expression levels ranging from 0 to 40, which represent the number of amplification cycles necessary to obtain a threshold level of the marker. A score closer to 0 indicates a greater expression level, and a score closer to 40 indicates a lesser expression level. Any markers not expressed at a high enough level to be detected after 40 cycles receive a score of N/A (nonapplicable). We transformed them by subtracting each score from 40, so that higher transformed scores correspond to higher expression level. All N/A values were set to 0.
Normalization.
To control for interplate variance, we normalized using the expression of 18S, a housekeeping gene, to establish a baseline level of activity for each plate and adjust accordingly. We found the median 18S expression of all of the cells on each plate and then found the median of these 35 medians. An “activity level” for each plate was calculated by dividing the median 18S expression of that plate by the median-of-medians. Then, each marker expression level for each cell on the plate was divided by this activity level.
Cluster Analysis.
We started by using the gap statistic to compare within- to between-cluster sums of squares for various numbers of clusters (25). After plotting these and looking for an elbow, we divided the cells into seven clusters. Before clustering, the data for each marker were centered by the overall median and scaled by the range. Cells were then clustered using k means. To ensure that all presenting phenotypes were represented and contributed to cluster designation, all cells (both dextramer+ and dextramer−) were included for cluster analysis at all time points. All statistical analysis and graphs were performed using R. K-means clustering (53) was performed using the R package “kmeans” (https://stat.ethz.ch/R-manual/R-devel/library/stats/html/kmeans.html). Heat map visualization was performed using the R package “heatmap 2” (www.inside-r.org/packages/cran/gplots/docs/heatmap.2). The agglomerative clustering method used for dendrogram construction was complete-linkage clustering, using a Euclidean metric. The clustering method passed to the clusGap function was kmeans, with k ranging from 1 to 7.
PCA was performed using the single-cell gene-expression data to visualize the relationship among the individual cells. PCA is an unsupervised method that generates a new set of unrelated variables (PCs) that represent the most variation in the data set (54). PCA was run using the “prcomp” function in R (stat.ethz.ch/R-manual/R-patched/library/stats/html/prcomp.html) to attribute the variance in the data to a reduced set of variables (PCs). For 3D-PCA, we projected the high-dimensional immunophenotype data onto the first three PCs and mapped each element into a 3D viewer using the R “pca3d” package (cran.r-project.org/web/packages/pca3d/index.html). For 2D-PCA we used the R package “ggplot2” (cran.r-project.org/web/packages/ggplot2/index.html) and mapped each element.
Variance/cluster composition bar graphs were plotted using the R package “ggplot2.” The fractional cluster composition at each stage of IT was calculated as the number of cells in that stage of IT that were statistically determined to sort into each cluster (k-means) divided by the total number of cells, yielding a fraction between 0 and 1.
Phenotypic Shift Distance.
Within each participant, we calculated the degree of phenotypic shift of all observed CD4+ dextramer+ peanut-specific T cells between progressive time points. Phenotypic shift is reported as the root-mean-square deviation (RMSD) (55) of all phenotypic markers between each cell at an IT time point to each cell observed at the following time point. All phenotypic shift distance calculations were performed in Perl (Version 3.20.1) (https://www.perl.org).
Statistics.
To determine which markers were informative in determining the effect of IT on individual T cells, we used t tests to compare: cells from healthy controls against cells from pretreatment participants, cells from healthy controls against cells from IT participants (all IT time points), cells from pretreatment participants against cells from IT participants (all IT time points), and dextramer+ cells vs. dextramer− cells. t tests were performed using R. Comparison of phenotypic shift distances by one-way analysis of variance (ANOVA) was performed with Prism software (GraphPad). Comparison of proportion of dextramer+ and proportion of dextramer− cells belonging to each cluster was done using χ2 tests in Excel. Comparison of number of dextramer+ cells at each IT time point was performed in Excel using t tests. Bonferroni-corrected P-value cutoffs were computed by setting a significance level of α = 0.05 and dividing by the number of tests performed.
Acknowledgments
We thank Dr. William Kwok (Benaroya Research Institute) for providing the Ara h 2 tetramers, Stephan Haley and Tina Jakobsen (Immudex Corporation) for Ara h 2 dextramer construction, and Dr. Steve Quake, Dr. Wendy Davidson, Dr. Audrey Lau, and Dr. Marshall Plaut for manuscript review. We thank the Sean N. Parker Center for Allergy Research at Stanford University and the Myra Reinhard Foundation for their support. This work was funded by National Institutes of Health and National Institute of Allergy and Infectious Disease Grant U19AI104209.
Footnotes
The authors declare no conflict of interest.
This article contains supporting information online at www.pnas.org/lookup/suppl/doi:10.1073/pnas.1520180113/-/DCSupplemental.
References
- 1.Larché M, Akdis CA, Valenta R. Immunological mechanisms of allergen-specific immunotherapy. Nat Rev Immunol. 2006;6(10):761–771. doi: 10.1038/nri1934. [DOI] [PubMed] [Google Scholar]
- 2.Wambre E, et al. Differentiation stage determines pathologic and protective allergen-specific CD4+ T-cell outcomes during specific immunotherapy. J Allergy Clin Immunol. 2012;129(2):544–551, 551.e1–551.e7. doi: 10.1016/j.jaci.2011.08.034. [DOI] [PMC free article] [PubMed] [Google Scholar]
- 3.Akdis M, Akdis CA. Therapeutic manipulation of immune tolerance in allergic disease. Nat Rev Drug Discov. 2009;8(8):645–660. doi: 10.1038/nrd2653. [DOI] [PubMed] [Google Scholar]
- 4.Bedoret D, et al. Changes in antigen-specific T-cell number and function during oral desensitization in cow’s milk allergy enabled with omalizumab. Mucosal Immunol. 2012;5(3):267–276. doi: 10.1038/mi.2012.5. [DOI] [PMC free article] [PubMed] [Google Scholar]
- 5.Burks AW, et al. NIAID-sponsored 2010 guidelines for managing food allergy: Applications in the pediatric population. Pediatrics. 2011;128(5):955–965. doi: 10.1542/peds.2011-0539. [DOI] [PMC free article] [PubMed] [Google Scholar]
- 6.Turcanu V, Maleki SJ, Lack G. Characterization of lymphocyte responses to peanuts in normal children, peanut-allergic children, and allergic children who acquired tolerance to peanuts. J Clin Invest. 2003;111(7):1065–1072. doi: 10.1172/JCI16142. [DOI] [PMC free article] [PubMed] [Google Scholar]
- 7.Syed A, et al. Peanut oral immunotherapy results in increased antigen-induced regulatory T-cell function and hypomethylation of forkhead box protein 3 (FOXP3) J Allergy Clin Immunol. 2014;133(2):500–510. doi: 10.1016/j.jaci.2013.12.1037. [DOI] [PMC free article] [PubMed] [Google Scholar]
- 8.Herold KC, Bluestone JA. Type 1 diabetes immunotherapy: Is the glass half empty or half full? Sci Transl Med. 2011;3(95):95fs1. doi: 10.1126/scitranslmed.3002981. [DOI] [PubMed] [Google Scholar]
- 9.Francis JN, Till SJ, Durham SR. Induction of IL-10+CD4+CD25+ T cells by grass pollen immunotherapy. J Allergy Clin Immunol. 2003;111(6):1255–1261. doi: 10.1067/mai.2003.1570. [DOI] [PubMed] [Google Scholar]
- 10.Vickery BP, et al. Sustained unresponsiveness to peanut in subjects who have completed peanut oral immunotherapy. J Allergy Clin Immunol. 2014;133(2):468–475. doi: 10.1016/j.jaci.2013.11.007. [DOI] [PMC free article] [PubMed] [Google Scholar]
- 11.Tang ML, et al. Administration of a probiotic with peanut oral immunotherapy: A randomized trial. J Allergy Clin Immunol. 2015;135(3):737–44.e8. doi: 10.1016/j.jaci.2014.11.034. [DOI] [PubMed] [Google Scholar]
- 12.Sewell WAC, Dore PC. Premature testing of allergen-specific IgE post-anaphylaxis may cause false negative results. J Allergy Clin Immunol. 2004;113(2):S241. [Google Scholar]
- 13.Jones SM, et al. Clinical efficacy and immune regulation with peanut oral immunotherapy. J Allergy Clin Immunol. 2009;124(2):292–300, 300.e1–300.e97. doi: 10.1016/j.jaci.2009.05.022. [DOI] [PMC free article] [PubMed] [Google Scholar]
- 14.Brinkmann V, Heusser CH. T cell-dependent differentiation of human B cells into IgM, IgG, IgA, or IgE plasma cells: High rate of antibody production by IgE plasma cells, but limited clonal expansion of IgE precursors. Cell Immunol. 1993;152(2):323–332. doi: 10.1006/cimm.1993.1294. [DOI] [PubMed] [Google Scholar]
- 15.Stapel SO, et al. EAACI Task Force Testing for IgG4 against foods is not recommended as a diagnostic tool: EAACI Task Force Report. Allergy. 2008;63(7):793–796. doi: 10.1111/j.1398-9995.2008.01705.x. [DOI] [PubMed] [Google Scholar]
- 16.Vasquez-Ortiz M, et al. 2014. Ovalbumin-specific IgE/IgG4 ratio might improve the prediction of cooked and uncooked egg tolerance development in egg-allergic children. Clin Exp Allergy 44:579–588.
- 17.van Neerven RJ, et al. Blocking antibodies induced by specific allergy vaccination prevent the activation of CD4+ T cells by inhibiting serum-IgE-facilitated allergen presentation. J Immunol. 1999;163(5):2944–2952. [PubMed] [Google Scholar]
- 18.Wambre E, James EA, Kwok WW. Characterization of CD4+ T cell subsets in allergy. Curr Opin Immunol. 2012;24(6):700–706. doi: 10.1016/j.coi.2012.07.009. [DOI] [PMC free article] [PubMed] [Google Scholar]
- 19.Standifer NE, Burwell EA, Gersuk VH, Greenbaum CJ, Nepom GT. Changes in autoreactive T cell avidity during type 1 diabetes development. Clin Immunol. 2009;132(3):312–320. doi: 10.1016/j.clim.2009.04.013. [DOI] [PMC free article] [PubMed] [Google Scholar]
- 20.Burton BR, et al. Sequential transcriptional changes dictate safe and effective antigen-specific immunotherapy. Nat Commun. 2014;5:4741. doi: 10.1038/ncomms5741. [DOI] [PMC free article] [PubMed] [Google Scholar]
- 21.Han A, Glanville J, Hansmann L, Davis MM. Linking T-cell receptor sequence to functional phenotype at the single-cell level. Nat Biotechnol. 2014;32(7):684–692. doi: 10.1038/nbt.2938. [DOI] [PMC free article] [PubMed] [Google Scholar]
- 22.Hong JW, Quake SR. Integrated nanoliter systems. Nat Biotechnol. 2003;21(10):1179–1183. doi: 10.1038/nbt871. [DOI] [PubMed] [Google Scholar]
- 23.Burks AW, et al. Identification and characterization of a second major peanut allergen, Ara h II, with use of the sera of patients with atopic dermatitis and positive peanut challenge. J Allergy Clin Immunol. 1992;90(6 Pt 1):962–969. doi: 10.1016/0091-6749(92)90469-i. [DOI] [PubMed] [Google Scholar]
- 24.Maecker HT, et al. New tools for classification and monitoring of autoimmune diseases. Nat Rev Rheumatol. 2012;8(6):317–328. doi: 10.1038/nrrheum.2012.66. [DOI] [PMC free article] [PubMed] [Google Scholar]
- 25.Tibshirani R, Walther G, Hastie T. Estimating the number of clusters in a data set via the gap statistic. J R Stat Soc Series B Stat Methodol. 2001;63(2):411–423. [Google Scholar]
- 26.DeLong JH, et al. Ara h 1-reactive T cells in individuals with peanut allergy. J Allergy Clin Immunol. 2011;127(5):1211–8.e3. doi: 10.1016/j.jaci.2011.02.028. [DOI] [PMC free article] [PubMed] [Google Scholar]
- 27.Pellerin L, Jenks JA, Bégin P, Bacchetta R, Nadeau KC. Regulatory T cells and their roles in immune dysregulation and allergy. Immunol Res. 2014;58(2-3):358–368. doi: 10.1007/s12026-014-8512-5. [DOI] [PMC free article] [PubMed] [Google Scholar]
- 28.Lechner O, et al. Fingerprints of anergic T cells. Curr Biol. 2001;11(8):587–595. doi: 10.1016/s0960-9822(01)00160-9. [DOI] [PubMed] [Google Scholar]
- 29.Aslam A, Chan H, Warrell DA, Misbah S, Ogg GS. Tracking antigen-specific T-cells during clinical tolerance induction in humans. PLoS One. 2010;5(6):e11028. doi: 10.1371/journal.pone.0011028. [DOI] [PMC free article] [PubMed] [Google Scholar]
- 30.Szabo SJ, Sullivan BM, Peng SL, Glimcher LH. Molecular mechanisms regulating Th1 immune responses. Annu Rev Immunol. 2003;21:713–758. doi: 10.1146/annurev.immunol.21.120601.140942. [DOI] [PubMed] [Google Scholar]
- 31.Steinke JW, Lawrence MG. T-cell biology in immunotherapy. Ann Allergy Asthma Immunol. 2014;112(3):195–199. doi: 10.1016/j.anai.2013.12.020. [DOI] [PMC free article] [PubMed] [Google Scholar]
- 32.Tran DQ. TGF-β: The sword, the wand, and the shield of FOXP3(+) regulatory T cells. J Mol Cell Biol. 2012;4(1):29–37. doi: 10.1093/jmcb/mjr033. [DOI] [PubMed] [Google Scholar]
- 33.Gorelik L, Fields PE, Flavell RA. Cutting edge: TGF-β inhibits Th type 2 development through inhibition of GATA-3 expression. J Immunol. 2000;165(9):4773–4777. doi: 10.4049/jimmunol.165.9.4773. [DOI] [PubMed] [Google Scholar]
- 34.Komine O, et al. The Runx1 transcription factor inhibits the differentiation of naive CD4+ T cells into the Th2 lineage by repressing GATA3 expression. J Exp Med. 2003;198(1):51–61. doi: 10.1084/jem.20021200. [DOI] [PMC free article] [PubMed] [Google Scholar]
- 35.Shalek AK, et al. Single-cell RNA-seq reveals dynamic paracrine control of cellular variation. Nature. 2014;510(7505):363–369. doi: 10.1038/nature13437. [DOI] [PMC free article] [PubMed] [Google Scholar]
- 36.Schleifman EB, et al. Targeted biomarker profiling of matched primary and metastatic estrogen receptor positive breast cancers. PLoS One. 2014;9(2):e88401. doi: 10.1371/journal.pone.0088401. [DOI] [PMC free article] [PubMed] [Google Scholar]
- 37.Pollen AA, et al. Low-coverage single-cell mRNA sequencing reveals cellular heterogeneity and activated signaling pathways in developing cerebral cortex. Nat Biotechnol. 2014;32(10):1053–1058. doi: 10.1038/nbt.2967. [DOI] [PMC free article] [PubMed] [Google Scholar]
- 38.Anderson RP, Degano P, Godkin AJ, Jewell DP, Hill AV. In vivo antigen challenge in celiac disease identifies a single transglutaminase-modified peptide as the dominant A-gliadin T-cell epitope. Nat Med. 2000;6(3):337–342. doi: 10.1038/73200. [DOI] [PubMed] [Google Scholar]
- 39.Akdis M, Akdis CA. Mechanisms of allergen-specific immunotherapy: Multiple suppressor factors at work in immune tolerance to allergens. J Allergy Clin Immunol. 2014;133(3):621–631. doi: 10.1016/j.jaci.2013.12.1088. [DOI] [PubMed] [Google Scholar]
- 40.Fathman CG, Lineberry NB. Molecular mechanisms of CD4+ T-cell anergy. Nat Rev Immunol. 2007;7(8):599–609. doi: 10.1038/nri2131. [DOI] [PubMed] [Google Scholar]
- 41.Rudd CE, Taylor A, Schneider H. CD28 and CTLA-4 coreceptor expression and signal transduction. Immunol Rev. 2009;229(1):12–26. doi: 10.1111/j.1600-065X.2009.00770.x. [DOI] [PMC free article] [PubMed] [Google Scholar]
- 42.Nishikawa H, Sakaguchi S. Regulatory T cells in cancer immunotherapy. Curr Opin Immunol. 2014;27:1–7. doi: 10.1016/j.coi.2013.12.005. [DOI] [PubMed] [Google Scholar]
- 43.Walker LS. Treg and CTLA-4: Two intertwining pathways to immune tolerance. J Autoimmun. 2013;45:49–57. doi: 10.1016/j.jaut.2013.06.006. [DOI] [PMC free article] [PubMed] [Google Scholar]
- 44.Dalai SK, Mirshahidi S, Morrot A, Zavala F, Sadegh-Nasseri S. Anergy in memory CD4+ T cells is induced by B cells. J Immunol. 2008;181(5):3221–3231. doi: 10.4049/jimmunol.181.5.3221. [DOI] [PMC free article] [PubMed] [Google Scholar]
- 45.David A, et al. Tolerance induction in memory CD4 T cells requires two rounds of antigen-specific activation. Proc Natl Acad Sci USA. 2014;111(21):7735–7740. doi: 10.1073/pnas.1406218111. [DOI] [PMC free article] [PubMed] [Google Scholar]
- 46.Scadding GW, et al. Sublingual grass pollen immunotherapy is associated with increases in sublingual Foxp3-expressing cells and elevated allergen-specific immunoglobulin G4, immunoglobulin A and serum inhibitory activity for immunoglobulin E-facilitated allergen binding to B cells. Clin Exp Allergy. 2010;40(4):598–606. doi: 10.1111/j.1365-2222.2010.03462.x. [DOI] [PubMed] [Google Scholar]
- 47.Hjorth M, et al. GAD-alum treatment induces GAD65-specific CD4+CD25highFOXP3+ cells in type 1 diabetic patients. Clin Immunol. 2011;138(1):117–126. doi: 10.1016/j.clim.2010.10.004. [DOI] [PubMed] [Google Scholar]
- 48.Suárez-Fueyo A, et al. Grass tablet sublingual immunotherapy downregulates the TH2 cytokine response followed by regulatory T-cell generation. J Allergy Clin Immunol. 2014;133(1):130–8.e1, 2. doi: 10.1016/j.jaci.2013.09.043. [DOI] [PubMed] [Google Scholar]
- 49.Loo EW, Krantz MJ, Agrawal B. High dose antigen treatment with a peptide epitope of myelin basic protein modulates T cells in multiple sclerosis patients. Cell Immunol. 2012;280(1):10–15. doi: 10.1016/j.cellimm.2012.11.004. [DOI] [PubMed] [Google Scholar]
- 50.Savilahti EM, Savilahti E. Development of natural tolerance and induced desensitization in cow’s milk allergy. Pediatr Allergy Immunol. 2013;24(2):114–121. doi: 10.1111/pai.12004. [DOI] [PubMed] [Google Scholar]
- 51.Santos AF, et al. Basophil activation test discriminates between allergy and tolerance in peanut-sensitized children. J Allergy Clin Immunol. 2014;134(3):645–652. doi: 10.1016/j.jaci.2014.04.039. [DOI] [PMC free article] [PubMed] [Google Scholar]
- 52.Gernez Y, et al. Basophil CD203c levels are increased at baseline and can be used to monitor omalizumab treatment in subjects with nut allergy. Int Arch Allergy Immunol. 2011;154(4):318–327. doi: 10.1159/000321824. [DOI] [PMC free article] [PubMed] [Google Scholar]
- 53.Do JH, Choi DK. Clustering approaches to identifying gene expression patterns from DNA microarray data. Mol Cells. 2008;25(2):279–288. [PubMed] [Google Scholar]
- 54.Ringnér M. What is principal component analysis? Nat Biotechnol. 2008;26(3):303–304. doi: 10.1038/nbt0308-303. [DOI] [PubMed] [Google Scholar]
- 55.Coutsias EA, Seok C, Dill KA. Using quaternions to calculate RMSD. J Comput Chem. 2004;25(15):1849–1857. doi: 10.1002/jcc.20110. [DOI] [PubMed] [Google Scholar]