Significance
Actins and tubulins have dedicated functions that vary between eukaryotes and prokaryotes. During cell division, the prokaryotic contractile ring depends on the tubulin-like protein FtsZ, whereas this task relies on actin in eukaryotes. In contrast, microtubules orchestrate DNA segregation in eukaryotes, yet prokaryotic plasmid segregation often depends on actin-like proteins; this implies that actins and tubulins have somewhat interchangeable properties. Hence, we sought a bacterial filament that more closely resembles microtubules. Here, we report an actin from Bacillus thuringiensis that forms dynamic, antiparallel, two-stranded supercoiled filaments, which pair in the presence of a binding partner to form hollow cylinders. Thus, in this prokaryote, the actin fold has evolved to produce a filament system with comparable properties to the eukaryotic microtubule.
Keywords: actin, ParM, plasmid, filament, microtubule
Abstract
Here we report the discovery of a bacterial DNA-segregating actin-like protein (BtParM) from Bacillus thuringiensis, which forms novel antiparallel, two-stranded, supercoiled, nonpolar helical filaments, as determined by electron microscopy. The BtParM filament features of supercoiling and forming antiparallel double-strands are unique within the actin fold superfamily, and entirely different to the straight, double-stranded, polar helical filaments of all other known ParMs and of eukaryotic F-actin. The BtParM polymers show dynamic assembly and subsequent disassembly in the presence of ATP. BtParR, the DNA-BtParM linking protein, stimulated ATP hydrolysis/phosphate release by BtParM and paired two supercoiled BtParM filaments to form a cylinder, comprised of four strands with inner and outer diameters of 57 Å and 145 Å, respectively. Thus, in this prokaryote, the actin fold has evolved to produce a filament system with comparable features to the eukaryotic chromosome-segregating microtubule.
During bacterial cell division, equal distribution of replicated plasmids to the two daughter cells ensures their stable inheritance. Type II plasmid segregation systems consist of an actin-like protein (ParM) capable of nucleotide-dependent filament formation and a centrosome-like DNA region (parC), which are linked by an adaptor protein ParR. The model ParCMR system is that of the Escherichia coli R1 plasmid (1). ParM-R1 forms actin-like double-helical straight polar filaments (2), which are paired into randomly oriented bundles. The antiparallel pairing of at least two filaments is required to push apart two R1-ParR/parC complexes (3). All other ParMs, which have been experimentally verified to segregate DNA, including AlfA from Bacillus subtilis (4) and ParM-pSK41 from Staphylococcus aureus (5), have also been shown by electron microscopy to form polar, double-stranded straight filaments with diameters between 80 and 90 Å, similar to eukaryotic F-actin (6).
Actins and microtubules have gained dedicated functions during evolution that vary between eukaryotes and prokaryotes. During cell division, the contractile ring in prokaryotes depends on the microtubule-like protein FtsZ, whereas this task relies on actin in eukaryotes. In contrast, DNA segregation in eukaryotes is orchestrated by microtubules, whereas in prokaryotes plasmid DNA segregation depends largely on the actin-like proteins ParMs, although Walker-type ATPase ParA (type I) systems (7) and microtubule-like TubZ (type III) systems have also been found (8). Therefore, a long-standing question has been whether a functional equivalent of the microtubule-like DNA segregating architecture, a hollow cylinder, can be found in bacteria.
Using X-ray crystallography, electron microscopy and biochemical assays, we have identified and characterized a novel DNA partitioning ParCMR system from Bacillus thuringiensis (Bt) encoded on the plasmid pBMB67 (9). The filament-forming motor protein, BtParM, proved to be entirely different from all previously studied ParMs; in contrast to the ParM-R1 model system, it formed dynamic double-stranded antiparallel supercoiled filaments with an outer diameter of 145 Å in the presence of ATP, which paired into four-stranded nanotubules in the presence of the adaptor protein BtParR or with the BtParR/parC complex. This finding demonstrates that some of the properties of the eukaryotic microtubule system in segregating DNA have also been probed during prokaryote evolution using the actin fold.
Results
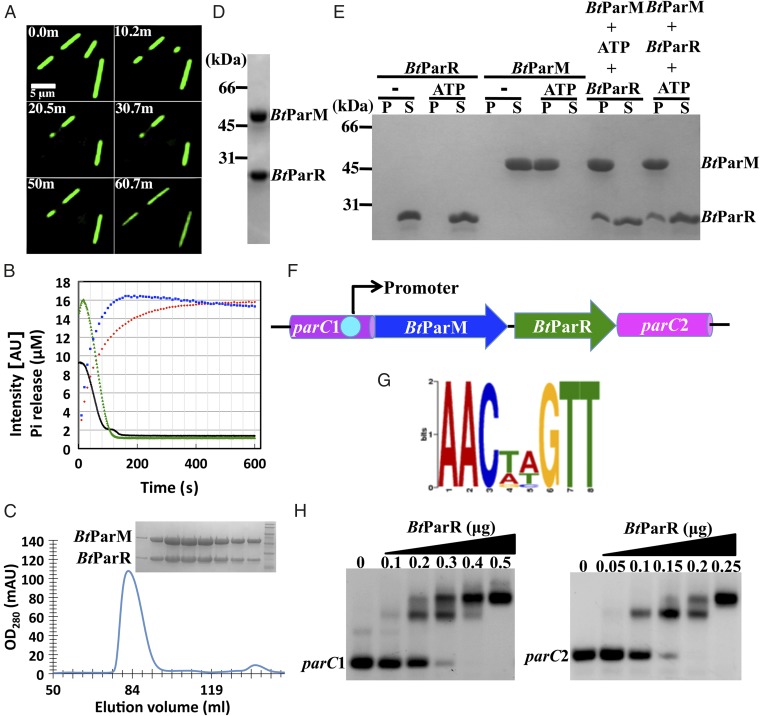
To demonstrate that BtParM filaments assemble in an in vivo setting, GFP-BtParM was expressed and imaged in Schizosaccharomyces pombe. Long bundles of filaments were observed, which appeared to be relatively stable at the resolution of the fluorescence microscope. Depletion of ATP, by artificial suppression of the ATP regenerating system by placing the cells into PBS (10), caused the filaments to depolymerize. After the levels of ATP were allowed to recover, the filaments repolymerized. (Fig. 1A; Movie S1). The elongation and depolymerization phases were observed to occur at both ends of the GFP-BtParM filament bundles.
Fig. 1.
(A) GFP-labeled BtParM expressed in S. pombe visualized over time. Filament bundles shortened over time on depletion of ATP, and repolymerized on restoration of ATP levels. Buffer: 40 mM Hepes, pH 7.5, 300 mM KCl, 3 mM MgCl2. (B) Polymerization kinetics of BtParM (15 µM, green) and BtParM/ParR complex (15 µM each, black) induced by ATP (3 mM) observed by light scattering. Pi release by BtParM is shown in red and that from BtParM/ParR polymerization in blue. (C) BtParM/ParR complex mobility on gel filtration. (Inset) SDS gel of the BtParM/ParR peak. (D) SDS gel of the BtParM/His–ParR complex purified by nickel ion affinity chromatography. (E) Cosedimentation assay of BtParM and BtParR. P and S indicate the pellet and soluble fractions, respectively. (F) Cartoon of the ParCMR region of the pBMB67 plasmid. parC is separated in this system, upstream parC1 and downstream parC2. (G) The palindromic repeats (Table S1). (H) In vitro EMSA gel shift analysis of the interaction of BtParR with parC1 (200 ng) and parC2 (200 ng).
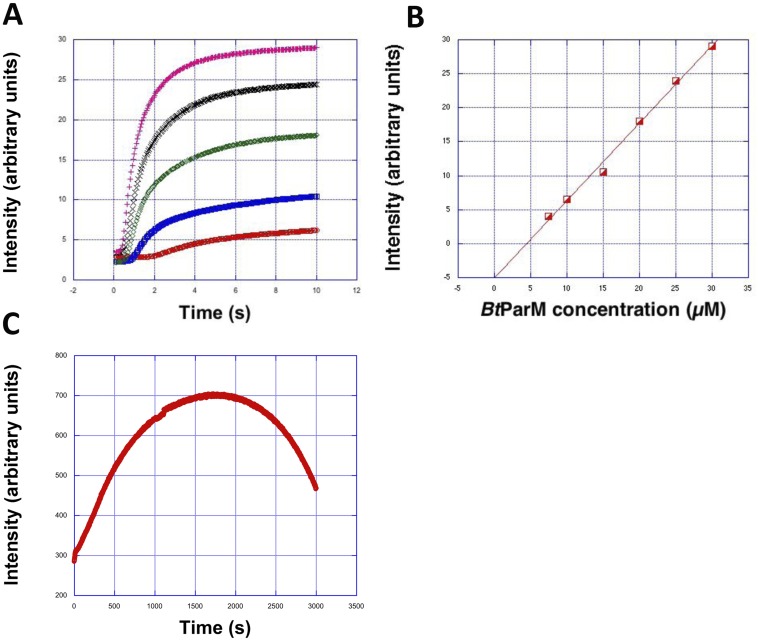
We further investigated the polymerization dynamics of BtParM in vitro by monitoring light scattering from filaments, a technique that reflects average particle size in solution. Bacterial cells are known to contain ∼300 mM KCl (11), 2–3 mM MgCl2 (12), and 1.5–3 mM ATP (13). Under such physiological buffer conditions, in vitro BtParM polymerization occurred above a critical concentration of 5 µM (Fig. 1B and Fig. S1 A and B). This value is 2× higher than found for ParM-R1 (14). ParM-R1 concentrations have been shown to be 12–14 µM in the bacterial cell (15), well above the critical concentration.
Fig. S1.
(A) Polymerization curves after adding 2 mM ATP at different BtParM concentrations: red, 10 µM; blue, 15 µM; green, 20 µM; black, 25 µM; magenta, 30 µM. The buffer was chosen to be close to physiological conditions (40 mM Hepes, pH 7.5, 300 mM KCl, 3 mM MgCl2). (B) Maximum light-scattering intensities (from A averaged over three individual experiments each) plotted as a function of BtParM concentration. The intersection with the x-axis reveals the critical concentration to be ∼5 µM. (C) At nonphysiologically high ATP concentrations (10 mM), filaments formed from BtParM/ParR (15 µM each) showed slowed depolymerization sufficiently to allow for the sedimentation assay.
Filament formation by BtParM induced ATP hydrolysis; however, phosphate release was slower than filament assembly (Fig. 1B). The number of hydrolyzed ATP molecules within the polymerization–depolymerization cycle roughly equaled the number of BtParM monomers in solution, which confirms that in the BtParM system, as with other actins, ATP binding, ATP hydrolysis, and phosphate release act as a timing mechanism in orchestrating the polymerization/depolymerization cycle (16).
Filaments also formed from BtParM in the presence of BtParR at physiological ATP concentrations, both polymerization and depolymerization phases being slightly faster than for BtParM alone (Fig. 1B). In the presence of BtParR, phosphate release was faster, indicating that BtParR stimulated ATP hydrolysis and/or phosphate release, concomitant with the faster assembly–disassembly rates (Fig. 1B). Again, the number of hydrolyzed ATP molecules, within a polymerization–depolymerization cycle, roughly equaled the number of BtParM monomers when polymerized from the BtParM/ParR complex (Fig. 1B).
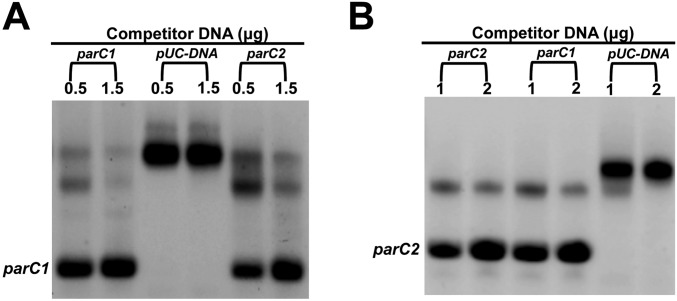
Quantitative gel filtration indicated that, in the absence of nucleotide, BtParR, binds strongly to the BtParM monomer in a 1:1 ratio (Fig. 1C). BtParM coexpressed with His-tagged BtParR was also found in a Ni2+-resin pull-down assay to elute as a complex (Fig. 1D). A pelleting assay indicated that BtParM filaments formed in the presence of BtParR had lower amounts of bound BtParR (Fig. 1E), suggesting that BtParR was released during polymerization. This sedimentation assay was performed in higher than physiological ATP concentrations (10 mM), which slowed depolymerization significantly (Fig. S1C), allowing for filament sedimentation in a centrifuge. The BtParCMR system contains two parC regions (parC1 and parC2) in the operon (Fig. 1F) with almost identical palindromic repeats (Fig. 1G). Electrophoretic mobility shift assays (EMSAs) for BtParR and parC confirmed their in vitro interaction (Fig. 1H; Fig. S2).
Fig. S2.
The binding of ParR to labeled (A) parC1 (200 ng) and (B) parC2 (200 ng) was effectively competed by either unlabeled parC1 or parC2, but not by pUC DNA.
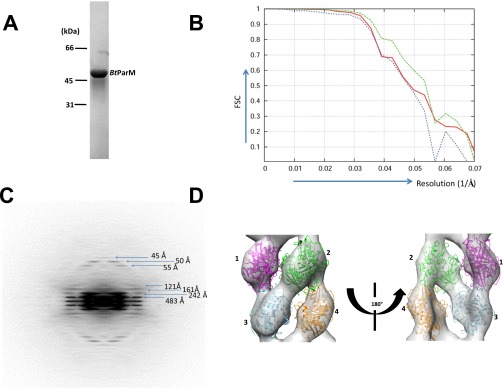
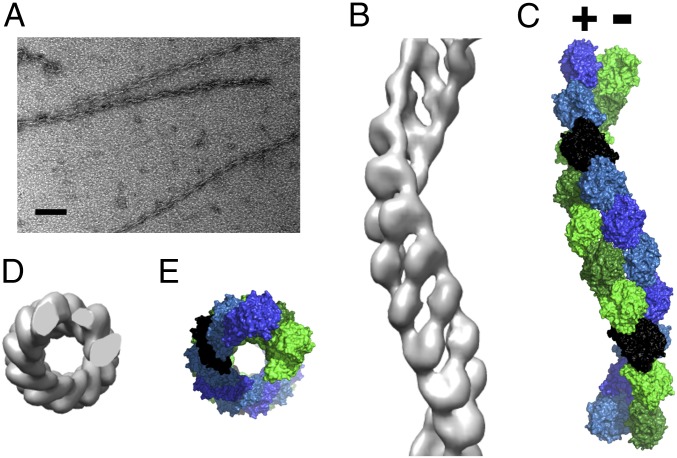
Under the electron microscope, ATP-induced polymerization of the 47.5-kDa BtParM (Fig. S3A) taken at the top of the polymerization curve (Fig. 1B) showed single filaments (Fig. 2A). However, the appearance of the filaments differed from ParM-R1 or F-actin polymers, in that they appeared twisted. The BtParM filaments were reconstructed following procedures successfully applied in F-actin and ParM-R1 reconstructions (14, 17). In brief, an initial 3D structure was produced by helical reconstruction (18) using eight layer lines (∼54-Å resolution; Fig. S3C) in the EOS software package (19). This reconstructed map was used as the initial structure for the refinement steps. The filaments were treated as polar objects throughout the refinement; however, the final electron density map (Fig. S3D) revealed the BtParM filament to be comprised of two antiparallel strands (Fig. 2 B and C), in contrast to the polar double-stranded filaments observed for F-actin and ParM-R1 (2, 6). The BtParM monomer structure obtained by crystallography (see below) was unambiguously fitted into the 18.6-Å resolution electron density map using rigid body refinement, which clearly revealed the unique antiparallel and supercoiled geometry of this filament (Fig. S3 B and D). The outer diameter of the BtParM filament (∼145 Å; Fig. 2 D and E) is substantially larger than the diameters of the non-supercoiled filaments of F-actin and ParM-R1, which are typically 80–90 Å (6, 14).
Fig. S3.
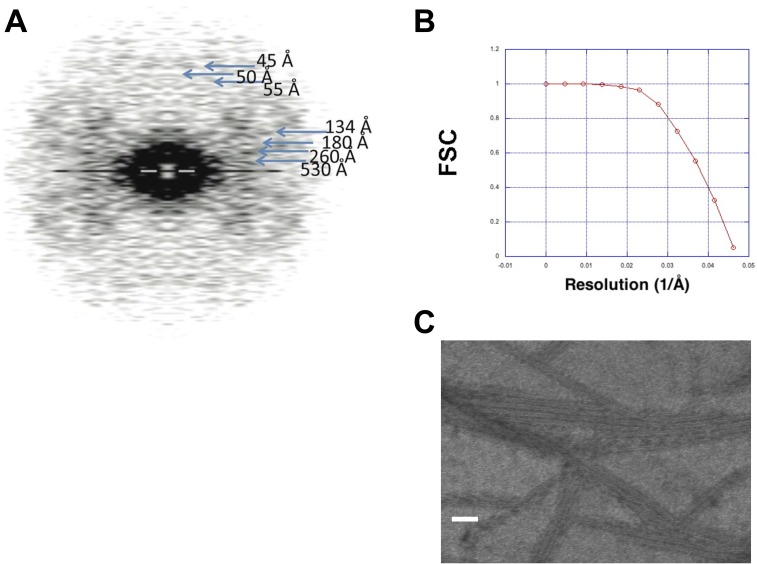
Structure determination of the BtParM filament. (A) SDS gel of purified BtParM. (B) The Fourier shell correlation (FSC) as a function of resolution (1/Å). Initially refined electron density map with filaments having polarity (red line). The resolution was 20.6 Å at FSC 0.5. However, the resulting electron density map appeared nonpolar; to prove this, the structure was flipped upside down, and the corresponding FSC is shown (blue line). The two structures were consistent with each other up to 20.8 Å at FSC 0.5, which was similar to the resolution of the EM reconstruction. Averaging the two maps improved the resolution to 18.6 Å, proving BtParM to be a nonpolar filament. (C) The averaged Fourier pattern of BtParM filaments from 15 filaments showed clear helical symmetry with 54-Å axial rise and ±33.5° azimuth rotation per one asymmetric unit. (D) Rigid-body fitting of four BtParM monomers into the electron density map.
Fig. 2.
(A) Typical electron micrograph of BtParM filaments that was used for image analysis. Note the twisted appearance. (Scale bar: 100 nm.) (B) A 3D electron density map of BtParM at 18.6 Å resolution (side view). (C) After rigid-body fitting of the monomer in its closed form into the electron density map, the antiparallel, supercoiled nature of the BtParM filament became more apparent (side view). Monomers highlighted in black illustrate the antiparallel nature of this filament. (D and E) Top views of electron density map and fitted model, respectively.
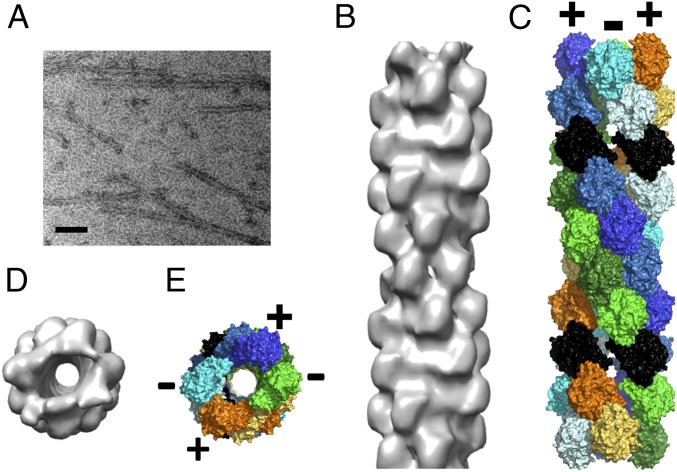
In the presence of BtParR, the filament structure, again taken at the top of the polymerization curve (Fig. 1B), had an entirely different appearance and somewhat resembled the projection image of a microtubule (Fig. 3A). A 3D helical reconstruction at 23-Å resolution (Fig. S4) revealed that the BtParM filament formed from BtParM/ParR is a four-stranded cylinder, which we refer to as a nanotubule (Fig. 3 B and D). The structure of the nanotubule involves the pairing of two antiparallel BtParM two-stranded filaments, such that each strand is antiparallel to its immediate neighbors (Fig. 3 C and E; Movie S2). No density was observed that could be attributed to ParR, suggesting that ParR is not associated at high stoichiometric ratios with the ParM nanotubules, consistent with the sedimentation studies (Fig. 1E).
Fig. 3.
(A) Typical electron micrograph showing BtParM filaments paired into doublets in the presence of BtParR. (Scale bar: 100 nm.) (B) EM reconstruction of the BtParM/ParR complex, 23 Å resolution (side view). (C) Model of the BtParM nanotubule after rigid-body fitting (side view). Protomers highlighted in black show the pairing of two BtParM filaments into a nanotubule. (D and E) Top views of the electron density map and the fitted model, respectively.
Fig. S4.
Structure determination of the BtParM nanotubule. (A) Averaged Fourier transform of 29 BtParM nanotubules formed from BtParM/ParR. (B) FSC of BtParM nanotubules indicated a resolution of ∼23 Å at FSC 0.5. (C) Nanotubules formed from BtParM/ParR/parC1 had the same appearance as nanotubules formed from BtParM/ParR but often formed rafts containing several nanotubules. (Scale bar: 100 nm.)
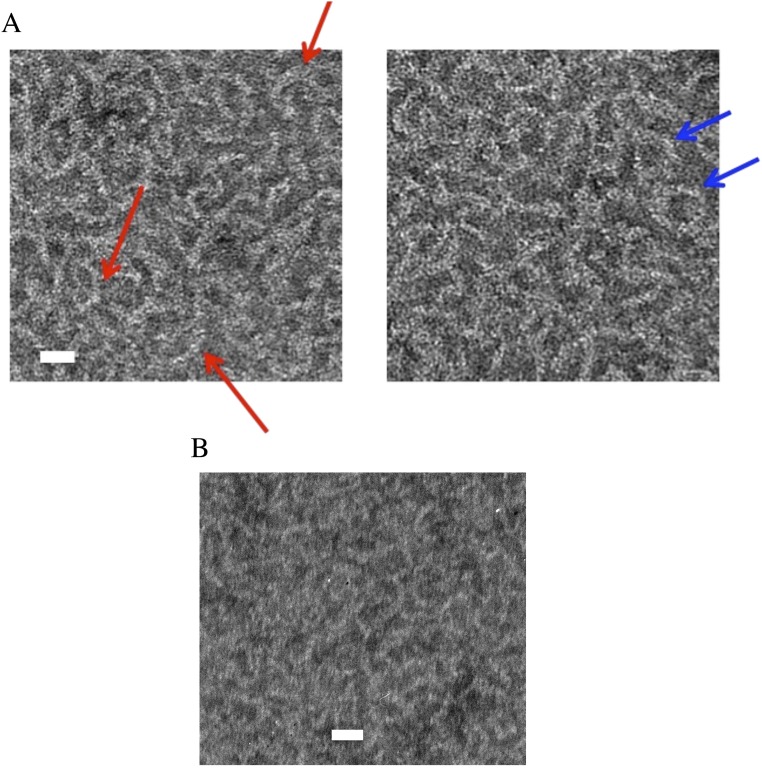
The filament pairing mechanism seems to accelerate polymerization and ATP hydrolysis/phosphate release (Fig. 1B). Nanotubules assembled directly from the BtParM/ParR 1:1 complex by the addition of ATP showed an abundance of unbound BtParR (Fig. 3A), highlighted in Fig. S5. The BtParR appeared to form short oligomers of ∼300 Å in length, which were often curved and forming half or full rings (Fig. S5). The observed average length is compatible with 10 dimers of BtParR, as proposed previously for ParCMR systems (20). In the presence of the BtParR/parC complex, BtParM filaments were also paired into cylinders, which additionally were often arranged in larger suprastructures consisting of rafts of ∼2–10 nanotubules (Fig. S4C).
Fig. S5.
(A) Closer views of the large background of unbound BtParR in BtParM/ParR EM images (Fig. 3A). The unbound BtParR forms elongated structures; some are straight, yet many are curved (red arrows) or even appear to form circles (blue arrows). (Scale bar: 100 Å.) (B) A similar EM view of BtParR (20 µM) in 40 mM Hepes, pH 7.5, 300 mM KCl, 3 mM MgCl2, and 2 mM ATP. (Scale bar: 100 Å.) The structures in A appear to contain more mass than those in B, suggesting that BtParM may associate with the BtParR curved structures.
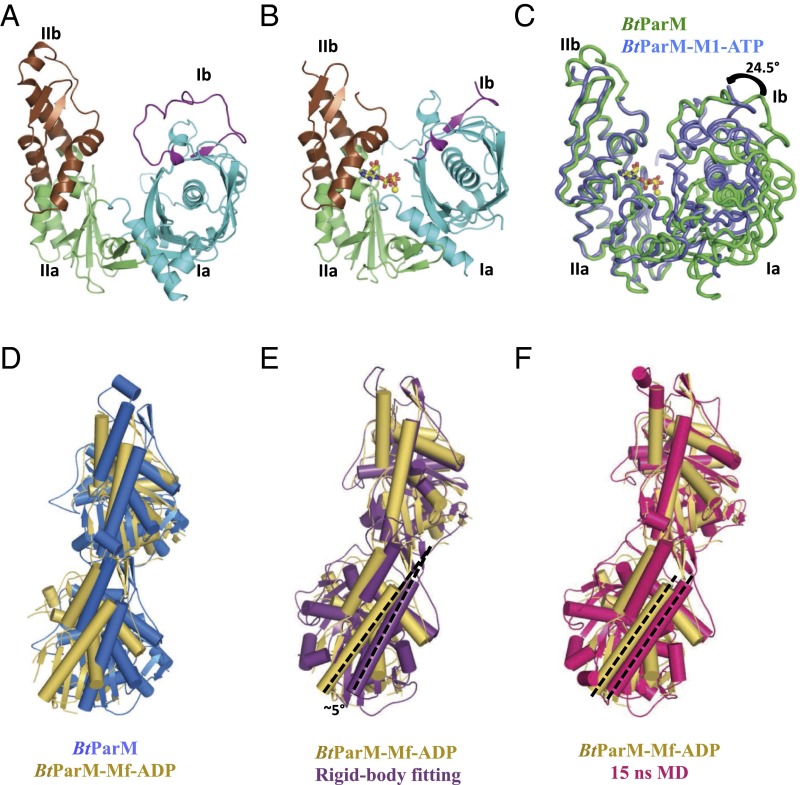
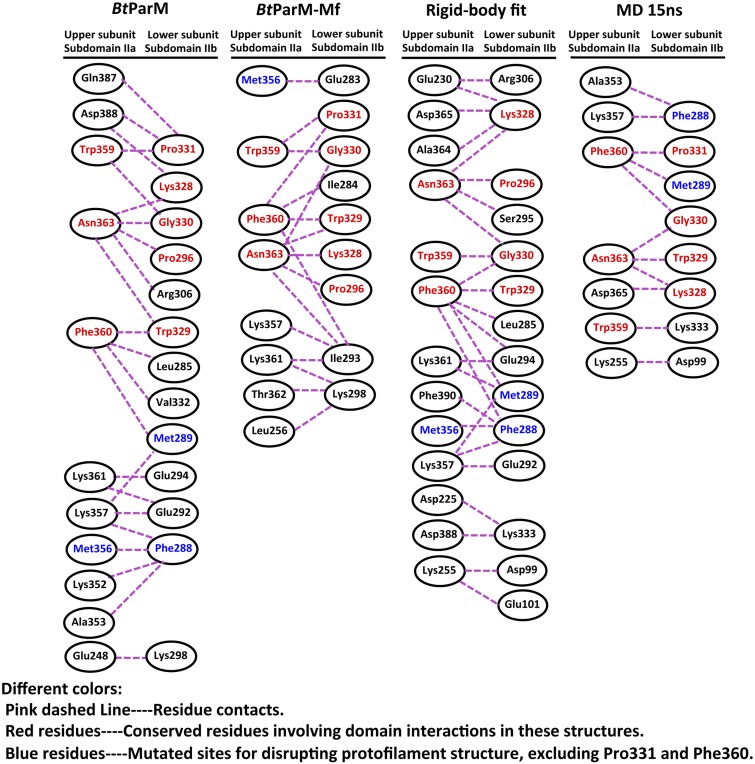
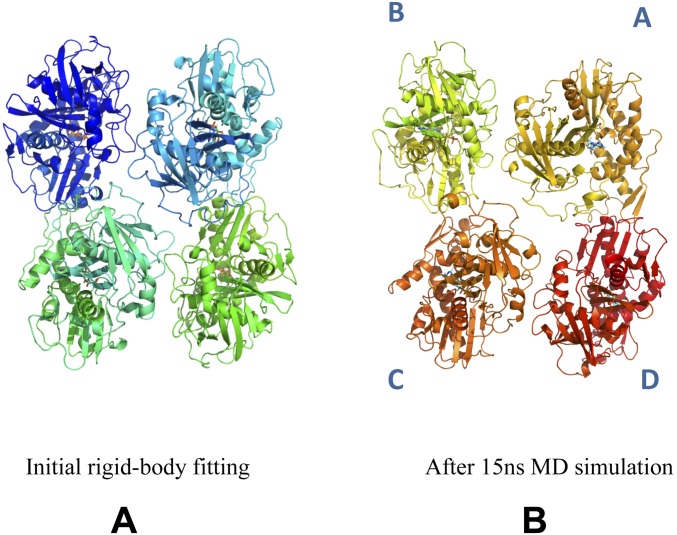
Several high-resolution crystal structures of BtParM were obtained (Fig. 4). To facilitate crystallization in the presence of nucleotides, mutants were designed to prevent polymerization (Tables S1 and S2). Both in the apo- and ADP-bound forms, BtParM packed into untwisted protofilaments within the crystal, which proved to be structurally relevant because the crystal contacts reproduced some of the interstrand interactions found in the left-handed EM filament model (Fig. S6). After the structure of the four protomers that define the two-stranded filament had been refined by molecular dynamics (MD) (Fig. S7; Movie S3), common interstrand filament interactions were apparent between the crystal packing and EM model; these involve Trp359, Phe360, and Asn363 of the upper portion of domain IIa and Gly330, Pro331, Lys328, and Trp329 of the lower portion of domain IIb (Fig. S6).
Fig. 4.
(A) BtParM monomer X-ray structure in the open state. The four subdomains are colored: subdomain Ia (cyan), Ib (magenta), IIa (green), and IIb (brown). (B) BtParM structure with nucleotide ATP (sticks) and magnesium ion (yellow sphere) in the closed state. (C) Superposition of domain II of both BtParM open and closed states reveals that domain I undergoes a propeller-like twist from open to closed state, and subdomain Ib rotates by 24.5° toward the nucleotide-binding cleft (Movie S5). Comparison of the asymmetric unit dimer (BtParM-Mf-ADP, yellow; Fig. S8B) with (D) the protofilament in the crystal packing of apo BtParM (blue); (E) the rigid-body fit of the BtParM-ATP crystal structure into the EM electron density map (purple); and (F) the EM reconstruction after MD refinement (15 ns MD, red). In each case, the upper protomers are superimposed. The dashed black lines in the lower protomers highlight the relative orientations between the lower protomers.
Table S1.
List of proteins and DNA used in this study
| Protein or DNA | Details |
| pBMB67 | Bacillus thuringiensis plasmid pBMB67 |
| (GenBank accession number DQ363750.1) | |
| BtParM | M1-A423 |
| BtParM-M1 | BtParM(M356D/F360D) |
| BtParM-M2 | BtParM(F288D/M289D/P331D) |
| BtParM-Mf | BtParM-M2- (GS)10 -BtParM-M1 |
| BtParR | M1-N188 |
| BtparC1 (1-225bp) | tacatattgagtacgaaattacttttcaagagaagaacacgttacagaacatgttctttatacaaagcaagtgaataatgtgttcgtgaagcgaacaactactgttctcttcacgaacattatgtttaaaagttaaatatggatataaatttttttatcattaattaaactagttgataaactagtttaaactaaactataaactagttgtaggaggaaaatata |
| BtparC2 (1-263bp) | ttttttataaatataaataaactagtttataaactagtttaaactaaattgacaactagtttagttttcgatgtgatttacacataataaatgtcgttccccttaagagcaactagtgttcttaaggggaaatatctatacaaatataatgccacctagaactcagaataagaacacgttctcgaacgtgttctggcaatatagagtacggttaactgttgttctttgagagaacgcaaggtgttctctatataaattcttgt |
Bold font highlights the palindromic repeats.
Table S2.
Data collection and refinement statistics
| Data collection | SeMet BtParM (peak) | Native BtParM | BtParM-M1 (ADP) | BtParM-M1 (ATP) | BtParM-M1 (AMPPNP) | BtParM-Mf (ADP) |
| PDB ID code | 4XE7 | 4XE8 | 4XHO | 4XHN | 4XHP | |
| Space group | P21 | P21 | P22121 | P22121 | P22121 | P21 |
| Unit cell dimensions | ||||||
| a, b, c, Å | 49.3, 116.4, 52.3 | 49.2, 116.4, 52.2 | 55.7, 73.0, 114.3 | 55.8, 73.2, 113.7 | 55.4, 71.4, 114.1 | 55.3, 97.3, 87.9 |
| α, β, γ, ° | 90.0, 115.7, 90.0 | 90.0, 115.7, 90.0 | 90.0, 90.0, 90.0 | 90.0, 90.0, 90.0 | 90.0, 90.0, 90.0 | 90.0, 98.8 90.0 |
| Resolution, Å | 38.8–2.2 | 50.0–2.0 | 20.0–2.38 | 30.0–2.65 | 20.0–2.6 | 30.0–3.2 |
| Rsym (%)* | 9.8 (33.8) | 9.6 (31.7) | 4.6 (42.0) | 5.7 (49.5) | 3.9 (37.7) | 6.2 (31.3) |
| <I/σ(I)>* | 10.7 (4.3) | 27.4 (3.1) | 38.6 (3.5) | 31.0 (4.1) | 49.0 (4.1) | 16.0 (2.5) |
| Completeness (%)* | 98.3 (98.2) | 94.7 (74.7) | 99.1 (86.6) | 100.0 (100.0) | 99.4 (90.6) | 97.5 (96.1) |
| Multiplicity | 6.1 (5.8) | 4.0 (3.7) | 6.9 (5.9) | 7.1 (7.2) | 6.9 (6.3) | 3.1 (2.7) |
| Anomalous completeness (%)* | 96.3 (95.3) | |||||
| Anomalous multiplicity* | 3.1 (3.0) | |||||
| Refinement | ||||||
| Resolution, Å | 25.3–2.0 | 20.0–2.38 | 28.8–2.65 | 20.0–2.6 | 27.8–3.2 | |
| No of reflections | 65,362 | 19,682 | 13,613 | 13,037 | 12,760 | |
| Rwork /Rfree, % | 18.6/23.3 | 21.9/27.5 | 20.3/27.1 | 20.9/27.2 | 22.9/28.7 | |
| No. atoms | ||||||
| Protein | 3,309 | 2,813 | 2,897 | 2,812 | 5,679 | |
| Ligand/ion | — | 28 | 32 | 32 | 56 | |
| Water | 330 | 133 | 132 | 83 | — | |
| Mean B-factors, Å | 37.6 | 39.1 | 36.5 | 39.5 | 63.3 | |
| Rmsd | ||||||
| Bond lengths, Å | 0.008 | 0.002 | 0.011 | 0.003 | 0.006 | |
| Bond angles, ° | 1.15 | 0.73 | 1.59 | 0.82 | 1.31 | |
| Ramachandran plot | ||||||
| Favored, % | 96.64 | 96.82 | 92.72 | 94.22 | 89.24 | |
| Allowed, % | 3.36 | 3.18 | 7.28 | 5.78 | 9.76 | |
| Disallowed, % | 0 | 0 | 0 | 0 | 1.00 |
Values in parentheses are for the highest-resolution shell.
Fig. S6.
Comparison of the conserved in-strand interactions of the protofilaments found in the packing of BtParM crystals with those in the EM models of the antiparallel filament.
Fig. S7.
(A) Initial model from the rigid-body fit of the crystal structure to the electron density map. (B) Further refined by MD. Individual protomers within the four protomers that define the filament are defined as a–d.
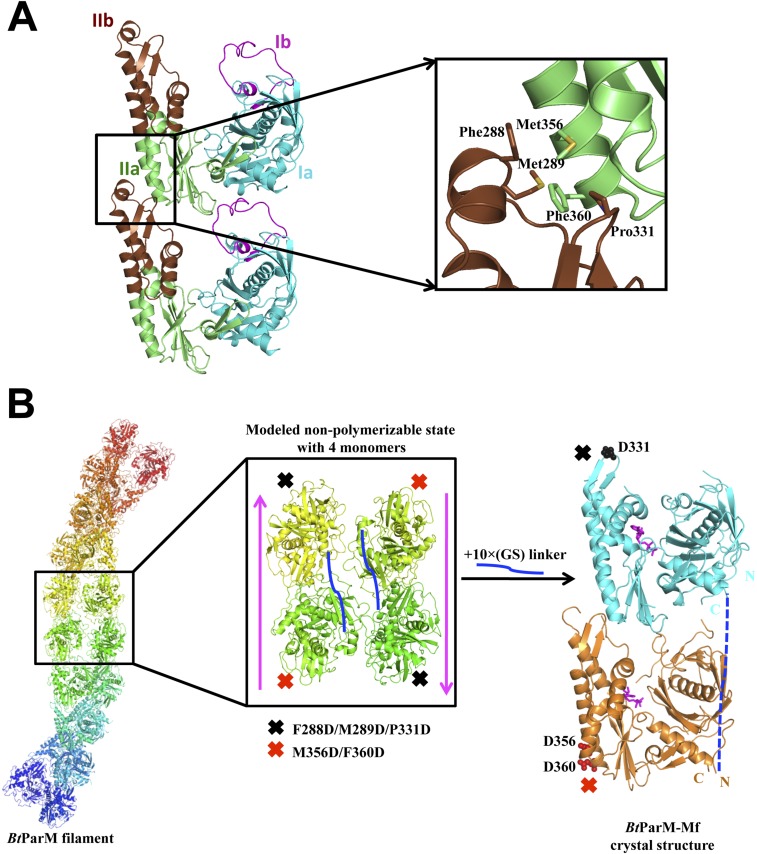
To determine the specificity of these intrastrand protomer interactions, a two-protomer mutant fusion strategy was adopted to disrupt the protofilament (Fig. S8), which was then studied by crystallography. In this crystal form, the asymmetric unit contains a dimer that largely reproduces the intrastrand interactions with the EM structure, yet beyond the dimeric unit the protofilament was disrupted, a testament to the functionality of this interaction (Fig. 4 D–F; Fig. S8). MD simulations of the four protomers that define the antiparallel filament proved to be stable (Movie S3), whereas the eight protomers that define the nanotubule were unstable (Movie S4). This finding is in line with BtParR being necessary to initiate the bringing of two filaments together to form the nanotubule, a likely requirement for plasmid segregation.
Fig. S8.
Fusion protein strategy with two BtParM mutants to determine the specificity of BtParM:BtParM interactions. (A) Residues involved in the interaction between subdomain IIa of the upper subunit and subdomain IIb of the lower subunit of two protomers from the apo BtParM crystal. Mutations were introduced at the protomer:protomer interface to disrupt crystal contact protofilament formation. BtParM-M1 contains M356D/F360D and BtParM-M2 contains F288D/M289D/P331D. (B) Based on the BtParM filament structures (Left), a fusion strategy was designed to obtain an antiparallel (magenta arrow) nonpolymerizable assembly of four protomers (Center). The two mutants were fused with a 10× (Gly-Ser) linker (solid blue line) in a single construct termed BtParM-Mf. Crystal structure of BtParM-Mf (Right) indicates that the two mutants crystalize as a dimer in the asymmetric unit with similar domain II interactions as in the EM filament structure. Outside this dimer, the protofilament structure was successfully disrupted by the mutations, of which the ordered mutations are depicted. The 10× (Gly-Ser) linker is disordered and indicated by a dashed blue line.
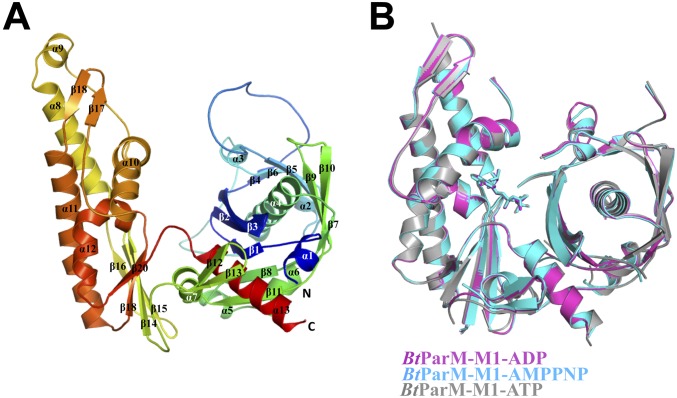
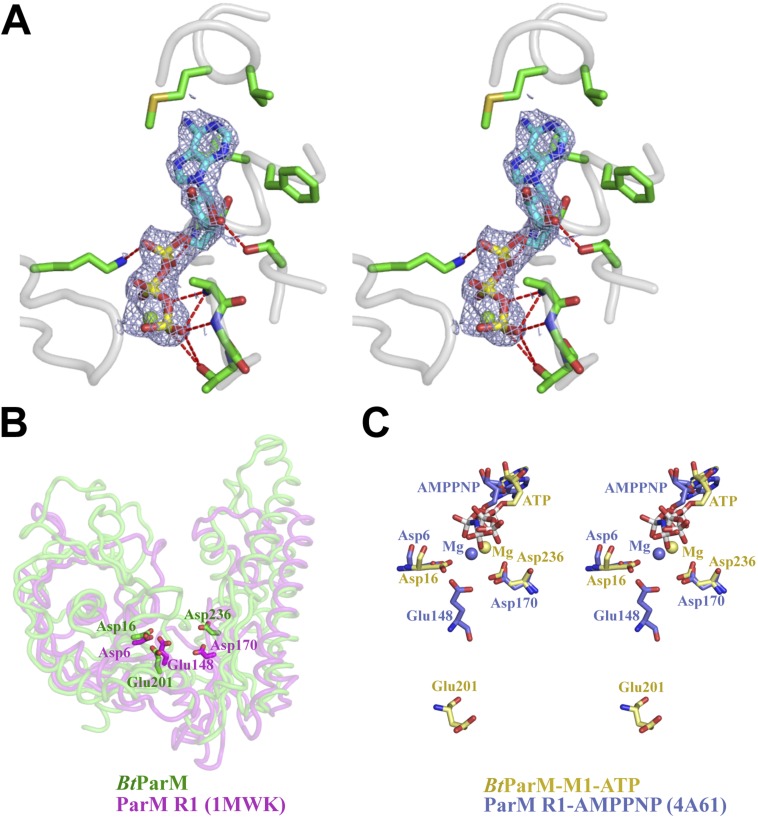
Without nucleotide, the structure of the BtParM monomer adopted an open conformation, which closed on binding the nucleotide and Mg2+ (Fig. 4 A–C). This conformational change involves a propeller-like twist from the open to the closed state and a relative change of angle between the two domains of 24.5°, similar to observations for ParM-R1 (Fig. 4 A–C; Movie S5) (3). As with ParM-R1, atomic structures of BtParM with bound ATP or ADP were almost identical and did not reveal the mechanism of ATP hydrolysis (Fig. 3B; Fig. S9). In ParM-R1, Glu148 has been speculated to be involved in hydrolysis (3). Interestingly, the corresponding residue in BtParM (Glu201) is at virtually the same position as in ParM-R1 when comparing the apo structures. In the presence of nucleotide, Glu148 in ParM-R1 only changes its side-chain position, whereas Glu201 in BtParM moves away (12 Å) from its apo position (Fig. S10). Therefore, we speculate that Glu201 in BtParM acts as a molecular switch triggering ATP hydrolysis.
Fig. S9.
Effect of nucleotides on the BtParM monomer structure. (A) Cartoon representation of the overall structure of apo BtParM in rainbow colors from blue (N terminus) to red (C terminus). α-Helices and β-strands are numbered from N to C termini. (B) Superimposition of the conformations of BtParM-M1 with bound ADP, AMPPNP, or ATP. These structures are very similar with only minor differences in loop domains.
Fig. S10.
Close-up view of the nucleotide binding site, which defines the actin fold. (A) Stereo representation shows the nucleotide binding pocket of BtParM-M1 structure coordinating ATP (cyan sticks) and Mg2+ (green sphere). Key residues involved in ATP binding are shown as green sticks. Hydrogen bonds are indicated with dashed red lines. The OMIT Fo–Fc electron density map (contoured at 2.0 σ) surrounding the ATP-Mg2+ is shown as a mesh. (B) BtParM in the open state (green) was superimposed with apo ParM-R1 (PDB ID code 1MWK; magenta). The three residues that coordinate Mg2+ through water molecules and are thought to be important for ATP hydrolysis are shown with their sidechains (sticks). The relative positions of three residues are conserved in their structures. (C) Superposition (using Cα atoms of domain II) of BtParM-M1 bound to ATP (yellow) into the corresponding domain II of ParM-R1 bound to AMPPNP (PDB ID code 4A61; light blue). Interestingly, in the ATP-bound structure, Asp16 and Asp236 in BtParM-M1 overlap with Asp6 and Asp170 of ParM-R1 bound to AMPPNP, respectively. Glu201 of BtParM-M1 and Glu148 of ParM-R1 are proposed to function similarly to Gln137 from actin in positioning the catalytic water for ATP hydrolysis. The relative positions of Glu201 from BtParM-M1 and Glu148 from ParM-R1 relative positions are distant (∼12 Å) in these nucleotide-bound structures in contrast to the apo structures (B).
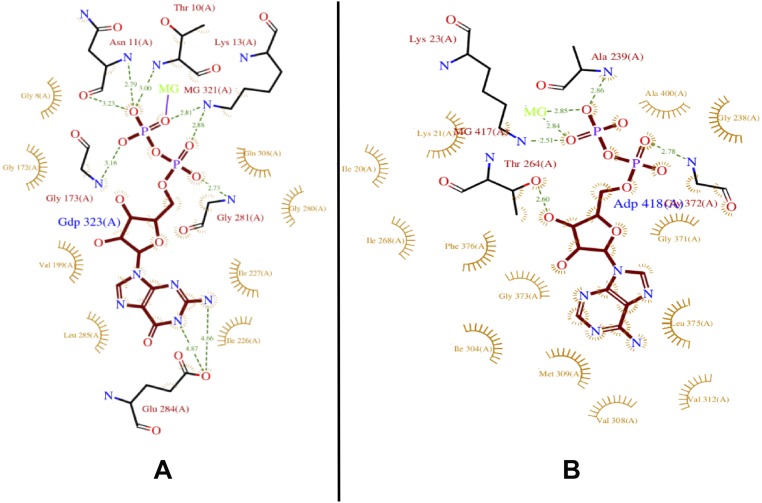
ParM-R1 polymerizes with a large variety of nucleotides, including ATP, GTP, AMPPNP, and GMPPNP (14), whereas BtParM only formed filaments in the presence of ATP. In ParM-R1, the purine of the GDP and GMPPNP is involved in H-bonding with Glu284 but not with ADP or AMPPNP (3). Glu284 is not present in BtParM and may explain the selectivity toward ATP (Fig. S11). The ATP binding site, which is preserved between all actin-like proteins, acts as an ATP hydrolysis and phosphate release controlled conformational switch that is activated by polymerization (21). The ATP switch acts as a timing mechanism to coordinate polymerization and depolymerization (Fig. 1B) (16). BtParM binding to energy-rich ATP causes the nucleotide binding cleft to narrow, allowing the monomer to adopt the polymerization-competent conformation (Fig. 4 A–C). Filament formation stimulates ATP hydrolysis (Fig. 1B), and its transformation into ADP leads to filament destabilization. Thus, we propose that the ADP-bound BtParM within a filament is primed for disintegration, whereas the ATP-bound BtParM monomer results in a conformational primed for association.
Fig. S11.
Schematic representations of the interactions of nucleotides within their respective crystal structures obtained by LigPlot. The H-bonds and their distances are indicated by green dots. (A) ParM-R1-GDP (PDB ID code 2ZGY). Note the H-bonds of the purine with Glu284. (B) BtParM-ADP. Note that the equivalent residue to Glu284 is a valine.
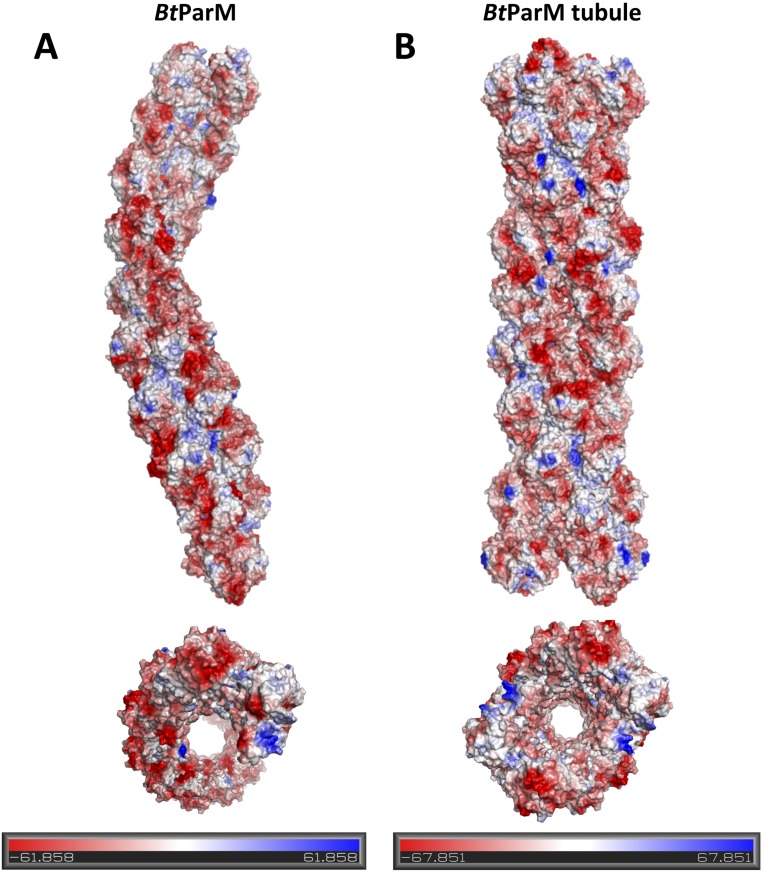
BtParM filaments are highly negatively charged with an effective charge density of 7.4 e/nm (Fig. S12) in the presence of 300 mM salt, typical for bacterial cells. BtParM filaments alone do not self-assemble into nanotubules, but require the binding of BtParR to pair filaments into a nanotubule. To form the nanotubule, parC was not a requirement under the conditions tested. Pairing two BtParM filaments into a cylinder will increase the rigidity of the polymerizing motor. Clamping two highly negatively charged filaments into a cylinder will store energy, which may be relevant for both nanotubule dynamics and plasmid segregation. However, determination of the mechanism of segregation will likely require studies in the host organism.
Fig. S12.
(A) Electrostatic surface of BtParM filament structure in the presence of 300 mM KCl. (B) Electrostatic surface of BtParM nanotubule structure in the presence of 300 mM KCl. Both have a net negative charge. Red, negative charge; blue, positive charge.
Discussion
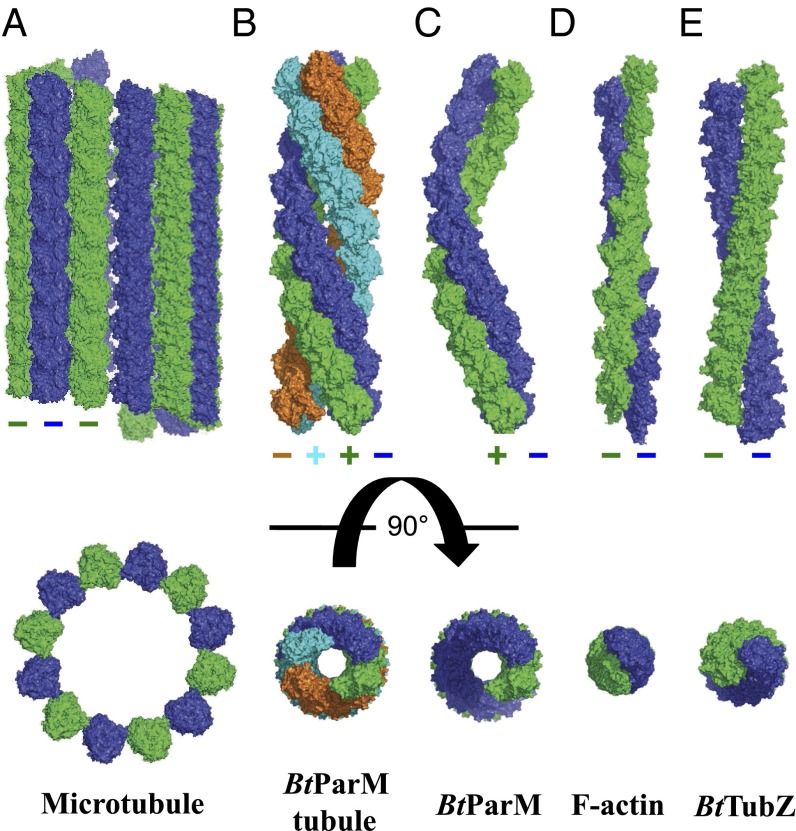
Microtubules form hollow cylinders with 230 Å outer and 180 Å inner diameters consisting of 12–14 parallel protofilaments (Fig. 5). In comparison, the BtParM nanotubule from B. thuringiensis consists of four antiparallel filament strands with dimensions 145 Å and 57 Å (Fig. 5). Tubulin-like DNA segregating proteins are rare in bacteria and, to date, they have not been shown to form a microtubule-like structure (8). Interestingly, one example, TubZ, a treadmilling polymer, which segregates the pBtoxis plasmid, also from B. thuringiensis, forms straight two- or four-stranded polar filaments in vitro dependent on nucleotide (22) and does not form a microtubule-like filament (Fig. 5). In conclusion, we show that the bacterial actin BtParM, which segregates plasmid DNA, forms dynamic nanotubules, properties that largely resemble those of eukaryotic microtubules in segregating chromosomes. These data suggest that the ParM-R1 model system (3) and the BtParCMR system are likely to be just two of many type II plasmid segregation mechanisms operating in bacteria.
Fig. 5.
Comparison of actin-like and tubulin-like filament structures. (A) Mammalian microtubule. (B) B. thuringiensis actin-like BtParM nanotubule. (C) B. thuringiensis actin-like BtParM filament. (D) Mammalian F-actin. (E) B. thuringiensis tubulin-like TubZ. The filament systems are depicted with 10 protomers in each strand, with the exception of F-actin, which has eight. (Upper) Side views. (Lower) Top views.
Materials and Methods
Complete materials and methods are reported in SI Materials and Methods. Briefly, proteins were generally obtained by gene synthesis as N-terminal His-tagged constructs followed by expression in E. coli and purified by Ni2+-affinity chromatography, ion exchange chromatography, and/or gel filtration. The crystal structure of the BtParM monomer was initially elucidated using data collected from selenium methionine BtParM crystals (I24; Diamond Light Source) using the SAD method. Subsequent structures were solved by molecular replacement using this initial structure as the search model from data collected at beamline BL13B1 at the National Synchrotron Radiation Research Center (NSRRC) in Taiwan. Negative-stain electron micrographs were collected on a cooled 4K CCD camera mounted on either a JEOL 1400 or a JEOL 2200 electron microscope operated at 100–200 keV with nominal magnifications of 40,000. Fourier transforms and 3D reconstructions were obtained using the EOS software package (19), and structures were fitted to the electron density using rigid body refinement followed by MD.
Sedimentation studies were carried out at high levels of ATP [40 mM Hepes (pH 7.5), 350 mM KCl, 5 mM MgCl2, and 10 mM ATP] to prevent depolymerization. In vitro assembly and disassembly was followed by light (600 nm) scattering monitored at 90°. Release of inorganic phosphate was measured using the Phosphate Assay Kit (E-6646; Molecular Probes).
SI Materials and Methods
Chemicals.
Chemicals and nucleotides were from Sigma, and fluorophores from Molecular Probes.
Expression and Purification of BtParM and Its Mutants.
Full-length BtParM (GenBank accession no. ABD24344.1) was cloned into the expression vector pSY5 (23), which produced BtParM fused to an N-terminal eight-histidine tag. Mutants of BtParM were introduced using a QuikChange Site-Directed Mutagenesis Kit (Stratagene) and verified by DNA sequencing. The mutants were BtParM-M1 M356D/F360D and BtParM-M2 F288D/M289D/P331D (Table S1). These proteins were overexpressed in the E. coli strain BL21 (DE3) (Novagen). Cells harboring the expression plasmid were grown at 37 °C. At OD600 of 0.6–1.0, the cells were induced at 15 °C overnight with a final concentration of 0.2 mM isopropyl β-d-thiogalactopyranoside before harvesting. All proteins were purified through a standard three-step protocol: first, using a His-Trap Ni-affinity column (GE Healthcare) followed by removal of the His-tag by on-column cleavage with HRV 3C protease (overnight); second, using anion-exchange chromatography with a Q Sepharose column (GE Healthcare); and finally, the proteins were subjected to gel filtration chromatography on a Superdex 75 column (GE Healthcare) using elution buffer containing 40 mM Tris⋅HCl, pH 7.5, 150 mM KCl, 1 mM DTT, and 1 mM MgCl2. For crystallization, the protein samples were concentrated to 10–15 mg/mL. Selenomethionine (SeMet)-labeled BtParM was expressed in minimal medium containing 20 mg/L SeMet and purified as described above and concentrated to 12 mg/mL.
Expression and Purification of the BtParR and BtParM/ParR Complex.
The gene encoding the BtParR (GenBank accession no. ABD24345.1) sequence was synthesized (GenScript) and ligated into the pSY5 vector and sequenced. BtParR purification procedures were as for BtParM. Based on a positive binding interaction between BtParM and BtParR assessed using an analytical gel filtration column, BtParM and BtParR were inserted into a pETDuet-1 vector (Novagen) and coexpressed in E. coli strain BL21 (DE3) (Novagen). BtParR contained an N-terminal His-tag, which was bound to a HisTrap FF Ni-column (GE Healthcare) and eluted. Subsequently, the eluted BtParM/ParR complex was loaded on a Superdex 200 column (GE Healthcare) equilibrated in 100 mM NaCl, 1 mM DTT, 1 mM MgCl2, and 20 mM Hepes, pH 7.5. The purity of the proteins was assessed by SDS/PAGE.
Double BtParM Mutant Fusion Strategy.
The construct was created as follows: two BtParM mutants, BtParM-M1 and BtParM-M2, were fused in a single construct via a linker consisting of 10 glycine–serine repeats. The resultant hybrid protein was named BtParM-Mf (Fig. S8B; Table S1). The DNA encoding this hybrid was inserted into vector pSY5 for expression and purification with an N-terminal His-tag and an HRV 3C protease cleavage site. The hybrid protein was purified with a two-step protocol, containing Ni-NTA affinity chromatography and size-exclusion chromatography (Superdex 200 column). BtParM-Mf was concentrated to 16 mg/mL for crystallization.
Synthesis and Fluorescent Labeling of B. thuringiensis parC1 and parC2.
Two parC DNA fragments were identified in B. thuringiensis plasmid pBMB67 (GenBank accession no. DQ363750.1; parC1 34058–34282; parC2 36196–36458). One, parC1, is located upstream of the ParMR operon and is combined with the promoter of this operon. The other parC2 is downstream of the operon, close to BtParR. The entire parC DNA was synthesized (GenScript) and inserted into a pUC57 vector and sequenced (Table S1). Primers were then designed to amplify DNA fragments containing the two parC sequences, including pUC57-fwd: 5′-CGTTGTAAAACGACGGCCAGT-3′ and pUC57-rv: 5′-CACACAGGAAACAGCTATGACC-3′. Additionally, for EMSA and TIRF experiments, one oligonucleotide was synthesized with a 5′-linked 6-FAM fluorescein (6-FAM-5′-CGTTGTAAAACGACGGCCAGT -3′.
Crystallization and Data Collection.
All crystals were obtained by the hanging-drop vapor diffusion method at 15 °C. The crystals of native and SeMet-BtParM in the apo form were obtained by mixing 1 μL of protein sample with 1 μL of reservoir solution (0.2 M potassium citrate, 20% PEG 3350). Before crystallization of BtParM-M1 containing ADP, ATP, or AMPPNP, protein samples were mixed with 5 mM of nucleotide and placed on ice for 1 h. The crystals of BtParM-M1 (containing M356D and F360D mutations) with nucleotide were obtained by mixing 1 μL of protein sample with 1 μL of reservoir solution (0.1 M Bis-Tris, pH 6.5, 0.2 M ammonium acetate, 25% PEG 3350). The crystals of BtParM-Mf were grown in 0.1 M sodium acetate, pH 5.0, 5% poly-γ-glutamic acid polymer, 30% PEG 400. These crystals were transferred briefly into Paratone-N for cryoprotection before being flash-cooled in liquid nitrogen. Single-wavelength anomalous diffraction (SAD) datasets of SeMet-BtParM were collected at the peak of selenium K edge (λ = 0.9795 Å) on beamline I24 at the Diamond Light Source (United Kingdom). The datasets of native apo-BtParM, BtParM-M1, and BtParM-Mf with different nucleotides were collected at beamline BL13B1 (NSRRC, Taiwan). These datasets were indexed, integrated, and scaled with HKL2000 (Table S2).
Structure Solution and Refinement.
The initial phases for the apo SeMet/BtParM were calculated using the SAD peak dataset with the phasing module AutoSol in PHENIX (24). In total, there were 19 selenium sites identified for the initial phase calculation, and the figure of merit was 0.4. After automatic model-building with PHENIX, more than 80% of the residues were built into the experimental electron density map, and the remaining residues were built manually in COOT (25). Iterative model-building and refinement produced good statistics and geometry. After obtaining the phases of apo SeMet/BtParM and apo-BtParM, the BtParM-M1 structures with nucleotide were solved by molecular replacement using the apo SeMet/BtParM structure as the search model. The BtParM-Mf structure was solved using BtParM-M1 with ADP as a search model. All refinement was conducted using PHENIX. The model quality was checked with the MolProbity (26). Data collection and final refinement statistics are summarized in Table S2.
Cosedimentation of BtParM and BtParR.
BtParM or BtParM/ParR were polymerized in 40 mM Hepes, pH 7.5, 300 mM KCl, 5 mM MgCl2, and 10 mM ATP to prevent filaments from becoming unstable before they could be spun down by fast high-speed ultracentrifugation. Binding assays were analyzed with a 1:1 molar ratio of BtParM and BtParR in two conditions. Either BtParM was first polymerized with ATP at room temperature, then BtParR was added, or ATP was added to the preformed BtParM/ParR complex. The reaction mixtures were centrifuged at 4 °C for maximally 20 min at maximum speed (120,000 × g) in a Beckman Optima MAX ultracentrifuge. Supernatant and pellet fractions were separated and analyzed by SDS/PAGE by protein staining by Coomassie Blue R250.
Electrophoretic Mobility Shift Assays.
Gel-shift assays were performed essentially as described (27) using magnesium–agarose gel electrophoresis. The 5′ linked 6-FAM fluorescein-labeled to upstream parC1 or downstream parC2 DNA fragments with increasing amounts of purified BtParR were mixed in 20 mM Hepes, pH 7.6, 1 mM DTT, 5 mM MgCl2, 150 mM KCl, 5% glycerol, and 0.1 μg/μL sonicated salmon sperm DNA. The reactions were incubated at room temperature for 30 min before loading on a 1.5% magnesium–agarose gel. Electrophoresis was conducted at 100 V for 2 h at 4 °C using a running buffer of 45 mM Tris⋅HCl, 45 mM boric acid, and 5 mM magnesium acetate.
Live-Cell Imaging in Yeast.
Live-cell imaging of ParM polymers in yeast was performed as described previously (28). Cultures were grown in minimal medium without thiamine for 20–24 h to induce the expression of BtParM. Visualization of depolymerization and elongation phases: cultures were spun down at 3,600 × g for 2 min, washed once with PBS, and resuspended in 100 μL of PBS. A total of 1.5 μL of this suspension was placed on a glass slide (with no media) and a coverslip was placed on top. The cover was then sealed with VALAP, which allowed for a temporary ATP depletion (10) (resulting in depolymerization of BtParM) until yeast cells adapted and restored steady-state ATP levels, upon which ParM polymerization was stimulated. All imaging was carried out using a Zeiss Meta510 confocal microscope with a 100× Plan Apochromat 1.4 N.A. oil-immersion objective. GFP-BtParM was excited using a 30-mW 488 Argon laser with 3–5% power and excitation filter HFT 405/488/543 and emission filter BP505-530.
Light Scattering, Phosphate Release, and Kinetic Modeling.
Assembly and disassembly of BtParM (and the 1:1 BtParM/ParR complex) at 24 °C was generally performed in high-salt buffer, mimicking conditions within the bacterial cell, which have in excess of 300 mM KCl in the cytoplasm (40 mM Hepes, pH 7.5, 300 mM KCl, 3 mM MgCl2) and followed by light scattering at 90° using either a Perkin-Elmer LS 55 spectrometer for long-time measurements (initial delay time due to mixing by hand ∼10 s) or a BioLogic stopped-flow machine to observe the early polymerization phase (initial delay time ∼3 ms), monitored at 600 nm. The release of inorganic phosphate upon nucleotide hydrolysis during BtParM polymerization and disassembly in the presence and absence of ParR was measured at 24 °C using the Phosphate Assay Kit (E-6646) from Molecular Probes, based on a method previously described (29). The absorbance at 360 nm was measured using Ultrospec 2100 pro (Amersham Biosciences).
Electron Microscopy.
In this study we used negative stain because it requires considerably less data analysis due to the high signal-to-noise ratio compared with cryoelectron microscopy. Negative stain has been shown to fix structures of filament systems such as F-actin and F-actin-myosin complexes in less than 10 ms, preserving their ultrastructure to ∼20 Å resolution (the resolution limit for negative stain) (30). A drop of BtParM solution with or without BtParR or BtParR/parC1 was applied to carbon-coated copper grids (at the point of maximum polymer assembly as judged from light scattering), blotted, stained with 1% (1 g/100 mL) uranyl acetate, and visualized under either a JEOL 1400 or a JEOL 2200 electron microscope operated at 100–200 keV with nominal magnifications of 40,000×. Images were recorded on a cooled 4K CCD cameras. Fourier transforms and 3D reconstructions were obtained using the EOS software package (19).
EM Reconstructions.
BtParM filament images were extracted from the electron micrographs and computationally straightened. The digitized images were corrected for the phase of the contrast transfer function (CTF). The amplitude of the CTF was corrected after the refinement. To adopt our previous procedures used for cryoelectron micrographs without any change for negatively stained filaments, the contrast of the images was inverted.
BtParM filaments and nanotubules assembled from BtParM or BtParM/ParR, respectively, were reconstructed essentially as previously described for F-actin (17), ParM-R1 (14) and Alp12 (31). First, the averaged Fourier pattern of BtParM filaments (Fig. S6C) from 15 filaments was calculated using EOS (19), which showed clear helical symmetry with 54 Å axial rise and ±33.5° azimuth rotation per one asymmetric unit. A 3D structure was produced by helical reconstruction (18) with eight layer lines (∼54 Å resolution) using the EOS program (19). This reconstructed map was used as the initial structure for single-particle refinement steps. A correlation method (14), a subroutine of the EOS program (19), compares the density map of the initial reconstruction with the density of a single filament image, which allows the polarity of each individual filament to be determined, a procedure generally used in helical filament reconstruction (14). Next, a refined map of BtParM was obtained from 133 individual filaments containing 4,924 particles. Filaments were only included in the analysis for which clear polarity could be determined and filaments aligned accordingly for averaging. Although the structure was reconstructed with assumption that the filaments had polarity, the structure appeared to be nonpolar. Indeed, when the determined electron density map was flipped upside down and averaged with the original structure, which made the structure nonpolar, the resolution improved (Fig. S3B). From this result we conclude that the BtParM forms nonpolar filaments. The averaged nonpolar structure is shown in Fig. 2 B and D, and the directions in which the strands run are defined as (+) and (−). The CTF amplitude was corrected after the iteration converged as described in detail (17). The final resolution (18.6 Å) was evaluated by Fourier shell correlation (FSC) (32) (Fig. S3B). Crystal structures of BtParM were docked into the final EM map in Situs (33). The fitting that had the largest correlation value was selected. Only the closed form of the BtParM crystal structures fitted well into the electron density map (Fig. S3D).
Reconstruction of the Nanotubule Formed from the BtParM/ParR Complex.
The averaged Fourier pattern of filaments formed from the BtParM/ParR complex was calculated from 29 filaments (Fig. S4A), indicating a 50-Å axial rise and a ±34° azimuth rotation, which is similar to that of BtParM. The layer lines were noisier than those of BtParM, presumably due to the large background of unbound BtParR. The initial helical reconstruction was performed with 11 layer lines (∼45 Å resolution), and the same routine was followed as outlined above for BtParM. The refined structure of the nanotubule was obtained from 68 filaments containing 2,423 particles. The nanotubule density map was composed of a four-stranded structure, where two BtParM filaments are paired to form of a hollow tube. The resolution was ∼23 Å as evaluated by FSC (32) (Fig. S4B).
The model of the nanotubule composed of two double-stranded BtParM filaments fitted the EM electron density map well (Fig. 3 B and C). To refine the nanotubule model and detect the interacting residues, which stabilize the cylinder, we carried out MD simulation of eight protomers (four from each filament; Movie S4) of the cylinder by the aforementioned methods.
Poisson–Boltzmann Electrostatic Surfaces.
Poisson–Boltzmann electrostatic surface of right- and left-handed filaments were calculated at 300 mM KCl concentration using CHARMM (34). The dielectric constant for solvent was set to 80. The filaments are mostly negatively charged along the surface with total atomic partial charge of −26 per monomer.
Refinement of Filament Models by MD Simulation.
Using MD, the rigid body fit into the electron density map was further improved. The time complexity for calculating long-range interactions during MD simulation scales to O(N logN), where the N is the number of atoms; this makes it prohibitively expensive to carry out MD simulation of the whole filament. To circumvent this problem, we chose the four protomers (tetramer) that define the filament for MD simulations. Before the MD simulations, left- and right-handed tetramers with ATP were centered and solvated in a rhombic dodecahedron box with distance of 1 nm of the protein to the box using the TIP3P (35) water model. A sufficient number of counter ions were added to neutralize the system to implement the particle mesh Ewald (PME) algorithm. Next, energy minimization was conducted in Gromacs 4.6.5 (36) using the all-atom Amber99sb-ildn force field (37) using the steepest descent algorithm allowing fast convergence to the local energy minima (38). Thereafter, the equilibration of the system was carried out in two steps: 100 ps canonical ensemble (NVT) and 100 ps isothermal–isobaric ensemble (NPT) simulations with harmonic restraints (force constant: 10 kJ⋅mol−1⋅K−1) applied to the backbone atoms of the protein. The MD runs were carried out for a further 15 ns with the NPT ensemble without restraints.
The temperature was maintained at 310 K with the V-rescale algorithm (39) because B. thuringiensis favors that temperature and the pressure was coupled at 1 bar by isotropic pressure coupling using the Parrinello–Rahman algorithm [time constant 10 ps, isothermal compressibility of water: 4.5 exp(−5) bar−1] (40). Long-range electrostatics was calculated using a fourth-order PME algorithm (41). All bonds were constrained using a fourth order P-LINCS algorithm allowing 2-fs integration time step to be used (42). Electrostatic and Lennard Jones (van der Waal's) interactions were cutoff at 1 nm, and a dispersion correction was applied. Periodic boundary conditions were implemented in three dimensions. Initial atomic velocities, before NVT equilibration, were obtained from the Maxwell distribution at 310 K. Neighbor lists for nonbonded interactions were updated at every fifth step. Trajectories were analyzed using Gromacs tools (38), PyMol (43), and custom Bash shell and Python 2.7 (https://www.python.org/) scripts using NumPy (www.numpy.org) and Matplotlib (44) libraries. In these simulations the right-handed filament model proved to be unstable, and the left-handed filament model maintained the filament structure.
Supplementary Material
Acknowledgments
We thank Jonathan Grimes for help with X-ray data collection and the Joint Centre for Structural Biology (Singapore) for providing research facilities, supported by grants from Nanyang Technological University and the Biomedical Research Council of the Agency for Science, Technology and Research (A*STAR). Parts of this study were carried out on beamline BL13B1 at the National Synchrotron Radiation Research Center (Taiwan) and I24 at the Diamond Light Source (Great Britain) under proposal MX8423. This work was supported by A*STAR in Singapore and Joint Council Office Grant Project 12302FG012 (to S.J., D.P., and R.C.R.); the Mechanobiology Institute and Temasek Life Science Institute (Singapore) (R.S. and M.K.B.); and the Japan Society for the Promotion of Science (JSPS) KAKENHI Grant 14431234 (to A.N.).
Footnotes
The authors declare no conflict of interest.
This article is a PNAS Direct Submission.
Data deposition: The atomic coordinates have been deposited in the Protein Data Bank, www.pdb.org (PDB ID codes 4XE7, 4XE8, 4XHO, 4XHN, and 4XHP).
This article contains supporting information online at www.pnas.org/lookup/suppl/doi:10.1073/pnas.1600129113/-/DCSupplemental.
References
- 1.Gerdes K, Howard M, Szardenings F. Pushing and pulling in prokaryotic DNA segregation. Cell. 2010;141(6):927–942. doi: 10.1016/j.cell.2010.05.033. [DOI] [PubMed] [Google Scholar]
- 2.Bharat TA, Murshudov GN, Sachse C, Löwe J. Structures of actin-like ParM filaments show architecture of plasmid-segregating spindles. Nature. 2015;523(7558):106–110. doi: 10.1038/nature14356. [DOI] [PMC free article] [PubMed] [Google Scholar]
- 3.Gayathri P, et al. A bipolar spindle of antiparallel ParM filaments drives bacterial plasmid segregation. Science. 2012;338(6112):1334–1337. doi: 10.1126/science.1229091. [DOI] [PMC free article] [PubMed] [Google Scholar]
- 4.Polka JK, Kollman JM, Mullins RD. Accessory factors promote AlfA-dependent plasmid segregation by regulating filament nucleation, disassembly, and bundling. Proc Natl Acad Sci USA. 2014;111(6):2176–2181. doi: 10.1073/pnas.1304127111. [DOI] [PMC free article] [PubMed] [Google Scholar]
- 5.Popp D, et al. Structure and filament dynamics of the pSK41 actin-like ParM protein: Implications for plasmid DNA segregation. J Biol Chem. 2010;285(13):10130–10140. doi: 10.1074/jbc.M109.071613. [DOI] [PMC free article] [PubMed] [Google Scholar]
- 6.Holmes KC, Popp D, Gebhard W, Kabsch W. Atomic model of the actin filament. Nature. 1990;347(6288):44–49. doi: 10.1038/347044a0. [DOI] [PubMed] [Google Scholar]
- 7.Szardenings F, Guymer D, Gerdes K. ParA ATPases can move and position DNA and subcellular structures. Curr Opin Microbiol. 2011;14(6):712–718. doi: 10.1016/j.mib.2011.09.008. [DOI] [PubMed] [Google Scholar]
- 8.Aylett CH, Wang Q, Michie KA, Amos LA, Löwe J. Filament structure of bacterial tubulin homologue TubZ. Proc Natl Acad Sci USA. 2010;107(46):19766–19771. doi: 10.1073/pnas.1010176107. [DOI] [PMC free article] [PubMed] [Google Scholar]
- 9.Chao L, et al. Complete nucleotide sequence of pBMB67, a 67-kb plasmid from Bacillus thuringiensis strain YBT-1520. Plasmid. 2007;57(1):44–54. doi: 10.1016/j.plasmid.2006.06.002. [DOI] [PubMed] [Google Scholar]
- 10.Saitoh S, Yanagida M. Does a shift to limited glucose activate checkpoint control in fission yeast? FEBS Lett. 2014;588(15):2373–2378. doi: 10.1016/j.febslet.2014.04.047. [DOI] [PubMed] [Google Scholar]
- 11.Cayley S, Lewis BA, Guttman HJ, Record MT., Jr Characterization of the cytoplasm of Escherichia coli K-12 as a function of external osmolarity. Implications for protein-DNA interactions in vivo. J Mol Biol. 1991;222(2):281–300. doi: 10.1016/0022-2836(91)90212-o. [DOI] [PubMed] [Google Scholar]
- 12.Alatossava T, Jütte H, Kuhn A, Kellenberger E. Manipulation of intracellular magnesium content in polymyxin B nonapeptide-sensitized Escherichia coli by ionophore A23187. J Bacteriol. 1985;162(1):413–419. doi: 10.1128/jb.162.1.413-419.1985. [DOI] [PMC free article] [PubMed] [Google Scholar]
- 13.Yaginuma H, et al. Diversity in ATP concentrations in a single bacterial cell population revealed by quantitative single-cell imaging. Sci Rep. 2014;4:6522. doi: 10.1038/srep06522. [DOI] [PMC free article] [PubMed] [Google Scholar]
- 14.Popp D, et al. Molecular structure of the ParM polymer and the mechanism leading to its nucleotide-driven dynamic instability. EMBO J. 2008;27(3):570–579. doi: 10.1038/sj.emboj.7601978. [DOI] [PMC free article] [PubMed] [Google Scholar]
- 15.Møller-Jensen J, Jensen RB, Löwe J, Gerdes K. Prokaryotic DNA segregation by an actin-like filament. EMBO J. 2002;21(12):3119–3127. doi: 10.1093/emboj/cdf320. [DOI] [PMC free article] [PubMed] [Google Scholar]
- 16.Ghoshdastider U, Jiang S, Popp D, Robinson RC. In search of the primordial actin filament. Proc Natl Acad Sci USA. 2015;112(30):9150–9151. doi: 10.1073/pnas.1511568112. [DOI] [PMC free article] [PubMed] [Google Scholar]
- 17.Narita A, Maéda Y. Molecular determination by electron microscopy of the actin filament end structure. J Mol Biol. 2007;365(2):480–501. doi: 10.1016/j.jmb.2006.06.056. [DOI] [PubMed] [Google Scholar]
- 18.Stewart M. Computer image processing of electron micrographs of biological structures with helical symmetry. J Electron Microsc Tech. 1988;9(4):325–358. doi: 10.1002/jemt.1060090404. [DOI] [PubMed] [Google Scholar]
- 19.Yasunaga T, Wakabayashi T. Extensible and object-oriented system Eos supplies a new environment for image analysis of electron micrographs of macromolecules. J Struct Biol. 1996;116(1):155–160. doi: 10.1006/jsbi.1996.0025. [DOI] [PubMed] [Google Scholar]
- 20.Schumacher MA, et al. Segrosome structure revealed by a complex of ParR with centromere DNA. Nature. 2007;450(7173):1268–1271. doi: 10.1038/nature06392. [DOI] [PubMed] [Google Scholar]
- 21.Gunning PW, Ghoshdastider U, Whitaker S, Popp D, Robinson RC. The evolution of compositionally and functionally distinct actin filaments. J Cell Sci. 2015;128(11):2009–2019. doi: 10.1242/jcs.165563. [DOI] [PubMed] [Google Scholar]
- 22.Montabana EA, Agard DA. Bacterial tubulin TubZ-Bt transitions between a two-stranded intermediate and a four-stranded filament upon GTP hydrolysis. Proc Natl Acad Sci USA. 2014;111(9):3407–3412. doi: 10.1073/pnas.1318339111. [DOI] [PMC free article] [PubMed] [Google Scholar]
- 23.Chumnarnsilpa S, et al. The crystal structure of the C-terminus of adseverin reveals the actin-binding interface. Proc Natl Acad Sci USA. 2009;106(33):13719–13724. doi: 10.1073/pnas.0812383106. [DOI] [PMC free article] [PubMed] [Google Scholar]
- 24.Adams PD, et al. PHENIX: A comprehensive Python-based system for macromolecular structure solution. Acta Crystallogr D Biol Crystallogr. 2010;66(Pt 2):213–221. doi: 10.1107/S0907444909052925. [DOI] [PMC free article] [PubMed] [Google Scholar]
- 25.Emsley P, Cowtan K. Coot: Model-building tools for molecular graphics. Acta Crystallogr D Biol Crystallogr. 2004;60(Pt 12 Pt 1):2126–2132. doi: 10.1107/S0907444904019158. [DOI] [PubMed] [Google Scholar]
- 26.Chen VB, et al. MolProbity: All-atom structure validation for macromolecular crystallography. Acta Crystallogr D Biol Crystallogr. 2010;66(Pt 1):12–21. doi: 10.1107/S0907444909042073. [DOI] [PMC free article] [PubMed] [Google Scholar]
- 27.Zerby D, Lieberman PM. Functional analysis of TFIID-activator interaction by magnesium-agarose gel electrophoresis. Methods. 1997;12(3):217–223. doi: 10.1006/meth.1997.0474. [DOI] [PubMed] [Google Scholar]
- 28.Srinivasan R, Mishra M, Wu L, Yin Z, Balasubramanian MK. The bacterial cell division protein FtsZ assembles into cytoplasmic rings in fission yeast. Genes Dev. 2008;22(13):1741–1746. doi: 10.1101/gad.1660908. [DOI] [PMC free article] [PubMed] [Google Scholar]
- 29.Webb MR. A continuous spectrophotometric assay for inorganic phosphate and for measuring phosphate release kinetics in biological systems. Proc Natl Acad Sci USA. 1992;89(11):4884–4887. doi: 10.1073/pnas.89.11.4884. [DOI] [PMC free article] [PubMed] [Google Scholar]
- 30.Zhao FQ, Craig R. Capturing time-resolved changes in molecular structure by negative staining. J Struct Biol. 2003;141(1):43–52. doi: 10.1016/s1047-8477(02)00546-4. [DOI] [PubMed] [Google Scholar]
- 31.Popp D, et al. Novel actin-like filament structure from Clostridium tetani. J Biol Chem. 2012;287(25):21121–21129. doi: 10.1074/jbc.M112.341016. [DOI] [PMC free article] [PubMed] [Google Scholar]
- 32.van Heel M, Schatz M. Fourier shell correlation threshold criteria. J Struct Biol. 2005;151(3):250–262. doi: 10.1016/j.jsb.2005.05.009. [DOI] [PubMed] [Google Scholar]
- 33.Wriggers W, Birmanns S. Using situs for flexible and rigid-body fitting of multiresolution single-molecule data. J Struct Biol. 2001;133(2-3):193–202. doi: 10.1006/jsbi.2000.4350. [DOI] [PubMed] [Google Scholar]
- 34.Brooks BR, et al. CHARMM: A program for macromolecular energy, minimization, and dynamics calculations. J Comput Chem. 1983;4:187–217. [Google Scholar]
- 35.Jorgensen WL, Chandrasekhar J, Madura JD, Impey RW, Klein ML. Comparison of simple potential functions for simulating liquid water. J Chem Phys. 1983;79:926–935. [Google Scholar]
- 36.Pronk S, et al. GROMACS 4.5: A high-throughput and highly parallel open source molecular simulation toolkit. Bioinformatics. 2013;29(7):845–854. doi: 10.1093/bioinformatics/btt055. [DOI] [PMC free article] [PubMed] [Google Scholar]
- 37.Lindorff-Larsen K, et al. Improved side-chain torsion potentials for the Amber ff99SB protein force field. Proteins. 2010;78(8):1950–1958. doi: 10.1002/prot.22711. [DOI] [PMC free article] [PubMed] [Google Scholar]
- 38.van der Spoel D, et al. 2010 Gromacs user manual version 4.5.4. Available at gromacs.org/
- 39.Bussi G, Donadio D, Parrinello M. Canonical sampling through velocity rescaling. J Chem Phys. 2007;126(1):014101. doi: 10.1063/1.2408420. [DOI] [PubMed] [Google Scholar]
- 40.Parrinello M. Polymorphic transitions in single crystals: A new molecular dynamics method. J Appl Phys. 1981;52:7182–7190. [Google Scholar]
- 41.Essmann U, et al. A smooth particle mesh Ewald method. J Chem Phys. 1995;103:8577–8593. [Google Scholar]
- 42.Hess B. P-LINCS: A parallel linear constraint solver for molecular simulation. J Chem Theory Comput. 2008;4(1):116–122. doi: 10.1021/ct700200b. [DOI] [PubMed] [Google Scholar]
- 43. Delano W (2012). The PyMOL Molecular Graphics System, Version 1.5. Available at www.pymol.org.
- 44.Hunter JD. Matplotlib: A 2D graphics environment. Comput Sci Eng. 2007;9:90–95. [Google Scholar]
Associated Data
This section collects any data citations, data availability statements, or supplementary materials included in this article.


