

Significance
Advances in biotechnology are enabling engineers to harness natural processes for the production of valuable new chemicals and materials. Cells engineered for chemical production act as renewable factories and redefine what is possible in industries as diverse as manufacturing, pharmaceuticals, and energy. Despite this potential, long and uncertain timelines for biobased product development hinder progress. Engineering cells for chemical production is challenging because the complexity of biology necessitates many attempted designs before an optimal combination of genetic elements or culture conditions is discovered. In this work, we develop a framework that allows design evaluation to be performed with fluorescence such that microbial chemical production can be monitored in real time without the need for sample preparation or laborious analytical techniques.
Keywords: biotechnology, directed evolution, biosensor, metabolic engineering, synthetic biology
Abstract
Engineering cells to produce valuable metabolic products is hindered by the slow and laborious methods available for evaluating product concentration. Consequently, many designs go unevaluated, and the dynamics of product formation over time go unobserved. In this work, we develop a framework for observing product formation in real time without the need for sample preparation or laborious analytical methods. We use genetically encoded biosensors derived from small-molecule responsive transcription factors to provide a fluorescent readout that is proportional to the intracellular concentration of a target metabolite. Combining an appropriate biosensor with cells designed to produce a metabolic product allows us to track product formation by observing fluorescence. With individual cells exhibiting fluorescent intensities proportional to the amount of metabolite they produce, high-throughput methods can be used to rank the quality of genetic variants or production conditions. We observe production of several renewable plastic precursors with fluorescent readouts and demonstrate that higher fluorescence is indeed an indicator of higher product titer. Using fluorescence as a guide, we identify process parameters that produce 3-hydroxypropionate at 4.2 g/L, 23-fold higher than previously reported. We also report, to our knowledge, the first engineered route from glucose to acrylate, a plastic precursor with global sales of $14 billion. Finally, we monitor the production of glucarate, a replacement for environmentally damaging detergents, and muconate, a renewable precursor to polyethylene terephthalate and nylon with combined markets of $51 billion, in real time, demonstrating that our method is applicable to a wide range of molecules.
Biological production of valuable products such as pharmaceuticals or renewable chemicals holds the potential to transform the global economy. However, the rate at which bioengineers are able to engineer new living catalysts is hampered by an exceedingly slow design–build–test cycle. We describe a method to accelerate the design–build–test cycle for metabolic engineering by enabling the observation of product formation within microbes as it occurs.
Biological production of a desired product is accomplished by guiding a low-cost starting material such as glucose through a series of intracellular enzymatic reactions, ultimately yielding a molecule of economic interest. The choice of culture conditions, the creation of enzyme variants, and the tuning of endogenous cellular metabolism create a vast universe of potential designs. Because of the complexity of biology, appropriate genetic designs and culture conditions are not known a priori. Even sophisticated modeling paradigms can result in very large design spaces (1, 2). Evaluating genetic designs or modulating process parameters to achieve a desired outcome is therefore a major bottleneck in the bioengineering design–build–test cycle.
Current methods for evaluating biological production of chemicals rely on slow and laborious techniques such as HPLC and mass spectrometry (MS) (3). Estimates of the throughput of these methods are thousands of samples per day in highly specialized laboratories and hundreds of samples per day in more typical laboratories (3). These rates of evaluation are exceedingly small compared with typical enzyme library sizes, or the 1 × 10⁹ unique genomes that can be built in a day by using multiplexed genome engineering (2). If product formation kinetics are to be observed, many time points over the course of production must be analyzed, further reducing the number of conditions than can be evaluated.
Engineers have begun developing strategies for multiplexed evaluation of metabolite production phenotypes to enable a fully multiplexed design–build–test cycle (1, 4–7). In cases of genetic engineering, such a design cycle would more closely resemble biological evolution, rather than the design approaches inspired by electrical engineering that currently dominate the fields of synthetic biology and metabolic engineering. Strategies for multiplexed design evaluation include selections and screens. Selections, which only allow cells exhibiting a desired phenotype to live, have the potential to evaluate billions of designs simultaneously (3). Selections are limited by their false-positive rate and can be challenging to troubleshoot, especially if high production of the metabolite of interest provides a negative growth phenotype. Genetically encoded biosensors link intracellular metabolite levels to fluorescent protein expression and enable fluorescence-based screens. Combined with fluorescent activated cell sorting (FACS), biosensor-based screens provide evaluation rates of up to 1 × 10⁸ designs per day (8, 9).
Genetically encoded biosensors are the most versatile method for coupling cellular fluorescence to the quality of a metabolic engineering design. Genetically encoded biosensors link the expression of a fluorescent protein to the intracellular concentration of a target metabolite through the use of intracellular switches such as allosterically regulated transcription factors. In addition to the classic small-molecule inducible systems such as lacI-IPTG and tetR-aTC (10), many new biosensors have been characterized that respond to valuable products as diverse as macrolide antibiotics, flavonoids, and plastic precursors (11).
Our group has previously published detailed characterizations of biosensors that respond to commercially important compounds. Although these studies primarily focused on the biosensors themselves, we did demonstrate that end-point measurements of fluorescence reflect product titers for a single catalytic step (11). However, engineers are typically dealing with metabolic pathways that start with low-cost carbon and energy sources, such as glucose, and proceed through many catalytic steps that are mediated by many gene products, before reaching the target compound. In this work, we monitor product formation through full metabolic pathways and show that the kinetics of product formation can be observed in real time.
Advances in the deployment of biosensors to monitor product formation has been a topic of great interest in recent years and has been well reviewed (12). In many cases, biosensors are used to estimate product titer at a single time point rather than to observe product formation as it takes place. A biosensor designed to respond to a product, while ignoring intermediates, allows the fluorescent readout to act as a real-time proxy for product formation from glucose or other precursors (Fig. 1). This method allows simple observation of performance characteristics such as the rate of product formation or the titer, all without the need for low-throughput analytical pipelines (13).
Fig. 1.

Biosensors enable real-time monitoring of biological chemical production. A metabolic pathway converts a low-cost starting material such as glucose (green triangle) to a desired product (green square) through a series of enzymatic reactions. A biosensor (blue ellipse) regulates the production of a fluorescent reporter by preventing transcription in the absence of the correct inducing molecule. The fluorescent response of the biosensor is proportional to the amount of product produced by the cell because the starting material and intermediates do not activate the biosensor. Each cell reports its rate of chemical production through its fluorescence intensity. Cells with high intensity, and consequently highly productive metabolic pathways, are easily identified.
Observing product formation in real time provides engineers with much greater flexibility in phenotype evaluation than biosensors that are only used to provide a snapshot of the intracellular cell state. For example, the kinetics of production can be used to rank genetic designs when titers exceed biosensor detection limits: Cells with faster production rates can be isolated before sensor saturation. In situations where the pathway being optimized is destined for extracellular use—or the end product is toxic and the optimized enzymes will be ported to a new host—the rate of product formation may be more important than final titer. Supplementing various pathway intermediates and evaluating the kinetics of product formation at each step enables engineers to determine pathway bottlenecks and even probe complicated behaviors like product or substrate inhibition.
In this work, we develop a strategy for real-time monitoring of metabolic product formation and demonstrate its utility in observing the production of 3-hydroxypropionate (3HP; a renewable plastic precursor) (14), acrylate (the monomer for several common plastics), glucarate (a renewable building block for superabsorbent polymers and a replacement for phosphates in detergents) (15), and muconate (a building block for renewable nylon) (16). We develop two unique biosensors for 3HP and compare their ability to observe 3HP production. We use the real-time observation of 3HP formation to select process parameters that result in a 23-fold increase in 3HP production over previously reported titers. We achieve, to our knowledge, the first direct heterologous route to acrylate by converting 3HP to acrylate in vivo. We go on to demonstrate that this method is applicable to a range of compounds by deploying glucarate and muconate biosensors with their respective heterologous metabolic pathways.
Results and Discussion
The framework for real-time observation of metabolite production consists of two components: the biosensor and the pathway (Fig. 1). The biosensor is a small-molecule inducible system that produces a fluorescent readout proportional to the amount of product inside of the cell. The pathway consists of all the genes necessary to produce the product molecule from a desired starting point, typically a low-cost feedstock such as glucose or biomass. Rates of product formation vary depending on the amount of intermediate supplied, the number of reactions leading from that intermediate to the final product, and how fast those reactions take place. Final titers depend on these factors as well as the amount of starting material that is shunted into side reactions or used for energy by the cell. We selected pathways for the production of 3HP, glucarate, and muconate from the literature. The acrylate biosynthesis pathway was developed in this study and represents, to our knowledge, the first heterologous route from glucose to acrylate. Previously characterized muconate and glucarate biosensors were combined with their respective production pathways to monitor product formation. Because there are no existing biosensors for 3HP, novel sensors were developed and evaluated for their ability to sense 3HP production in real time.
The first 3HP biosensor was developed from the Escherichia coli 2-methylcitrate responsive transcriptional regulator prpR (17). Because no 3HP-responsive allosteric transcriptional regulator is known, it was necessary to use a transcriptional regulator that binds to a molecule that 3HP can be converted to intracellularly. The principle of relying on a downstream molecule to affect a response from a nonbinding target compound was pioneered in the Keasling laboratory, when prpR and two endogenous enzymes were used to construct a propionate biosensor (18). Here, we use the endogenous enzyme, 2-methylcitrate synthase (prpC) and the heterologous multifunctional enzyme propionyl-CoA synthase (pcs) from the carbon fixation pathway of Chloroflexus aurantiacus (19) to produce 2-methylcitrate from 3HP. Together the system of three genes (pcs, prpC, and prpR) comprise the prpR-based 3HP biosensor (SI Results and Discussion and Fig. S1).
Fig. S1.

Development of the prpR-based 3HP biosensor. (A) Two helper enzymes, pcs from Chloroflexus aurantiacus and the endogenous prpC, convert 3HP into the prpR-binding compound 2-methylcitrate. (B) Exogenously supplied 3HP triggers a fluorescent response in cells containing the biosensor (green bars). Increasing the concentration of 3HP results in a higher fluorescent output. No biosensor activation is observed without the helper enzyme pcs (gray bars). (C) The fluorescent response of the biosensor to 6 mM 3HP begins after 1 h and achieves 90% saturation after 10 h (green line). Basal induction increases over time but remains low (gray line). Error bars and confidence bands represent the 95% confidence interval (n = 3).
The second 3HP biosensor was developed from acuR, an acrylate responsive transcriptional regulator found in the aquatic bacterium Rhodobacter sphaeroides (20). A pathway was constructed that converts 3HP to acrylate (Fig. 2A), allowing the acrylate biosensor to report intracellular 3HP concentration. In this case, a truncated version of the multifunctional enzyme pcs is used to convert 3HP into acrylyl-CoA, which is subsequently hydrolyzed to acrylate by the acrylyl-CoA hydrolase (ach) from Acinetobacter baylyi (21). In Chloroflexus aurantiacus, pcs catalyzes three subsequent reactions: 3HP to 3HP-CoA to acrylyl-CoA to propionyl-CoA (19). We made use of all three reactions in the prpR-based biosensor, but for the acuR-based biosensor, accumulation of acrylyl-CoA rather than propionyl-CoA is necessary. Separation of pcs into its functional domains has been shown to increase the rates of the individual reactions (22). Because of this finding, we reasoned that we could remove the domain responsible for conversion of acrylyl-CoA to propionyl-CoA while preserving the activity of the other two domains. We refer to the truncated enzyme as pcsΔ3, and its coexpression with ach and acuR constitute the acuR-based 3HP biosensor (Fig. 2A). Increasing concentrations of 3HP in the medium resulted in increasing levels of fluorescence when pcsΔ3 and ach were present, but resulted in no biosensor activation in their absence (Fig. 2B). A 90-fold increase in fluorescence was obtained when the acuR-based biosensor was induced with 10 mM 3HP. This result is a much more dramatic activation than that achieved with the prpR-based biosensor. The induction kinetics of 3HP and the authentic activator acrylate were compared by monitoring biosensor activation in real time. The 3HP-mediated induction only slightly lagged the time course of acrylate induction (Fig. 2C). Fluorescence remained at background levels for >16 h in the absence of pcsΔ3 and ach (Fig. S2).
Fig. 2.

Development of the 3HP biosensor. (A) Helper enzymes convert 3HP into the acuR-binding compound acrylate. (B) The 3HP triggers fluorescence in cells containing the biosensor (blue bars). Higher 3HP results in higher fluorescence. (C) The response of the biosensor to 5 mM 3HP begins immediately and achieves 90% saturation after 8 h (blue line). Induction by 5 mM acrylate is more rapid but achieves the same final fluorescence (green line). Basal induction is low (gray line).
Fig. S2.

Cells without the acuR-based 3HP biosensor helper plasmids do not produce fluorescence in the presence of 3HP. The fluorescent response to the addition of acrylate indicates that the biosensor is functional, but insulated against activation by 5 mM 3HP without the enzymes necessary to convert 3HP to acrylate. The confidence band represents the 95% confidence interval determined by the SEM (n = 3).
We coexpressed the 3HP biosensors with the 3HP production pathway to monitor 3HP production in real time (Fig. 3A). The production pathway consists of the endogenous biosynthesis of malonyl-CoA and the bifunctional enzyme malonyl-CoA reductase (mcr) from the carbon fixation pathway of Chloroflexus aurantiacus (19). Mcr shunts malonyl-CoA away from fatty acid biosynthesis by catalyzing the conversion of malonyl-CoA, first into malonate semialdehyde, and then into 3HP, at the expense of two NADPH. This route from glucose to 3HP has been published, with the authors achieving titers of 60 mg/L with expression of mcr alone (23). Titers were increased to 180 mg/L with overexpression of the ACC complex and pntAB, increasing availability of malonyl-CoA and NADPH, respectively. For our study, we chose to increase the amount of malonyl-CoA available for 3HP production by use of the fatty acid inhibitor cerulenin, rather than through genetic manipulations. Fatty acid biosynthesis is the primary sink for malonyl-CoA and operates at a much higher velocity than heterologously expressed mcr (23). Because cerulenin inhibits the activities of fabB and fabF, increasing its concentration results in lower fatty acid biosynthesis rates and a higher concentration of available malonyl-CoA (24). In each of the 3HP implementations, the biosensor helper enzymes, pcs and pcsΔ3/ach, were constitutively expressed, whereas mcr was expressed conditionally with the addition of IPTG.
Fig. 3.

Formation of 3HP is observed in real-time. (A) The 3HP is produced from glucose by converting malonyl-CoA into malonate semialdehyde and then on to 3HP. Malonyl-CoA reductase (mcr) performs both of these reactions, but competes with fatty acid biosynthesis for malonyl-CoA. (B) The acuR-based 3HP biosensor reports the progress of 3HP production in real-time. The addition of 50 mM glucose (purple line) results in a small increase in fluorescence over background (gray line). Addition of IPTG increases the production of mcr and the activation of the biosensor (blue line). Providing glucose, IPTG, and cerulenin together results in the most rapid biosensor activation (green line). (C) Fluorescence of the acuR-based biosensor after 12 h reveals an approximately fivefold increase in fluorescence in the presence of glucose, IPTG, and cerulenin compared with 3HP production with glucose alone. In the absence of mcr, IPTG and cerulenin have no effect on biosensor activation (gray bars). Error bars and confidence bands represent the 95% confidence interval (n = 3).
The acuR-based 3HP biosensor enables real-time observation of 3HP production (Fig. 3B). In contrast to the prpR-based biosensor (SI Results and Discussion and Fig. S3), the acuR biosensor is not affected by catabolite repression and facilitates observation of 3HP production in the presence of glucose. Mcr was coexpressed with the acuR-based biosensor and fluorescence was observed for 12 h. Cells that were incubated with 50 mM glucose, but without IPTG or cerulenin, produced fluorescence indistinguishable from background levels. Cells incubated with glucose and IPTG showed a significant increase in fluorescence. The most dramatic increase in fluorescence was observed when both IPTG and cerulenin were used. Production of 3HP with glucose, IPTG, and cerulenin resulted in higher rates of GFP expression and end-point fluorescence values than either of the other two conditions. End-point measurements revealed an eightfold increase in fluorescence for mcr+ cells vs. mcr− cells when incubated with glucose, IPTG, and cerulenin (Fig. 3C). Incubation with glucose and IPTG resulted in a twofold increase. Incubation with glucose alone results in only a 20% increase in fluorescence compared with cells lacking mcr.
Fig. S3.

Formation of 3HP is observed in real time. (A) The prpR-based 3HP biosensor reports 3HP production progress in real time. Addition of cerulenin increases the malonyl-CoA pool, providing a boost in 3HP production (purple line). Addition of IPTG increases mcr expression and further increases 3HP production (blue line). Cerulenin and IPTG have no impact on the fluorescent response of cells without mcr (gray and black lines). (B) Fluorescence of the prpR-based biosensor after 12 h. Error bars and confidence bands represent the 95% confidence interval (n = 3).
The acuR-based 3HP biosensor was used to determine optimal concentrations of cerulenin and IPTG for 3HP production (Fig. 4). Although low levels of cerulenin inhibit fatty acid biosynthesis and make additional malonyl-CoA available for 3HP production, higher concentrations result in poor cell viability and reduced 3HP production. To determine the concentration of cerulenin that achieves the correct balance of these opposing effects, we evaluated eight cerulenin concentrations between 0 and 100 μg/mL Similarly, high concentrations of IPTG result in high mcr gene expression. To determine whether maximal or more nuanced mcr expression would achieve optimal 3HP production, we evaluated four levels of IPTG induction. We expected IPTG and cerulenin concentrations to have interacting effects and deemed a combinatorial evaluation of their concentrations necessary. Such an experiment requires 96 samples (n = 3) and would be costly to evaluate by using liquid chromatography/mass spectrometry (LC/MS). Instead, we relied on the acuR-based 3HP biosensor to determine cerulenin and IPTG concentrations that result in the highest fluorescence response (20 μg/mL cerulenin and 1,000 μM IPTG). We then used MS to determined titers for conditions near this point to verify that the biosensor was indeed identifying optimal production conditions.
Fig. 4.

Genetically encoded biosensors were used to identify optimized 3HP production conditions. (A) Eight concentrations of cerulenin and four concentrations of IPTG were combinatorially evaluated in triplicate. Growth-normalized fluorescence of the 96 samples was measured after 24 h (darker shades indicate higher fluorescence). We found that 20 μg/mL cerulenin combined with 1,000 μM IPTG resulted in the greatest biosensor response. (B) The 3HP titer was determined by LC/MS for a range of IPTG concentrations while cerulenin was held constant at 20 μg/mL (C) The 3HP titer was determined by LC/MS for a range of cerulenin concentrations while IPTG was held constant at 1,000 μM. In both cases fluorescence and titer trended together, verifying the optimal concentrations of IPTG and cerulenin determined by fluorescence alone. Error bars represent the 95% confidence interval (n = 3).
The concentrations of IPTG and cerulenin optimized by use of the 3HP biosensor resulted in a 3HP titer of 4.2 g/L (Fig. 5A). Although higher titers have been attained through a two-step conversion from glycerol, our titers are the highest reported for production of 3HP proceeding through E. coli central metabolism (25). These titers were obtained with rich medium in 96-well plates supplemented once with 50 mM glucose at the beginning of fermentation. Production was carried out in BL21 (DE3) transformed with the mcr plasmid under the same culture conditions used for the biosensor experiments. Glucose alone produced no detectable 3HP, whereas the addition of 1 mM IPTG resulted in 1.5 ± 0.2 mg/L. The addition of cerulenin resulted in 7.1 ± 2.5 mg/L, whereas addition of both cerulenin and IPTG to the medium resulted in 4.2 ± 1.2 g/L. We were able to produce 23-fold more 3HP than previously reported for the malonyl-CoA route to 3HP. More importantly, the titers achieved here are high enough to warrant further commercial exploration. A major caveat is that these levels of 3HP production rely on the addition of cerulenin, which is not feasible for scale-up due to cost. Our group has previously shown that multiplexed genome engineering combined with static biosensors can obviate the need for cerulenin by finding mutants with increased malonyl-CoA availability (1). Future work will aim to find a similar mutant for 3HP production using the acuR-based biosensor developed here.
Fig. 5.

Production titers for 3HP and acrylate. (A) The culture conditions evaluated for biosensor activation were also evaluated for 3HP production. Titers were measured by LC/MS and found to correspond to biosensor activation. A concentration of 4.2 g/L 3HP was produced in rich medium supplemented with glucose, IPTG, and cerulenin. (B) Acrylate production from 3HP and glucose was determined by LC/MS. Error bars represent the 95% confidence interval derived from the SEM (n = 3).
Coexpression of pcsΔ3 and ach enables in vivo production of acrylate (Fig. 5B and Fig. S4). Although biologically derived 3HP is used to produce several materials, it is most importantly a precursor to biobased acrylate. Currently, 3HP is isolated from cell culture and chemically converted to acrylate (26). In vivo production of acrylate obviates this step by allowing its direct fermentation. We produced 1.62 ± 0.05 and 0.27 ± 0.04 mM acrylate from 50 and 5 mM 3HP, respectively. Addition of the mcr plasmid resulted in 60 ± 37 μM acrylate produced from glucose in rich medium. These conversion efficiencies are low for commercial acrylate production, but suitable for tracking 3HP production.
Fig. S4.

Representative chromatogram for acrylate measurement by LC/MS. The samples were analyzed on a Thermo q‐Exactive Plus mass spectrometer equipped with a Thermo 3000 Ultimate μHPLC. A resolution of 70,000 was used on the mass spectrometer. A hydrophilic interaction chromatography method was used using an EMD Sequant pHILIC column (150-mm length, 2.1-mm ID, 5-μm particle size) at a flow rate of 100 μL/min. Mobile phase A was 20 mM ammonium carbonate, and B was acetonitrile. The gradient started at 100% B and linearly decreased to 40% B over 20 min. B was then decreased further to 20% over 10 min, and then returned to initial conditions at 100% B over 0.1 min and maintained for the next 11.9 min to equilibrate the column for the following run.
The acuR-based 3HP biosensor will be a better choice than the prpR-based biosensor for most 3HP production enhancement applications. The lack of catabolite repression and dramatically higher dynamic range are key considerations. Substantial work has been done to remove the catabolite repression from prpR, but with little success (27). The fact that acuR senses acrylate, which is not naturally present in cells, whereas prpR senses 2-methlycitrate, is another important consideration. The background levels of 2-methlycitrate in the cells may account for the elevated basal fluorescence and lower dynamic range of the prpR biosensor.
We applied the real-time sensing paradigm to two additional metabolic pathways to demonstrate that real-time observation of product formation is applicable to many biosensor and pathway combinations. The first additional demonstration is the real-time observation of muconate production (SI Results and Discussion and Fig. S5). The second additional demonstration is the real-time observation of glucarate production through the action of three heterologous enzymes.
Fig. S5.

Real-time observation of muconate production. (A) Muconate is produced from glucose by expression of three heterologous enzymes. The committed step of muconate biosynthesis is the conversion of DHS to protocatechuate (PC). (B) Muconate pathway intermediates are added after 1 h. Each late pathway intermediate activates the biosensor within 1 h after addition. Conversion of glucose to muconate occurs much more slowly (pink line). (C) Fluorescence measurements after 6 h reveal that the muconate biosynthesis pathway is necessary for biosensor activation by pathway intermediates (Top). The presence of the pathway enables precursors to trigger the biosensor (Middle). Glucose is the only substrate that achieves lower fluorescence (pink bar; Middle), consistent with its place far upstream in the metabolic pathway. Muconate titers were determined by HPLC (Bottom). Less muconate was produced by DHS (purple bar; Bottom) than the subsequent intermediates (blue, green bars; Bottom). Muconate production from glucose (pink bar; Bottom) was below the limit of quantification by HPLC. Error bars and confidence bands represent the 95% confidence interval (n = 3).
Glucarate is a US Department of Energy “top value added chemical” to produce from biomass, with applications as a renewable replacement for petrochemicals and as a building block for new ultrahydrophilic polymers (15). Several papers describe construction and optimization of the glucarate biosynthesis pathway (28–30). However, attaining high titers remains challenging because of the low stability and activity of myo-inositol oxygenase, making this pathway a prime target for optimization by directed evolution. The ability to monitor glucarate production in individual cells will enable studies combining flow cytometry and directed mutagenesis.
We combined the previously characterized glucarate biosensor (11) with the glucarate biosynthesis pathway comprising IPTG-inducible myo-inositol-1-phosphate synthase (Ino1; Saccharomyces cerevisiae), myo-inositol oxygenase (MIOX; Mus musculus), and uronate dehydrogenase (Udh; Agrobacterium tumefaciens) (Fig. 6A) (11, 29). We anticipated that the glucarate biosensor would produce a fluorescent response proportional to the amount of glucarate produced within the cell. To evaluate this assumption, we maintained identical production conditions (e.g., genetics, medium composition) but varied the exogenously supplemented precursor molecules, with the hypothesis that compounds further along in the biosynthesis pathway (i.e., separated from glucarate by fewer reactions) would result in more rapid glucarate formation. Addition of glucarate itself resulted in the most rapid accumulation of GFP and ultimately the highest amount of fluorescence (Fig. 6B). As expected, we observed a similar fluorescent response to glucarate in biosensor strains with, and without, the biosynthesis pathway. In contrast, none of the other exogenously supplied molecules resulted in a fluorescent response in the biosensor strain lacking the glucarate biosynthesis pathway (Fig. S6). This result indicates that glucarate, and not the precursor molecules, trigger the fluorescent response. In the strain containing both the biosensor and the biosynthesis pathway, addition of glucuronate to the medium resulted in a fluorescent response lagging glucarate by ∼90 min, ultimately achieving an end-point fluorescence that was 80% that of glucarate. This observation is in contrast to the addition of myo-inositol, which resulted in a fluorescence response lagging that of glucuronate by 60 min. Notably, the end-point fluorescence achieved by the addition of myo-inositol is just 20% that of glucuronate addition. Medium supplemented with 50 mM glucose resulted in no fluorescent response within the duration of the experiment (Fig. 5B).
Fig. 6.

Real-time observation of glucarate production. (A) Glucarate is produced from glucose with the expression of three heterologous enzymes of differing activities: Udh has high activity, MIOX has low activity, and Ino1 competes with glycolysis for glucose-6-phosphate. The biosensor monitors the presence of glucarate while ignoring pathway intermediates. (B) Fluorescence is observed over time as pathway intermediates are converted to glucarate. Biosensor activation by glucuronate (blue line) lags behind activation by glucarate (green line). Activation of the biosensor by glucarate or glucuronate occurs more rapidly than activation by either myo-inositol (purple line) or glucose (tan line). This result reflects the relative activities of the enzymes in the glucarate biosynthesis pathway. End-point fluorescence measured after 8 h trends well with the glucarate titers determined by LC/MS. Error bars and confidence bands represent the 95% confidence interval (n = 3).
Fig. S6.

Real-time observation of glucarate production. There is neither biosensor activation nor glucarate production from any of the pathway intermediates in the absence of the glucarate biosynthesis pathway. As expected, addition of glucarate still results in biosensor activation (green line). Error bars and confidence bands represent the 95% confidence interval (n = 3).
The fluorescent output of the glucarate biosensor reflects the properties of the glucarate biosynthesis pathway. The conversion of glucuronate to glucarate is known to be the fastest heterologous reaction in the biosynthesis of glucarate (29). Correspondingly, we see robust biosensor activation when glucuronate is the starting material. The fluorescent response to myo-inositol addition is slow and corroborates the difficulty of using M. musculus MIOX in the catalysis of myo-inositol to glucuronate in E. coli (30). The lack of biosensor response to additional glucose may reflect the fact that glucarate biosynthesis is competing with glycolysis for glucose-6-phosphate. It may take substantial Ino1 activity to create meaningful quantities of myo-inositol. Low myo-inositol production would be further compounded by weak MIOX activity, ultimately yielding low glucarate titers and biosensor-mediated fluorescence. Tuning the endogenous metabolism to balance glycolysis with glucarate production, while screening for fluorescence resulting from glucose supplementation, would be a powerful strategy for finding strains that produce high glucarate titers. A similar approach could be taken in searching for a more effective variant of MIOX from a library of targeted or untargeted mutations.
We have found that the fluorescent response of the biosensor is a good proxy for product titer. The fluorescence observed 8 h after addition of the precursor molecules was measured and compared with the glucarate titers achieved under similar conditions. Glucarate production was observed for every condition tested when the cells contained the biosynthesis pathway. No production was observed without the pathway. Glucarate formation was observed in rich LB medium, even without additional substrate added. Addition of 5 mM glucose did not result in a significant increase in glucarate titer within 8 h and is consistent with the observed lack of a fluorescent response. However, addition of myo-inositol resulted in an elevated glucarate titer, as reflected in the fluorescent response. Plotting titer as a function of fluorescence reaffirms that fluorescence is a good predictor of titer across the four culture conditions evaluated here (R2 = 0.96; Fig. S7).
Fig. S7.
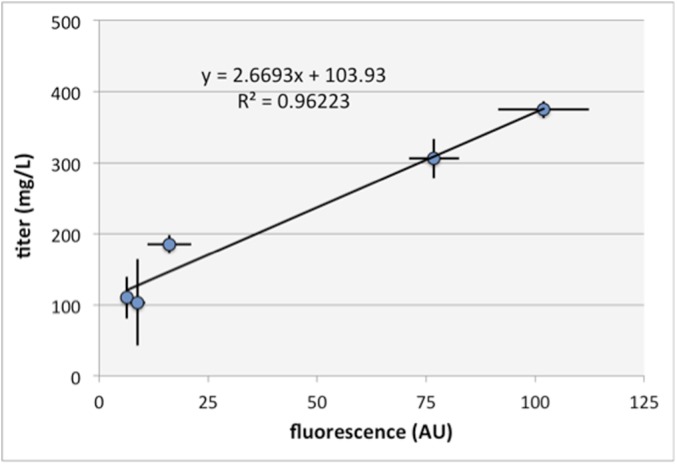
Glucarate titer as a function of biosensor fluorescent response. Higher fluorescent responses indicate higher glucarate production titers. Error bars represent the 95% confidence interval derived from the SEM (n = 3).
As production titers reach higher values, a biosensor’s upper limit of detection becomes important. When a biosensor becomes saturated, higher concentrations of inducer do not produce a greater fluorescent response. Recent work has revealed detection limits for several biosensors important for biomanufacturing (1, 11). Notably, the glucarate biosensor was shown to have an upper limit of detection ∼15 mM, whereas the acrylate biosensor was limited by toxicity beyond 5 mM (11). Previous work has shown that the prpR biosensor is responsive to propionate at extracellular concentrations beyond 50 mM (18). These detection limits exceed the production achieved here; however, higher detection limits can be attained through biosensor manipulation or incorporation of efflux pumps that reduce intracellular inducer concentration (1).
SI Results and Discussion
Characterization of the prpR-Based 3HP Biosensor.
We evaluated the fluorescent response of the prpR-based biosensor to concentrations of 3HP up to 25 mM with, and without, the presence of pcs (Fig. S1B). Indeed, pcs is necessary for a fluorescent response to 3HP. The response increases with increasing concentrations of 3HP, indicating that we have successfully linked the intracellular concentrations of 3HP and 2-methylcitrate. As a result of this linkage, 3HP concentration controls expression of green fluorescent protein (GFP). When induced with 12 mM 3HP, the prpR-based 3HP biosensor produces a fluorescent response 3.1-fold greater than uninduced fluorescence levels. For comparison, the prpR-based propionate biosensor developed in the Keasling laboratory shows 4.5-fold induction under similar conditions (18). The fluorescent response of the prpR-based biosensor to 3HP induction is half-maximal at 5 h and requires ∼8 h to reach 90% induction (Fig. S1C).
Real-Time Observation of 3HP Production with the prpR-Based 3HP Biosensor.
Coexpression of mcr and the prpR-based 3HP biosensor facilitates observation of 3HP production without the need for HPLC or MS (Fig. S3A). Cells containing both the biosensor and mcr resulted in higher fluorescence over time than cells containing just the biosensor. When mcr expression was increased by induction with IPTG, the cells containing mcr showed a higher rate of GFP accumulation, ultimately achieving higher levels of fluorescence. The cells without mcr were unaffected by IPTG induction. When the prpR-based biosensor was used for 3HP observation, it was necessary to produce 3HP by using rich LB medium as the carbon source. Sensitivity of prpR to catabolite repression precluded the use of glucose as the starting material for 3HP production. Even low levels of glucose result in the prpR transcriptional regulator becoming nonresponsive to 2-methylcitrate (27). The uninduced expression of GFP from the prpR biosensor is significant, likely due to basal levels of 2-methylcitrate in the cell. Nonetheless, end-point fluorescence measurements revealed that cells with the capacity to produce 3HP (mcr+) are 20% more fluorescent than cells without mcr (Fig. S3B). When induced, the mcr+ cells are 50% more fluorescent, approaching induction levels observed with 1.5 mM exogenous 3HP.
Muconate Production and Monitoring.
For the last example of real-time observation of metabolite production, we use a muconate biosensor to monitor product formation in a muconate biosynthesis pathway. Muconate is a diacid that can be hydrogenated to adipate, a major platform chemical with global sales of 2 million tons per year (36). Production of muconate from renewable sources such as glucose enables renewable production of adipate products such as nylon and polyurethane. Real-time observation of muconate production is achieved by linking intracellular muconate concentration to GFP expression through a muconate biosensor constructed from benM, a LysR-type transcriptional regulator derived from Acinetobacter baylyi (37). To achieve various muconate production rates for real-time observation, we produced muconate from a range of precursor molecules by implementing the biosynthetic pathway developed by Draths and Frost (16, 38). This pathway uses three heterologous enzymes to convert 3-dehydroshikimate (DHS), an intermediate of aromatic amino acid biosynthesis, to cis,cis-muconate (Fig. S5A). The branch-point from endogenous metabolism is catalyzed by DHS dehydratase (A. baylyi; quiC), resulting in protocatechuate, which in turn is decarboxylated to catechol by protocatechuate decarboxylase (Klebsiella pneumonia; aroY) before oxygenation to muconate by catechol 1,2-dioxygenase (A. baylyi; catA). Combining the nonoptimized muconate biosynthesis pathway with the newly constructed muconate fluorescent biosensor provides an ideal test case for real-time observation of muconate production.
A rapid fluorescence response was observed for the pathway intermediates DHS, protocatechuate, and catechol, whereas a slow response was observed when muconate production was started from glucose (Fig. S5B). No response to any of the intermediates was observed when the muconate biosynthesis pathway was absent. The observation that DHS produces a response as fast as the other pathway intermediates suggests that competition with aromatic amino acid biosynthesis is not limiting the rate of muconate production under these conditions. In contrast, the slow rate of GFP expression resulting from the addition of glucose provides evidence that achieving a sufficient supply of endogenous DHS may be limiting in the genetic background used here. This finding is consistent with the negative feedback that exists at both the transcriptional and allosteric levels in aromatic amino acid biosynthesis (16). The negative feedback is designed to throttle the production of DAHP (the precursor to DHS and consequently muconate) in the presence of aromatic amino acids. Strains optimized for muconate biosynthesis overexpress a feedback-resistant mutant of aroF (the gene encoding DAHP synthase) that is defective in product inhibition. Other genetic modifications aimed at increasing the DHS pool have included knockout of aroE and overexpression of aroB and tktA (16).
Examining end-point fluorescence reveals that the final fluorescence achieved is consistent with the muconate titers measured in the supernatant at that time point (Fig. S5C). Although the end-point fluorescence of the late intermediates is similar, it is dramatically lower for glucose. This finding is reflected in the titers, because muconate production from glucose was lower than our limit of detection at this early time point. In this case, the biosensor was able to respond to lower quantities of muconate than our HPLC method. This result may be attributed to intracellular vs. extracellular sensing; unless muconate is actively transported out of the cell, intracellular concentrations would be expected to rise before supernatant concentrations. A biosensor for protocatechuate was recently developed and used to measure end-point fluorescence resulting from the production of protocatechuate from DHS (34). Using this intermediate biosensor with our muconate biosensor to control GFP and RFP would enable screens aimed at minimizing the concentration of potentially toxic pathway intermediates while maximizing end-product formation.
Conclusions
Through this work, we have developed a framework for tracking the formation of metabolic products in real time using fluorescent biosensors. We demonstrated that the fluorescence achieved by a cell is indicative of its productivity—higher fluorescence indicates higher product titers. Fluorescence as a proxy for product titer not only allows for real-time observation of product formation, but also enables cells to report their own individual progress in producing a chemical. Although we have deployed our biosensors for production optimization in 96-well plates, the greatest potential for biosensors is in pathway evaluation via fluorescence-activated cell sorting (FACS). FACS has been used for the optimization of biosynthetic pathways for more than two decades (31). Historically, the metabolic product must have possessed fluorescent properties or been amenable to fluorescent staining (31–33). In contrast, genetically encoded biosensors have enabled FACS to be used for inconspicuous compounds. These studies have shown that biosensor-based FACS can be successful with maximum dynamic ranges as low as 12-fold, indicating that even poorly operating biosensor systems enable multiplexed phenotype evaluation (34). Implementing FACS with our techniques for real-time monitoring of whole pathway biosynthesis will enable greater versatility for phenotype evaluation in metabolic engineering. Furthermore, we have shown that the breadth of metabolic products sensed is not limited by the set of biosensors on hand—one or more downstream reactions can be used to transform the produced compound into the sensed compound. This strategy is complemented by emerging technologies that enable construction of biosensors for arbitrary compounds (35).
Methods
Detailed methods can be found in SI Methods. A list of plasmids used in this study can be found in Table S1. Production and monitoring of 3HP and acrylate was carried out as follows: DH5α cells containing the plasmids for the 3HP biosensor were transformed with the plasmid pJKR-MCR and incubated with glucose and different combinations of IPTG and cerulenin. End-point measurements were taken after 12 h. The 3HP and acrylate production titers were determined by LC/MS. Overnight cultures were inoculated 1:100 into 1 mL of LB supplemented with 1 mM IPTG, 20 μg/mL cerulenin, and 50 mM glucose in 96-well blocks. Production took place at 37 °C for 16 h. Production of acrylate from glucose was carried out with 50 mM glucose, 1 mM IPTG, and 20 μg/mL cerulenin. All production runs were setup in triplicate. Error bars represent the 95% confidence interval derived from the SEM.
Table S1.
List of plasmids
| Product molecule | Function | Name |
| 3HP | Biosensor | pPro24-GFP |
| Accessory | pJKR-PCS | |
| Acrylate/3HP | Biosensor | pJKR-H-acuR |
| Accessory | pJKR-PCSfrag-ACH | |
| Production | pJKR-MCR | |
| Glucarate | Biosensor | pJKR-H-cdaR |
| Production | pJKR-GA-EXP | |
| Muconate | Biosensor | pJKR-H-benM |
| Production | pMuc1 |
SI Methods
Chemicals and Reagents.
All reagents were obtained from Sigma unless otherwise noted. Antibiotics and IPTG were obtained from Gold Biotechnology. PCR mix was purchased from Kapa Biosystems. The 3-HP was purchased from Toronto Research Chemicals. Cerulenin was purchased from Cayman Chemical and dissolved in ethanol. Acrylic acid was stored at room temperature with 200 ppm monomethyl ether hydroquinone as an inhibitor and diluted immediately before use. All cell culture additives were dissolved in deionized water to achieve appropriate working concentrations.
Strains and Plasmids.
Plasmids were constructed by using Gibson isothermal assembly methods (39) and cloned into DH5α electrocompetent cells purchased from New England Biolabs. Biosynthesis of product molecules was carried out in either BL21 (DE3) or DH5α, as noted in the text. The prpR-based 3HP biosensor was implemented as a two-plasmid system. The first plasmid is pPro24-GFP (Addgene plasmid no. 18880), which expresses GFPuv under the control of the methyl-citrate–responsive transcription factor, prpR, on a pBR322 origin of replication providing β-lactam resistance. The second plasmid (pJKR-PCS) was constructed such that the enzyme propionyl-CoA synthase was under the control of the constitutive promoter proD (40) on a ColA origin of replication providing kanamycin resistance. The acuR-based 3HP biosensor is composed of two plasmids. The first is the previously characterized high-copy acrylate biosensor pJKR-H-acuR (11) (Addgene plasmid no. 62567), which expresses sfGFP under the control of the acrylate responsive transcription factor, acuR, on a pUC origin of replication providing β-lactam resistance. The second is derived from pJKR-PCS such that PCS is truncated between amino acids 1,400 and 1,401. The enzyme acrylyl-CoA hydrolase from A. baylyi was subsequently cloned into the plasmid under the control of the P2 (41) constitutive promoter. The resulting plasmid is designated pJKR-PCSfrag-ACH. The 3HP biosynthesis plasmid, designated pJKR-MCR, was constructed such that mcr from Chloroflexus aurantiacus was expressed by the pLlacO (10) promoter under the control of LacI on a p15a origin of replication with spectinomycin resistance. The glucarate biosensor is the previously characterized plasmid pJKR-H-cdaR (11) (Addgene plasmid no. 62557), which expresses sfGFP under the control of the glucarate responsive transcription factor, cdaR, on a pUC origin of replication providing β-lactam resistance. The glucarate biosynthesis pathway was implemented on a single plasmid, pJKR-GA-EXP, which expresses the genes MIOX, Ino1, and Udh cocistronically from an IPTG-regulated T7 promoter on a p15a origin of replication providing kanamycin resistance. MIOX from M. musculus and Ino1 from S. cerevisiae were synthesized with codons optimized for E. coli expression. Udh was obtained from A. tumefaciens genomic DNA (ATCC no. 33970D-5). The muconate biosensor was constructed with sfGFP under the control of the muconate-responsive transcription factor benM (A. baylyi) on a pUC origin of replication providing spectinomycin resistance. BenM was constitutively expressed with the proB (40) promoter. To provide an option for expression normalization, the RFP mKate2 was constitutively expressed from the P11 (41) promoter. The resulting plasmid is designated pJKR-H-benM. The muconate biosynthesis pathway was constructed as a single plasmid (pMuc1) with codon optimized variants of the biosynthesis genes (described in SI Results and Discussion) expressed cocistronically from an IPTG-inducible T7 promoter on a p15a origin of replication providing β-lactam resistance.
The 3HP Biosensor Characterization.
DH5α cells doubly transformed with plasmids pPro24-GFP and pJKR-PCS, or plasmids pJKR-H-acuR and pJKR-PCSfrag-ACH, were exposed to increasing concentrations of 3HP and monitored for GFP expression. Cells were grown overnight to saturation before being diluted 1:100 into fresh LB medium and incubated at 200 RPM and 37 °C. After 4 h, 150 μL of the log-phase cells were transferred to 96-well plates, and 3HP was added to the appropriate final concentration. Each inoculation and induction was performed in triplicate. Strains lacking the biosensor helper plasmids were included to reveal that the biosensor activation was indeed dependent on the presence of the helper plasmids. In the case of the end-point measurements, fluorescence was measured 16 h after 3HP addition with a Biotek HT plate reader (excitation 485/20, emission 528/20). Time course data were collected over a 16-h period on the same plate reader at 37 °C with fast shaking and 10-min measurement intervals. Fluorescence was normalized by optical density. Fold induction was determined by dividing the fluorescence obtained in the presence of the inducer molecule by the level of fluorescence observed in the absence of any inducer. Error bars represent the 95% confidence interval derived from the SEM. In all cases, the SE was determined by resampling with replacement (n = 5,000).
Optimization of 3HP Production Conditions.
DH5α cells transformed with plasmids pJKR-H-acuR, pJKR-PCSfrag-ACH, and pJKR-MCR were grown to saturation overnight at 37 °C in selective LB medium. The cells were diluted 1:100 in selective LB medium and cultured for 4 h before being transferred to 96-well deep well blocks (working volume 1 mL). IPTG and cerulenin were added such that each combination of concentrations for IPTG and cerulenin were evaluated in triplicate. The cerulenin concentrations evaluated were 0, 1, 2, 5, 10, 20, 50, and 100 μg/mL The IPTG concentrations evaluated were 0, 4, 20, and 1,000 μM. The deep well block was incubated humidified at 37 °C and 900 RPM for 24 h. A total of 150 μL was then transferred to a microtiter plate, and fluorescence and optical density were measured in the Biotek HT plate reader as described. A total of 300 μL of the cell suspension was prepared for analysis by LC/MS as described below.
The 3HP/Acrylate Production and Monitoring.
DH5α cells containing the plasmids for the prpR- and acuR-based 3HP biosensors were transformed with the plasmid pJKR-MCR. These production strains were grown up overnight, back-diluted 1:100 into fresh LB medium, and incubated at 200 RPM and 37 °C. After 4 h, 150 μL of the log-phase cells were transferred to 96-well plates and exposed to 3HP production conditions. The prpR-based biosensor production strain was incubated with and without 1mM IPTG and 20 μg/mL cerulenin in LB. The acuR-based biosensor production strain was incubated with 50 mM glucose and different combinations of 1 mM IPTG and 20 μg/mL cerulenin. Growth-normalized fluorescence was observed in the Biotek HT plate reader as described above. End-point measurements were taken after 12 h. The 3HP production titers were determined by LC/MS. The strain used for 3HP titer measurements only contained the production plasmid pJKR-MCR. Overnight cultures were inoculated 1:100 into 1 mL of LB supplemented with 1 mM IPTG, 20 μg/mL cerulenin, and 50mM glucose in 96-well blocks. Production took place at 900 RPM and 37 °C for 16 h before supernatants were isolated and filtered at 0.2 μm for LC/MS. Samples were prepared for acrylate analysis in an identical manner with DH5-α as the strain background. Production of acrylate from glucose was carried out with 50 mM glucose, 1 mM IPTG, and 20 μg/mL cerulenin. Acrylate was measured on a Thermo q-Exactive mass spectrometer equipped with a Thermo 3000 Ultimate μHPLC. All production runs were set up in triplicate. Error bars represent the 95% confidence interval derived from the SEM.
Glucarate Production and Monitoring.
Glucarate production monitoring was carried out in BL21 (DE3) cells doubly transformed with pJKR-H-cdaR and pJKR-GA-EXP. BL21 (DE3) transformed with pJKR-H-cdaR alone was used as a control. Overnight cultures back-diluted 1:100 into Davis medium supplemented with 5 g/L glucose. After 4 h incubating at 200 RPM and 37 °C, 150 μL of the log-phase cells were transferred to 96-well plates and exposed to 1 mM IPTG with the pathway intermediates noted in the text. Normalized fluorescence was observed for 8 h after addition of the pathway intermediates as described above. End-point measurements were taken after 8 h. Glucarate production for titer measurement was carried out in BL21 (DE3) transformed with pJKR-GA-EXP. An overnight culture was inoculated 1:100 into 1 mL of LB supplemented with 1 mM IPTG and the specified concentration of pathway intermediate. Production took place in 96-well blocks at 900 RPM and 37 °C for 8 h before supernatants were isolated and 0.2-μm filtered for LC/MS. All production runs were set up in triplicate. Error bars represent the 95% confidence interval derived from the SEM.
Muconate Production and Monitoring.
Muconate production monitoring was carried out in BL21 (DE3) cells doubly transformed with pJKR-H-benM and the muconate production plasmid pMuc1. Overnight cultures were grown overnight before being diluted 1:100 into LB and incubated at 200 RPM and 37 °C. After 4 h, 150 μL of the log-phase cells were transferred to 96-well plates and monitored in the plate reader. After 1 h, the specified concentration of pathway intermediate was added in triplicate, and fluorescence monitoring was resumed. End-point measurements were made 5 h after the addition of intermediates. Strains transformed with the muconate production plasmid alone were used to determine product titers. An overnight culture was inoculated 1:100 into 1 mL of LB supplemented with the specified concentration of pathway intermediate. Production took place in 96-well blocks at 900 RPM and 37 °C for 5 h. The quantity of muconate in the supernatant was determined by absorbance at 210 nm on an Agilent HPLC equipped with an Aminex HPX-87H column (Bio-Rad) operated in isocratic mode with 0.1% phosphoric acid. All production runs were set up in triplicate. Error bars represent the 95% confidence interval derived from the SEM.
Acknowledgments
We thank Christopher D. Guzman for technical assistance. This work was supported by National Science Foundation Graduate Research Fellowship Program (to J.K.R.) and US Department of Energy Grant DEFG02-02ER63445 (to G.M.C.).
Footnotes
The authors declare no conflict of interest.
This article contains supporting information online at www.pnas.org/lookup/suppl/doi:10.1073/pnas.1600375113/-/DCSupplemental.
References
- 1.Raman S, Rogers JK, Taylor ND, Church GM. Evolution-guided optimization of biosynthetic pathways. Proc Natl Acad Sci USA. 2014;111(50):17803–17808. doi: 10.1073/pnas.1409523111. [DOI] [PMC free article] [PubMed] [Google Scholar]
- 2.Wang HH, et al. Programming cells by multiplex genome engineering and accelerated evolution. Nature. 2009;460(7257):894–898. doi: 10.1038/nature08187. [DOI] [PMC free article] [PubMed] [Google Scholar]
- 3.Dietrich JA, McKee AE, Keasling JD. High-throughput metabolic engineering: Advances in small-molecule screening and selection. Annu Rev Biochem. 2010;79:563–590. doi: 10.1146/annurev-biochem-062608-095938. [DOI] [PubMed] [Google Scholar]
- 4.Yang J, et al. Synthetic RNA devices to expedite the evolution of metabolite-producing microbes. Nat Commun. 2013;4:1413. doi: 10.1038/ncomms2404. [DOI] [PubMed] [Google Scholar]
- 5.Binder S, et al. A high-throughput approach to identify genomic variants of bacterial metabolite producers at the single-cell level. Genome Biol. 2012;13(5):R40. doi: 10.1186/gb-2012-13-5-r40. [DOI] [PMC free article] [PubMed] [Google Scholar]
- 6.Dietrich JA, Shis DL, Alikhani A, Keasling JD. Transcription factor-based screens and synthetic selections for microbial small-molecule biosynthesis. ACS Synth Biol. 2013;2(1):47–58. doi: 10.1021/sb300091d. [DOI] [PMC free article] [PubMed] [Google Scholar]
- 7.Tang SY, et al. Screening for enhanced triacetic acid lactone production by recombinant Escherichia coli expressing a designed triacetic acid lactone reporter. J Am Chem Soc. 2013;135(27):10099–10103. doi: 10.1021/ja402654z. [DOI] [PubMed] [Google Scholar]
- 8.Santoro SW, Schultz PG. Directed evolution of the site specificity of Cre recombinase. Proc Natl Acad Sci USA. 2002;99(7):4185–4190. doi: 10.1073/pnas.022039799. [DOI] [PMC free article] [PubMed] [Google Scholar]
- 9.Santoro SW, Wang L, Herberich B, King DS, Schultz PG. An efficient system for the evolution of aminoacyl-tRNA synthetase specificity. Nat Biotechnol. 2002;20(10):1044–1048. doi: 10.1038/nbt742. [DOI] [PubMed] [Google Scholar]
- 10.Lutz R, Bujard H. Independent and tight regulation of transcriptional units in Escherichia coli via the LacR/O, the TetR/O and AraC/I1-I2 regulatory elements. Nucleic Acids Res. 1997;25(6):1203–1210. doi: 10.1093/nar/25.6.1203. [DOI] [PMC free article] [PubMed] [Google Scholar]
- 11.Rogers JK, et al. Synthetic biosensors for precise gene control and real-time monitoring of metabolites. Nucleic Acids Res. 2015;43(15):7648–7660. doi: 10.1093/nar/gkv616. [DOI] [PMC free article] [PubMed] [Google Scholar]
- 12.Eggeling L, Bott M, Marienhagen J. Novel screening methods--biosensors. Curr Opin Biotechnol. 2015;35:30–36. doi: 10.1016/j.copbio.2014.12.021. [DOI] [PubMed] [Google Scholar]
- 13.Mustafi N, Grünberger A, Kohlheyer D, Bott M, Frunzke J. The development and application of a single-cell biosensor for the detection of l-methionine and branched-chain amino acids. Metab Eng. 2012;14(4):449–457. doi: 10.1016/j.ymben.2012.02.002. [DOI] [PubMed] [Google Scholar]
- 14.Kumar V, Ashok S, Park S. Recent advances in biological production of 3-hydroxypropionic acid. Biotechnol Adv. 2013;31(6):945–961. doi: 10.1016/j.biotechadv.2013.02.008. [DOI] [PubMed] [Google Scholar]
- 15.Werpy T, Petersen G. Top Value Added Chemicals from Biomass Volume I—Results of Screening for Potential Candidates from Sugars and Synthesis Gas. US Dept of Energy; Oak Ridge, TN: 2004. [Google Scholar]
- 16.Niu W, Draths KM, Frost JW. Benzene-free synthesis of adipic acid. Biotechnol Prog. 2002;18(2):201–211. doi: 10.1021/bp010179x. [DOI] [PubMed] [Google Scholar]
- 17.Palacios S, Escalante-Semerena JC. 2-Methylcitrate-dependent activation of the propionate catabolic operon (prpBCDE) of Salmonella enterica by the PrpR protein. Microbiology. 2004;150(Pt 11):3877–3887. doi: 10.1099/mic.0.27299-0. [DOI] [PubMed] [Google Scholar]
- 18.Lee SK, Keasling JD. A propionate-inducible expression system for enteric bacteria. Appl Environ Microbiol. 2005;71(11):6856–6862. doi: 10.1128/AEM.71.11.6856-6862.2005. [DOI] [PMC free article] [PubMed] [Google Scholar]
- 19.Mattozzi Md, Ziesack M, Voges MJ, Silver PA, Way JC. Expression of the sub-pathways of the Chloroflexus aurantiacus 3-hydroxypropionate carbon fixation bicycle in E. coli: Toward horizontal transfer of autotrophic growth. Metab Eng. 2013;16:130–139. doi: 10.1016/j.ymben.2013.01.005. [DOI] [PubMed] [Google Scholar]
- 20.Sullivan MJ, et al. Unusual regulation of a leaderless operon involved in the catabolism of dimethylsulfoniopropionate in Rhodobacter sphaeroides. PLoS One. 2011;6(1):e15972. doi: 10.1371/journal.pone.0015972. [DOI] [PMC free article] [PubMed] [Google Scholar]
- 21.Valle F, Agard NJ, Noriega C. 2013. US Patent Appl PCT/US2012/056639.
- 22.Alber BE, Fuchs G. Propionyl-coenzyme A synthase from Chloroflexus aurantiacus, a key enzyme of the 3-hydroxypropionate cycle for autotrophic CO2 fixation. J Biol Chem. 2002;277(14):12137–12143. doi: 10.1074/jbc.M110802200. [DOI] [PubMed] [Google Scholar]
- 23.Rathnasingh C, et al. Production of 3-hydroxypropionic acid via malonyl-CoA pathway using recombinant Escherichia coli strains. J Biotechnol. 2012;157(4):633–640. doi: 10.1016/j.jbiotec.2011.06.008. [DOI] [PubMed] [Google Scholar]
- 24.Heath RJ, Rock CO. Regulation of malonyl-CoA metabolism by acyl-acyl carrier protein and beta-ketoacyl-acyl carrier protein synthases in Escherichia coli. J Biol Chem. 1995;270(26):15531–15538. doi: 10.1074/jbc.270.26.15531. [DOI] [PubMed] [Google Scholar]
- 25.Valdehuesa KN, et al. Recent advances in the metabolic engineering of microorganisms for the production of 3-hydroxypropionic acid as C3 platform chemical. Appl Microbiol Biotechnol. 2013;97(8):3309–3321. doi: 10.1007/s00253-013-4802-4. [DOI] [PubMed] [Google Scholar]
- 26.Decoster D, Hoyt S, Roach S. 2013. US Patent Appl PCT/US2013/046889.
- 27.Lee SK, Newman JD, Keasling JD. Catabolite repression of the propionate catabolic genes in Escherichia coli and Salmonella enterica: Evidence for involvement of the cyclic AMP receptor protein. J Bacteriol. 2005;187(8):2793–2800. doi: 10.1128/JB.187.8.2793-2800.2005. [DOI] [PMC free article] [PubMed] [Google Scholar]
- 28.Moon TS, Dueber JE, Shiue E, Prather KL. Use of modular, synthetic scaffolds for improved production of glucaric acid in engineered E. coli. Metab Eng. 2010;12(3):298–305. doi: 10.1016/j.ymben.2010.01.003. [DOI] [PubMed] [Google Scholar]
- 29.Moon TS, Yoon SH, Lanza AM, Roy-Mayhew JD, Prather KL. Production of glucaric acid from a synthetic pathway in recombinant Escherichia coli. Appl Environ Microbiol. 2009;75(3):589–595. doi: 10.1128/AEM.00973-08. [DOI] [PMC free article] [PubMed] [Google Scholar]
- 30.Shiue E, Prather KL. Improving D-glucaric acid production from myo-inositol in E. coli by increasing MIOX stability and myo-inositol transport. Metab Eng. 2014;22:22–31. doi: 10.1016/j.ymben.2013.12.002. [DOI] [PubMed] [Google Scholar]
- 31.Azuma T, Harrison GI, Demain AL. Isolation of a gramicidin S hyperproducing strain of Bacillus brevis by use of a fluorescence activated cell sorting system. Appl Microbiol Biotechnol. 1992;38(2):173–178. doi: 10.1007/BF00174463. [DOI] [PubMed] [Google Scholar]
- 32.Tyo KE, Zhou H, Stephanopoulos GN. High-throughput screen for poly-3-hydroxybutyrate in Escherichia coli and Synechocystis sp. strain PCC6803. Appl Environ Microbiol. 2006;72(5):3412–3417. doi: 10.1128/AEM.72.5.3412-3417.2006. [DOI] [PMC free article] [PubMed] [Google Scholar]
- 33.Ukibe K, Katsuragi T, Tani Y, Takagi H. Efficient screening for astaxanthin-overproducing mutants of the yeast Xanthophyllomyces dendrorhous by flow cytometry. FEMS Microbiol Lett. 2008;286(2):241–248. doi: 10.1111/j.1574-6968.2008.01278.x. [DOI] [PubMed] [Google Scholar]
- 34.Jha RK, Kern TL, Fox DT, M Strauss CE. Engineering an Acinetobacter regulon for biosensing and high-throughput enzyme screening in E. coli via flow cytometry. Nucleic Acids Res. 2014;42(12):8150–8160. doi: 10.1093/nar/gku444. [DOI] [PMC free article] [PubMed] [Google Scholar]
- 35.Raman S, Taylor N, Genuth N, Fields S, Church GM. Engineering allostery. Trends Genet. 2014;30(12):521–528. doi: 10.1016/j.tig.2014.09.004. [DOI] [PMC free article] [PubMed] [Google Scholar]
- 36.Weber C, et al. Biosynthesis of cis,cis-muconic acid and its aromatic precursors, catechol and protocatechuic acid, from renewable feedstocks by Saccharomyces cerevisiae. Appl Environ Microbiol. 2012;78(23):8421–8430. doi: 10.1128/AEM.01983-12. [DOI] [PMC free article] [PubMed] [Google Scholar]
- 37.Craven SH, et al. Inducer responses of BenM, a LysR-type transcriptional regulator from Acinetobacter baylyi ADP1. Mol Microbiol. 2009;72(4):881–894. doi: 10.1111/j.1365-2958.2009.06686.x. [DOI] [PubMed] [Google Scholar]
- 38.Draths KM, Frost JW. Environmentally compatible synthesis of adipic acid from D-glucose. J Am Chem Soc. 1994;116(1):399–400. [Google Scholar]
- 39.Gibson DG, et al. Enzymatic assembly of DNA molecules up to several hundred kilobases. Nat Methods. 2009;6(5):343–345. doi: 10.1038/nmeth.1318. [DOI] [PubMed] [Google Scholar]
- 40.Davis JH, Rubin AJ, Sauer RT. Design, construction and characterization of a set of insulated bacterial promoters. Nucleic Acids Res. 2011;39(3):1131–1141. doi: 10.1093/nar/gkq810. [DOI] [PMC free article] [PubMed] [Google Scholar]
- 41.Mutalik VK, et al. Precise and reliable gene expression via standard transcription and translation initiation elements. Nat Methods. 2013;10(4):354–360. doi: 10.1038/nmeth.2404. [DOI] [PubMed] [Google Scholar]