

Abstract
Tumor suppressors are mostly defined by inactivating mutations in tumors, yet little is known about their epigenetic features in normal cells. Through integrative analysis of 1,134 genome-wide epigenetic profiles, mutations from >8,200 tumor-normal pairs, and our experimental data from clinical samples, we discovered broad H3K4me3 (wider than 4 kb) as the first epigenetic signature for tumor suppressors in normal cells. Broad H3K4me3 is associated with increased transcription elongation and enhancer activity together leading to exceptionally high gene expression, and is distinct from other broad epigenetic features, such as super-enhancers. Broad H3K4me3 conserved across normal cells may represent pan-cancer tumor suppressors, such as P53 and PTEN, whereas cell-type-specific broad H3K4me3 may indicate cell-identity genes and cell-type-specific tumor suppressors. Furthermore, widespread shortening of broad H3K4me3 in cancers is associated with repression of tumor suppressors. Together, the broad H3K4me3 epigenetic signature provides mutation-independent information for the discovery and characterization of novel tumor suppressors.
INTRODUCTION
Most cancers are results of a small number of somatic driver mutations that either activate growth-promoting oncogenes or repress growth-constraining tumor suppressor genes. Recent sequencing efforts1 of thousands of tumors and matched normal tissues have identified recurrent and distinct somatic mutational patterns in those cancer drivers, namely residue-specific activating mutations in oncogenes and discrete inactivating mutations in tumor suppressors2,3. The remaining large number of somatic mutations are passengers possibly due to genome instability, thus may not contribute to cancer development. Meanwhile, recent studies have proposed the mechanisms underlying cancer somatic mutations, including DNA replication timing4, chromatin structure5 and gene expression level6. While those epigenetic mechanisms can explain the majority of somatic mutations and thus facilitate the detection of significantly mutated genes, they fail to distinguish tumor suppressors from oncogenes. It is unclear whether there are epigenetic features in normal somatic cells that are explicitly associated with tumor suppressors or oncogenes.
Among all the epigenetic features, trimethylation of histone H3 on lysine 4 (H3K4me3) has been widely recognized as an active promoter mark7. H3K4me3 may regulate preinitiation complex formation and gene activation by interacting with the TFIID complex8. It was reported that over 80% of genes with promoter H3K4me3 were transcribed9. Other functions of H3K4me3 include pre-mRNA splicing10, recombination11, DNA repair12 and enhancers13. However, the role of H3K4me3 in cancer development remains poorly understood.
The extension of an epigenetic domain along the genome is emerging as a new concept in the control of cancer development. For example, in contrast to typical enhancers that are normally 200 to 500 bp long13, recent studies revealed super-enhancers that are large clusters of enhancers spanning up to 50 kb14, which are bound by cell-type-specific master transcription factors to specifically drive expression of cell-identity genes. Consistently, super-enhancers were found at key oncogenes in many cancer types15. Therefore, inhibiting chromatin regulators, such as BRD4, leads to selective inhibition of key oncogenes, such as MYC, by disruption of super-enhancers16.
In this study, to gain insights into epigenetic signatures of cancer drivers, we conducted an integrative analysis of 1,134 genome-wide epigenetic profiles (Table S1) and cancer somatic mutations from >8,200 tumor-normal pairs. We discovered an exceptionally broad, low-density and conservative H3K4me3 epigenetic signature that is explicitly enriched in tumor suppressors, but not in oncogenes or house keeping genes. We also experimentally validated our findings in human primary tumor-normal pairs and cell models.
RESULTS
Exceptionally broad H3K4me3 signature on tumor suppressor
We recently observed that the ChIP-seq signal of H3K4me3, a well-known active promoter epigenetic mark, can span up to 10 kb with low density from promoter to gene body on several well-known tumor suppressors, such as IKZF117–19 and PTEN20,21 in human CD4+ T cells22 (Fig 1a). In contrast, H3K4me3 has sharp ChIP-seq peaks of ~1 kb long on other active genes, such as housekeeping genes COPB223 and CWC2223 (Fig 1a). This observation motivated us to perform a systematic analysis of the height and width (Fig 1b) of every H3K4me3 promoter peak. We observed a subset of low-density H3K4me3 peaks that are exceptionally wide (defined as broad peaks thereafter) and another subset of high-density H3K4me3 peaks that are relatively narrow (defined as sharp peaks thereafter) (Fig 1c). Interestingly, there is no overlap between the broad and sharp peaks, suggesting potential distinct mechanisms for those two groups of peaks. To conduct a quantitative comparison between broad and sharp H3K4me3 peaks, we retrieved 500 broad H3K4me3 peaks wider than 4kb, which is 5 fold wider than the median width of all peaks, 500 sharp peaks with the top peak height, and 500 random peaks as control (Fig 1d). The broad H3K4me3 peaks have skewed distribution around transcription start site (TSS), spanning ~ −500 bp to +3,500 bp, whereas sharp and control H3K4me3 peaks are enriched in ~1 kb symmetric region around TSS (Fig 1e). As expected, the signal density of broad H3K4me3 is significantly lower than that of sharp H3K4me3 but slightly higher than that of control H3K4me3 peaks. A composite plot of normalized H3K4me3 ChIP-Seq and input samples indicates that the difference between broad and sharp peaks is not due to variation in genome background (Fig S1).
Figure 1. Broad H3K4me3 in human CD4+ T cells marks tumor suppressors and cell identity genes.
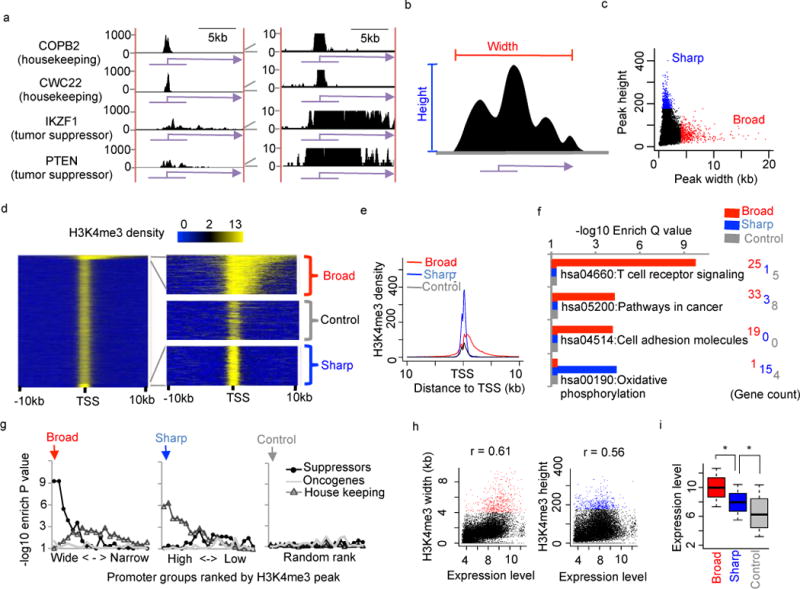
(a) H3K4me3 density at housekeeping genes COPB2 and CWC22 and tumor suppressors IKZF1 and PTEN. (b) Definition of H3K4me3 peak height and width. (c) H3K4me3 peak height (y-axis) plotted against width (x-axis). Blue and red dots indicate top 500 sharp and broad H3K4me3 peaks. (d) Heatmap of promoter H3K4me3. Each row represents a promoter region from −10kb to +10kb. The left panel contains all promoters. The right 3 panels are enlarged view of 500 broad (top), sharp (bottom), and random control H3K4me3 peaks (middle). Average density plots around TSS (e) and KEGG pathway enrichment (f) for the same broad, sharp and random control H3K4me3 peaks as in (d). (g) Enrichment P values (y-axis) of tumor suppressors, oncogenes, and housekeeping genes in different promoter groups (x-axis) ranked by H3k4me3 peaks from wide to narrow (left), high to low (middle), or randomly (right). Each group contains 500 genes. The left most groups in each panel contain the broad, sharp and random control H3K4me3 peaks. Enrichment P value was calculated using Fisher’s exact test. (h) H3K4me3 peak widths (left) and heights (right) plotted against gene expression levels. Red and blue dots indicate broad and sharp H3K4me3 peaks, respectively. (i) Boxplot showing gene expression levels associated with H3K4me3 peaks. The bottom, middle, and top lines indicate the first, second, and third quartiles, with whisker range defined as 0.5. *P < 1×10⁻²⁰ by KS test.
KEGG pathway analysis was used to characterize enriched functions in the 3 groups of H3K4me3 peaks. T cell receptor signaling (hsa04660) is explicitly enriched in broad H3K4me3 group (Q value: 1.68×10⁻¹⁰), but not in sharp or control groups (Fig 1f). An excellent example is the gene encoding T Cell surface marker CD4 that contains an H3K4me3 peak as wide as 5kb (Fig 5e). This observation suggests that broad H3K4me3 might be associated with genes maintaining cell identity. Another interesting term, Pathways in cancer (hsa05200), a collection of well-curated signaling networks involved in cancer development, is also uniquely enriched in broad H3K4me3 with a significant Q value of 5.67×10⁻⁵ (Fig 1f). In contrast, oxidative phosphorylation (hsa00190) housekeeping genes24 are uniquely enriched in sharp H3K4me3 (Fig 1f).
Figure 5. Broad H3K4me3 at tumor suppressors is conserved across ENCODE normal cell types.
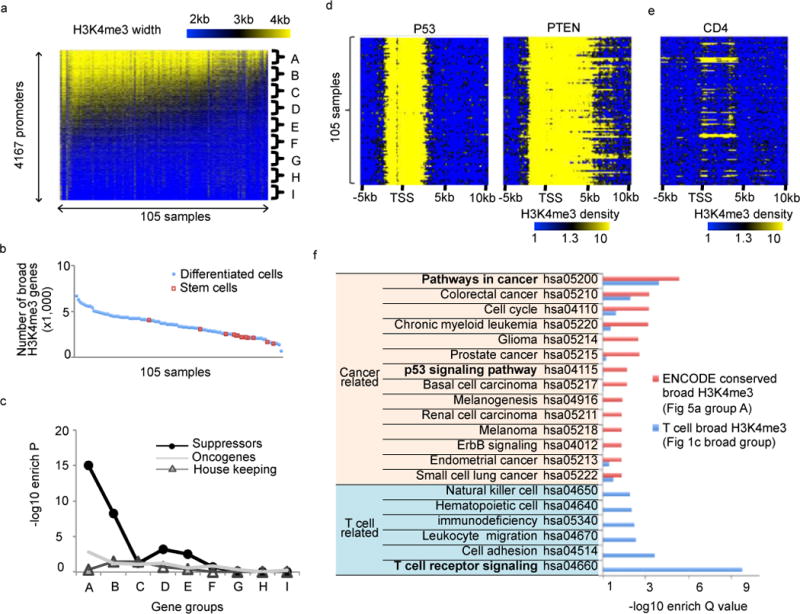
(a) Heatmap for H3K4me3 peak widths of 4,167 promoters (rows) across 105 ENCODE normal samples (columns). Promoters were further divided into 9 groups (A–I) based on the conservation level of H3K4me3 peak width (% samples with H3K4me3 peak longer than 4kb) from high to low. (b) Number (y-axis) of genes with H3K4me3 peak wider than 4kb in each sample (x-axis). (c) The enrichment levels of 9 promoter groups as indicted in (a) in tumor suppressors, oncogenes, and housekeeping genes. Enrichment P value was calculated based on Fisher’s exact test. (d) H3K4me3 density on two well-known tumor suppressor genes P53 (left) and PTEN (right) across 105 ENCODE normal samples. Each row is the H3K4me3 density in the region from 5kb upstream to 10kb downstream of TSS in one sample. (e) H3K4me3 density on cell-identity gene CD4 across 105 ENCODE normal samples. (f) KEGG pathways enrichment analysis of promoters associated with conserved broad H3K4me3 from ENCODE samples and broad H3K4me3 from human CD4+ T cells alone.
To further confirm the association between broad H3K4me3 and cancer development, we collected the top 500 high-confidence tumor suppressors and oncogenes that were defined based on distinct somatic mutational patterns from genome sequencing of >8,200 tumor-normal pairs2. We also used 500 randomly selected house-keeping genes as control23. We repeated the same enrichment analysis on different H3K4me3 groups, with 500 peaks in each group, ranking from wide to narrow (left), high to low (middle), or randomly (right) (Fig 1g). Surprisingly, the H3K4me3 group with the broadest peaks is only enriched in tumor suppressors but not in oncogenes or housekeeping genes. And the enrichment levels gradually diminish with the decrease of peak width. We further confirmed that this enrichment preference towards tumor suppressors is not due to bias in our driver gene collection, since both tumor suppressors and oncogenes show similar significant enrichment with KEGG Pathways in cancer (Fig S2). In addition, H3K4me3 usually has broader peaks on tumor suppressors than on oncogenes or other genes within the same KEGG pathways (Fig S17). Therefore, the enrichment of functional pathways, such as “T cell receptor signaling” (Fig 1F, S17a), in genes associated with broad H3K4me3 is mainly contributed by tumor suppressors within the same pathway. Finally, broad H3K4me3 peaks, although have low signal intensity (Fig 1e), show exceptionally higher expression levels than sharp or control H3K4me3 (Fig 1h, 1i and S24). Together, we conclude that broad H3K4me3 in CD4+ T cell is strongly and uniquely associated with cell identity genes, tumor suppressors and highly expressed genes.
Broad H3K4me3 is not associated with alternative TSS
An obvious question is whether broad H3K4me3 implies alternative TSS and induces cryptic transcription25. To address this, we collected a pool of 244,524 unique TSSs from gene models such as RefSeq, UCSC known gene, Ensembl and GENCODE. We observed no difference in TSS density among genes associated with broad, sharp or control H3K4me3 (Fig S3a). To further confirm this result, we repeated the same analysis using CAGE (Cap Analysis Gene Expression) data, i.e. direct sequencing of TSS, in CD4+ T cells, but we still observed little difference among 3 groups of H3K4me3 peaks (Fig S3b). Together, we conclude that broad H3K4me3 is not associated with alternative TSS.
Many promoter epigenetic marks coincide with broad H3K4me3
To understand the possible mechanisms underlying broad H3K4me3, we mapped ChIP-seq data of 42 distinct epigenetic marks in CD4+ T cells to the same 3 groups of H3K4me3 peaks. In total 28 epigenetic marks are enriched around promoters, whereas 2 marks show depletion (Fig 2a, S4). The remaining 12 marks have weak or complicated patterns thus were excluded from further analysis (Fig S5). 27 out of 28 promoter-enriched epigenetic marks, except for histone variant H2A.Z, have similar wide peaks on genes with broad H3K4me3, and similar sharp peaks on genes with sharp or control H3K4me3. Spearman correlation analysis also indicated the strong similarity between most of those epigenetic marks and broad H3K4me3 peaks (Fig S6). The co-occurrence of broad or sharp epigenetic marks is frequently observed on individual genes. For example, the tumor suppressor IKZF1 is strongly associated with broad peaks of promoter epigenetic marks, whereas the housekeeping gene COPB2 has all sharp peaks (Fig 2b). This observation suggests the extension of almost all promoter epigenetic marks on a small group of genes, with H3K4me3 being a suitable surrogate marker.
Figure 2. Most promoter epigenetic marks coincide with broad H3K4me3 in human CD4+ T cells.
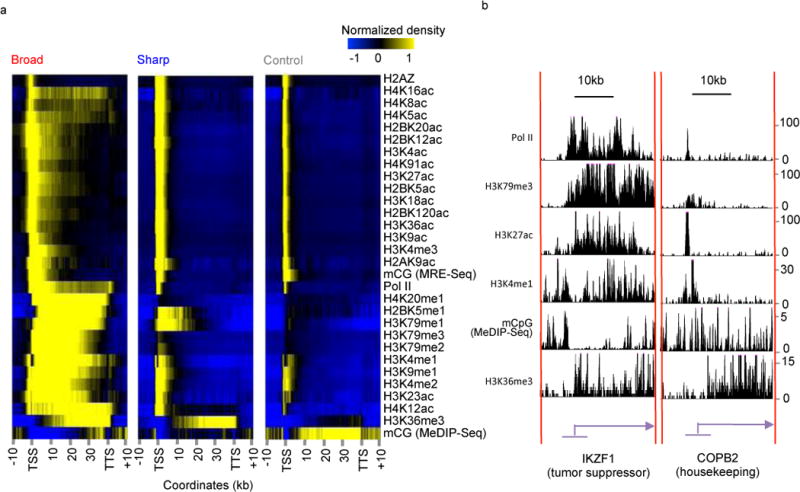
(a) Heatmap showing average density of 30 epigenetic marks at promoters associated with broad (left), sharp (middle) and random control (right) H3K4me3 peaks. Columns represent the region from 10 kb upstream of TSS to 10 kb downstream of TTS. All genes are scaled to be 40 kb long. Each row represents one epigenetic mark. (b) Genome browser tracks of 6 selected epigenetic marks at tumor suppressor TGFBR2 (left) and housekeeping gene ASL2 (right).
Broad H3K4me3 reveals increased transcription elongation
Interestingly, at genes with broad H3K4me3, the Pol II ChIP-Seq signal is not only enriched at the promoter and gene body, but also shows a clear peak at the 3′ end (Fig 3a left). This pattern has been reported to be specific for genes undergoing active transcription elongation26,27. Consistently, the elongation histone mark H3K79me2, a mark beneficial to early phase of productive elongation and correlated strongly with elongation rates28,29, shows strong peaks at genes with broad H3K4me3 (Fig 3a right).
Figure 3. Broad H3K4me3 is associated with increased transcription elongation.
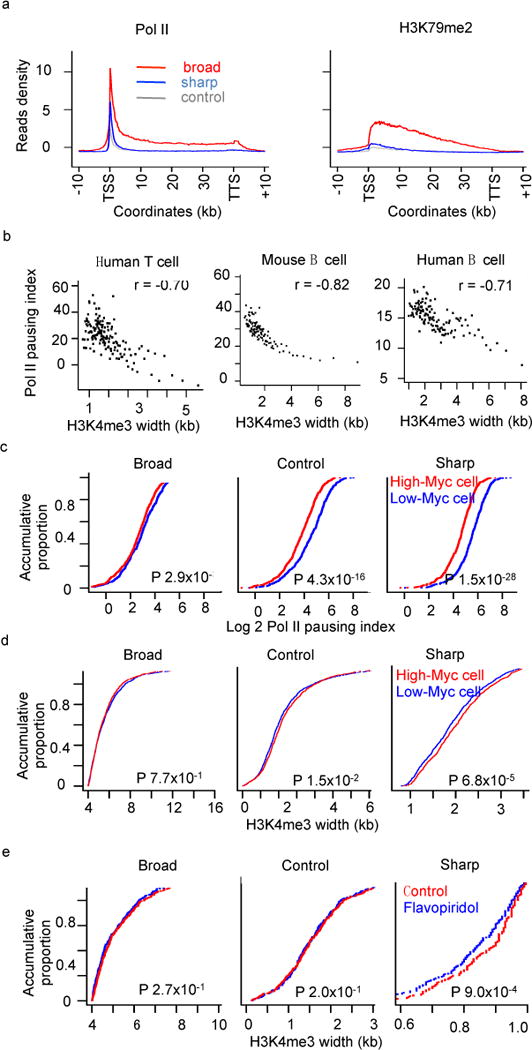
(a) Average density plots of Pol II and H3K79me2 at genes associated with broad, sharp and random H3K4me3 peaks. (b) Pol II pausing index plotted against promoter H3K4me3 width in human T cell (left), mouse B cells (middle) and human B cell (right). Spearman correlation coefficients are indicated on top of each panel. Expressed genes whose promoter Pol II ChIP-seq intensity 50% higher than the mean value of all genes were used for the analysis. Genes were binned into groups (50 genes per group). (c) Accumulative plots of gene proportion against Pol II pausing index in mouse B cells with high (red) or low (blue) c-Myc expression. (d) Accumulative plots of gene proportion against H3K4me3 peak width in human B cells with high (red) or low (blue) c-Myc expression. (e) Accumulative plots of gene proportion against H3K4me3 peak width in cells under normal condition (red) or flavopiridol treatment (blue). P values were calculated based on K-S test.
We used a well-established Pol II pausing index (or traveling ratio) to quantify the transcriptional elongation. Pausing index is the promoter to gene body ratio of Pol II ChIP-seq density26,30, thus a larger pausing index indicates more poised Pol II and less elongation. As expected, the Pol II pausing index shows a strong negative correlation with promoter H3K4me3 width (Spearman coefficient: −0.70) in human CD4+ T cell (Fig 3b). Furthermore, this strong negative correlation is highly reproducible in 14 additional normal cell types (Fig 3b and Fig S7). Those observations are consistent with the association between broad H3K4me3 and increased transcription elongation.
To gain insights into the cause-and-effect relationship, we measured H3K4me3 levels after manipulating the elongation machinery. The oncogene c-Myc has been reported to promote Pol II pausing release and hence amplify global transcriptional elongation and gene expression in cancers26,30. An interesting question is whether c-Myc has similar effect on both oncogenes and tumor suppressors? When c-Myc expression level is lower (blue curves in Fig 3c and 3d)30,31, the Pol II pausing index increases significantly at genes with sharp and control H3K4me3 but not broad H3K4me327 (Fig 3c). Accordingly, the H3K4me3 width also changes significantly at sharp and control H3K4me3 but not on promoters with broad H3K4me328 (Fig 3d). We also observed similar change in H3K4me3 width by treating human A549 cells for 1 h with Flavopiridol (Fig 3e), a specific inhibitor for positive transcription elongation factor b (P-TEFb)32, followed by H3K4me3 MNase ChIP-seq. Together, we conclude that transcriptional elongation regulators, such as c-Myc and P-TEFb, seem to drive the H3K4me3 epigenetic domain extension on genes with low baseline of elongation, but not on genes already undergoing strong elongation, such as tumor suppressors.
Broad H3K4me3 has strong and distinct enhancer activity
Several enhancer marks, such as H3K27ac and H3K4me1, also show strong enrichment on genes with broad H3K4me3 (Fig 4a and 4b). To further test the enhancer association, we collected motif instances of 127 transcription factors (TFs) across the whole genome33, and evaluated their enrichment levels at the 3 groups of H3K4me3 peaks. Interestingly, motif occurrence is significantly higher across the entire gene body of genes associated with broad H3K4me3 (Fig 4c). We further analyzed in-vivo binding sites of 119 TFs in 72 cell lines based on 411 ENCODE ChIP-Seq data34. In agreement with the motif result, we also observed significantly higher TF binding intensity at genes with broad H3K4me3 (Fig 4d).
Figure 4. Broad H3K4me3 has strong enhancer activity in human CD4+ T cells.
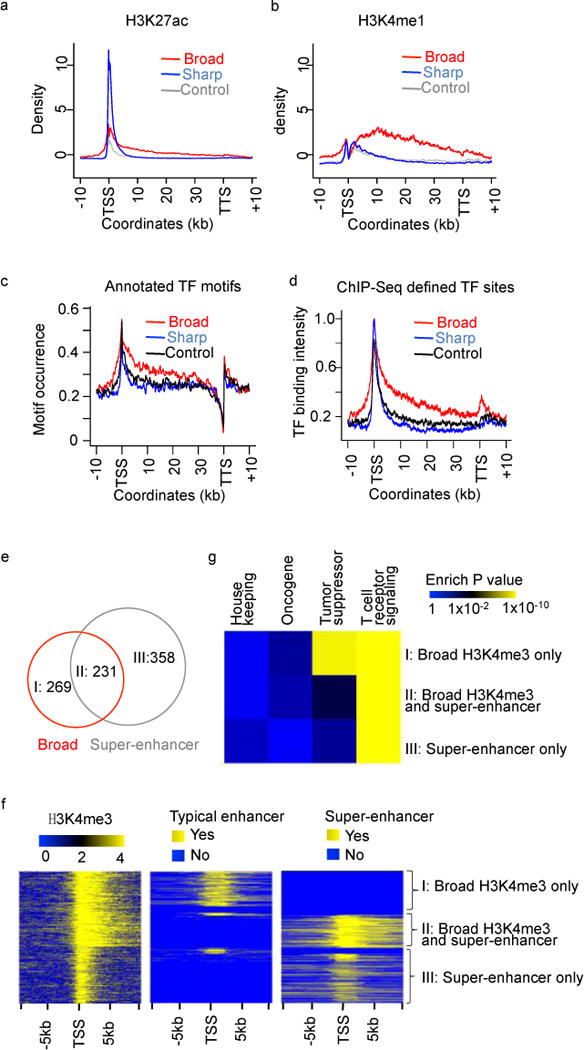
Average density plots of enhancer mark H3K27ac (a) and H3K4me1 (b) at genes associated with broad, sharp and random H3K4me3 peaks. Occurrence of annotated TF binding motifs (c) and ChIP-Seq TF binding sites (d) plotted at genes associated with broad, sharp and random H3K4me3 peaks. (e) Venn diagrams showing the overlap between genes associated with super-enhancers and broad H3K4me3 peaks. (f) The distribution of H3K4me3 peaks, typical enhancers, and super-enhancers flanking TSS, which were divided into 3 groups as indicated in (e). (g) Enrichment levels of the 3 gene groups as indicated in (e) in housekeeping genes, oncogenes, tumor suppressors, and KEGG T cell receptor signaling pathway.
The strong link to enhancer marks suggests that broad H3K4me3 might be associated with super-enhancers14 that are also exceptionally broad. To test this hypothesis, we collected super-enhancers and typical enhancers defined in CD4+ T cells15. As expected, 231 (39%) genes assigned with super-enhancers have strong overlap with genes assigned with broad H3K4me3 (Fig 4e). Most of the remaining 358 (61%) genes with super-enhancers contain sharp H3K4me3 peaks (Fig 4f). On the other hand, 231 (46%) of the top 500 genes assigned with broad H3K4me3 peaks have overlap with genes assigned with super-enhancers (Fig 4e, 4f). In contrast, genes with sharp or control H3K4me3 peaks have little overlap with genes with super-enhancers (Fig S8). Interestingly, tumor suppressors are only enriched (Fig 4g) in genes assigned with broad H3K4me3 lacking super-enhancers (group I in Fig 4e), indicating that the tumor suppressor link is highly specific to broad H3K4me3. These results are highly reproducible in most of the 61 additional cell or tissue types (Fig S9). In contrast, cell identity genes, e.g. those involved in T cell signaling, are enriched (Fig 4g) in genes with either broad H3K4me3 or super-enhancers (group I, II, or III in Fig 4e). In summary, broad H3K4me3 is strongly associated with enhancer activity and its unique functional enrichment, i.e. tumor suppressors, makes broad H3K4me3 distinct from super-enhancers.
Broad H3K4me3 at tumor suppressors is highly conserved
To understand broad H3K4me3 beyond CD4+ T cells, we collected 105 ENCODE H3K4me3 ChIP-Seq data from 43 normal cells. Together, we detected 4,167 non-redundant promoter H3K4me3 peaks wider than 4kb (Fig 5a). We ranked and further divided these H3K4me3 peaks into 9 groups (A to I) based on the conservation level of H3K4me3 peak width (% samples with H3K4me3 peaks longer than 4kb) from high to low. The top group A is highly conserved with H3K4me3 peaks wider than 4kb in more than 50% of cell types. Embryonic stem cells (ESCs) often have small numbers of broad H3K4me3 peaks (Fig 5b, Table S3), but they tend to retain the most conserved ones. Those conserved broad H3K4me3 peaks might be developed very early at ESCs, and maintained in various somatic cells.
Interestingly, tumor suppressors are only significantly enriched in the top two most conserved H3K4me3 groups, and quickly becomes non-enriched in the less conserved groups (Fig 5c). P53 and PTEN are examples of well-established tumor suppressors with conserved broad H3K4me3 across 105 ENCODE normal H3K4me3 ChIP-Seq data (Fig 5d). In contrast, cell identity genes, such as CD4, show broad H3K4me3 only in a few specific cell types (Fig 5e). These results are highly reproducible in another independent H3K4me3 ChIP-Seq dataset from the Roadmap Epigenomics Project. The Roadmap data contain 153 H3K4me3 ChIP-Seq samples from different normal cells and tissues, which allowed us to detect 8,143 promoters with H3K4me3 wider than 4 kb (Fig S10a). Similar to ENCODE, only the most conserved broad H3K4me3 peaks derived from Roadmap are enriched in tumor suppressors (Fig S10b). Furthermore, the majority (75%) of the top 500 genes with the most conserved broad H3K4me3 are in common between ENCODE and Roadmap (Fig S10c). The combined ENCODE and Roadmap broad (>4kb) H3K4me3 peaks are in Table S2.
To understand the difference between conserved and cell type specific broad H3K4me3, we used KEGG pathway enrichment to compare broad H3K4me3 derived from CD4+ T cell alone (broad group in Fig 1c) and conserved across 105 ENCODE samples (group A in Fig 5a). As expected, the conserved broad H3K4me3 removes cell identity genes, but maintains the pan-cancer tumor suppressors that are required by many somatic cells, such as p53 signaling (hsa04115), cell cycle (hsa04110), pathways in cancer (hsa05200), and various cancer pathways including colorectal cancer, leukemia, glioma, prostate cancer, basal cell carcinoma, renal cell carcinoma, melanoma, endometrial cancer, and small cell lung cancer (Fig 5f). In contrast, the cell type specific broad H3K4me3 is enriched in both T cell receptor signaling and pathways in cancer. Together, the conserved broad H3K4me3 are likely to originate from ESCs and represents a group of pan-cancer tumor suppressors that function in a variety of normal somatic cells.
H3K4me3 shortening indicates transcription repression
To compare between cancer and normal cells, we collected additional 63 H3K4me3 ChIP-Seq data from 20 ENCODE cancer cells. By pooling ChIP-seq data from cancer (63) and normal (105) samples together, we detected a total of 6,104 promoter H3K4me3 peaks wider than 4kb. Close inspection of this rich dataset allowed us to observe that many tumor suppressors, such as KLF16 and SPRY2 (Fig 6a), with conserved broad H3K4me3 across normal cells, are subject to H3K4me3 shortening in cancer cells.
Figure 6. Widespread shortening of broad H3K4me3 at tumor suppressors.
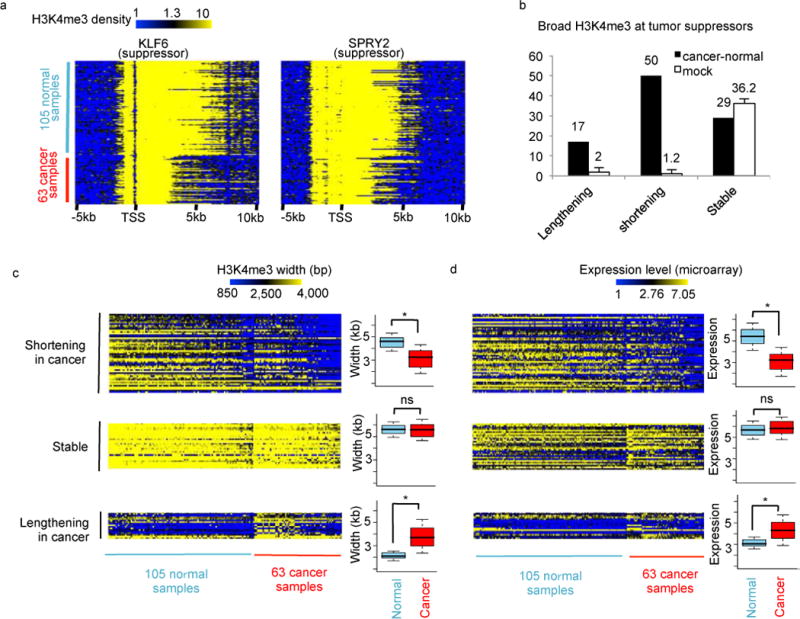
(a) H3K4me3 density on two tumor suppressors KLF16 (left) and SPRY2 (right) across 105 normal and 63 cancer ENCODE samples. (b) Broad H3K4me3 peaks at tumor suppressors that are shortened, lengthened, or stable between 105 normal and 63 cancer samples or through 1,000 mock comparisons. Heatmap of H3K4me3 peak widths (c) or expression levels (d) at each tumor suppressor (row) in each sample (column). The same 3 groups of genes with broad H3K4me3 peaks shortening, lengthening, or stable as indicated in (b) were plotted. Genes were ranked in the same order in the two heatmaps. A boxplot was plotted at the right side of each heatmap to show quantitative difference between cancer and normal samples. *P<1x−20 by Wilcoxon test; NS represents P>0.05.
These examples motivated us for a systematic comparison of known tumor suppressors that have conserved broad H3K4me3 in either cancer or normal (Fig 6b–6d). Based on a Poisson test p-value cutoff of 1×10−100 and a subtraction cutoff of 500 bp, we defined 50 tumor suppressors with H3K4me3 shortening in cancers, 3 fold more than the 17 H3K4me3 lengthening events. We also defined 29 stable tumor suppressors with broad H3K4me3 (mean width > 4kb) in both cancer and normal cells. Through randomly shuffling cancer or normal labels of ChIP-seq samples, we repeated the mock comparison 1,000 times, and defined 36.2 genes on average with stable broad H3K4me3, but almost no genes with H3K4me3 shortening or lengthening. Expanding the cancer-normal comparison to all genes (not limited to known tumor suppressors) with conserved broad H3K4me3 generated similar result, with 200 genes showing H3K4me3 shortening and enrichment in tumor suppressors, and 91 genes showing H3K4me3 lengthening but no tumor suppressor enrichment (Fig S11a–S11c). These analyses confirmed the widespread shortening of broad H3K4me3 in cancers. To evaluate expression changes of genes with broad H3K4me3, we collected 79 and 157 microarray data from ENCODE cancer and normal cells, respectively. As expected, genes with H3K4me3 shortening in cancers correlates with transcription repression, whereas genes with stable broad H3K4me3 display high expression levels in both cancer and normal cells (Fig 6d, S11d). We also observed similar results through comparison between Jurkat leukemia T cell and normal CD4+ T cells (Fig S13), and between breast cancer cells MCF7 and normal breast cells HMEC (Fig S14). As expected, the shortening of broad H3K4me3 is also associated with increase in Pol II pausing index (Fig S13c), suggesting reduced transcription elongation and expression level. Together, we conclude that the widespread shortening of broad H3K4me3 is associated with reduced expression of tumor suppressors in cancers.
Widespread shortening of broad H3K4me3 in primary tumors
Based on the above pan-cancer analysis in cell lines, we hypothesize that widespread shortening of broad H3K4me3 also exists in primary human tumors. As we were not able to find any published tumor H3K4me3 ChIP-seq data probably due to unsolved technical issues, we performed H3K4me3 ChIP-seq assays using matched tumor/normal pairs from lung (Fig 7) and liver (Fig S12), respectively. Of note, the matched tumor/normal pairs from the same patients allow an unbiased and efficient analysis of the H3K4me3 width. As observed in cell lines, broad H3K4me3 in normal lung tissues is associated with tumor suppressors (Fig 7a) and shortening of broad H3K4me3 is frequently observed at established tumor suppressors, such as GPX335 and PLK236–38 (Fig 7b). In total, we identified 209, 108, and 248 genes with shortened, lengthened, and stable broad H3K4me3 in lung tumors relative to normal lung tissues (Fig 7c). As expected, the shortening of broad H3K4me3 is associated with gene repression (Fig 7d). We also observed similar results through comparison between liver tumors and matched normal tissues (Fig S12). Together, these patient sample data generalize our results from cell lines and suggest the potential clinical significance of our findings that widespread shortening of broad H3K4me3 is associated with reduced expression of tumor suppressors.
Figure 7. Shortening of broad H3K4me3 peaks in lung tumors.
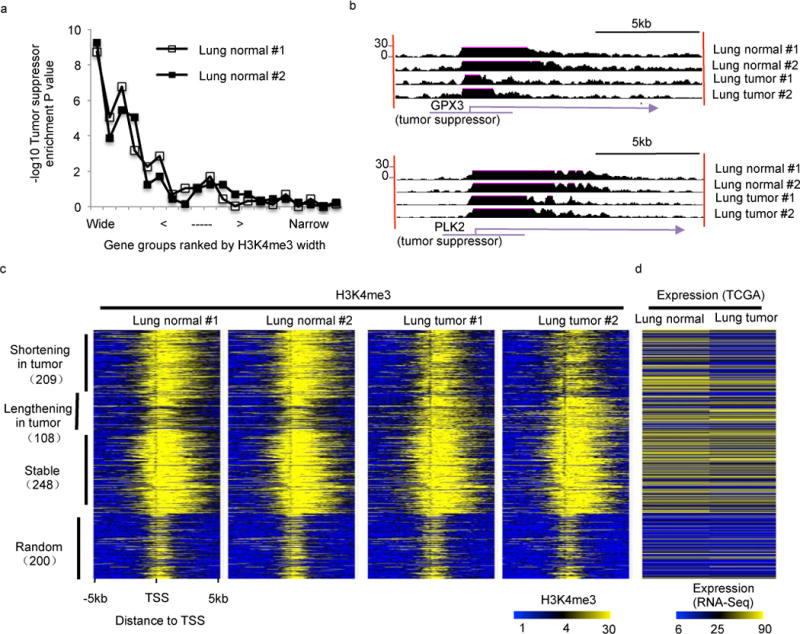
(a) Enrichment P values (y-axis) of tumor suppressors in different promoter groups (symbols along the curves) ranked by H3k4me3 peaks from wide to narrow. Each promoter group contains 500 genes. The left most promoter group contains the broad H3K4me3 peaks. Enrichment P value was calculated using Fisher’s exact test. (b) Snapshots of broad H3K4me3 shortening in two tumor suppressor genes GPX3 (top) and PLK2 (bottom). (c) Heatmaps for H3K4me3 density flanking TSS in lung normal tissues (left 2 panels) and lung tumors (right 2 panels). In each panel, each row represents a 10kb region flanking TSS. (d) Gene expression levels in lung normal tissues and lung tumors. Genes were ranked as in (c).
Conserved broad H3K4me3 suggests putative tumor suppressor
The strong enrichment of known tumor suppressors in genes with conserved broad H3K4me3 (Table S2) suggests that this epigenetic mark might be used to identify candidate tumor suppressors. We therefore tested this hypothesis in 3 tissue types: liver, lung and breast. We first defined putative candidate tumor suppressor for a given tissue type by requiring that 1) they have not been defined (Q value >0.5) as tumor suppressors or oncogenes based on mutations analysis of 8,200 tumor-normal pairs2; 2) their promoter H3K4me3 is wider than 4kb in over 20% of encode normal cells; 3) their promoter H3K4me3 is wider than 3kb in the given tissue type; 4) their mRNA expression levels in the given tissue type are higher than the median level of all genes. This allowed us to identify 251, 393, and 539 putative candidate tumor suppressors in liver, lung, and breast cancers, respectively (Fig S15). As an initial analysis to characterize the function of these putative candidate tumor suppressors, we randomly selected 24 candidates (8 from each tissue type), further requiring that they have not been defined as tumor suppressors in the literature. We then assessed the effect of silencing these genes on cell proliferation. Knockdown of known tumor suppressor PTEN had the expected effect on cell growth (Fig 8). Similarly, knockdown of the vast majority of candidate tumor suppressors with conserved broad H3K4me3 led to a significant (P < 0.05) increase of cell growth, whereas knockdown of 10 randomly selected genes with sharp H3K4me3 and comparable expression (Fig 8a, 8b and Fig S19) does not promote cell growth in A549 lung cancer cells. Similar effects of candidate gene silencing on cell growth were also observed in HepG2 liver cancer cells and MCF7 breast cancer cells (Fig 8c–f). Together, these results indicate that the expression of the vast majority of candidate tumor suppressors inhibit cancer cell growth.
Figure 8. Functional characterization of putative novel tumor suppressors defined by conserved broad H3K4me3.
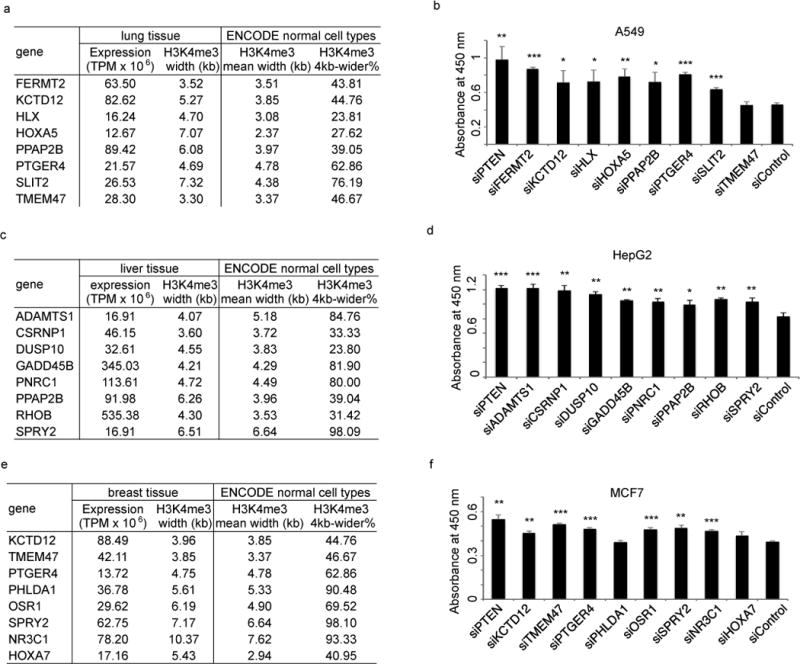
A549 (a, b), HepG2 (c, d) or MCF-7 (e, f) cells were transfected with indicated siRNAs, and cell proliferation was measured using the WST-1 assay. Error bar indicates standard variation calculated from three replicates. ***P <0.001, **P< 0.01, *P<0.05 compared to siControl based on T test.
DISCUSSION
We have uncovered the first epigenetic signature, namely broad H3K4me3, specifically enriched in tumor suppressors. Broad H3K4me3 that is conserved across normal cells probably represent a set of pan-cancer tumor suppressors, whereas cell-type specific broad H3K4me3 is associated with cell-identity genes, some of which might be cell-type specific tumor suppressors. Furthermore, widespread shortening of broad H3K4me3 in cancers is strongly associated with repression of tumor suppressors. This observation suggests that, besides complete loss of a few tumor suppressors at the DNA level, cancer development may be supplemented by a collective reduction in expression of dozens of tumor suppressors.
Different from typical H3K4me3, broad H3K4me3 is an indicator of increased transcription elongation and enhancer activity. Our analysis indicates that the transcription elongation regulators may control the broad H3K4me3. Another possible regulator of broad H3K4me3 is UpSET, which has been reported to prevent the spread of active chromatin in Drosophila39. MM5, the human homolog of UpSET, was also reported to bind H3K4me3 downstream of TSS40. Our MNase digestion based H3K4me3 ChIP-Seq data indicated the nucleosome positioning in broad H3K4me3 peaks is fuzzier than that in sharp peaks (Fig S16). More work will be needed to fully understand the mechanisms governing broad H3K4me3.
Broad H3K4me3 is distinct from other epigenetic features reported before. First, although broad H3K4me3 and super-enhancers are both wide epigenetic domains that are enriched for TF binding sites and cell-identity genes, they have different conservation patterns and functional implications. Broad H3K4me3 is conserved across cell types and uniquely enriched in tumor suppressors; in contrast, super-enhancers tend to be cell-type specific and indicate cancer-specific key oncogenes14. Second, the DNA methylation valleys41 or canyons42 have extended regions of low methylation that are at least 10 times larger than typical CpG islands; however, only < 50% of them have overlap with broad H3K4me3. Third, recent studies reported H3K4me2 expansion in tissue specific genes43 and H3K4me3 spreading in a subset of autism patients44; however, their functional implications in cancers have not been established. Finally, while this work was under review, Benayoun et al.45 reported that H3K4me3 breadth is linked to cell identity. Novertheless, the major novelty of our work is the discovery of the association between pan-cancer tumor suppressors and conserved broad H3K4me3 in normal cells. Furthermore, Benayoun et al.45 indicated that H3K4me3 breadth was not correlated with gene expression. However, through careful reanalysis of Benayoun et al. H3K4me3 raw data and simulation study, we conclude that the lack of correlation is largely due to their inappropriate statistical methodology (Fig S18).
Recent cancer genome sequencing has characterized a large number of non-uniformly distributed somatic mutations, with difference in local mutation density exceeding up to 5-fold6. The underlying mechanisms of mutational heterogeneity includes DNA replication timing4 and gene expression level6. Therefore, to identify significantly mutated genes in cancers, a common practice is to correct for variation by using patient-specific and gene-specific “background” mutation rates6. Our study, suggests a new layer of “foreground” information so that genes with conserved broad H3K4me3 (Table S2) are more likely to be tumor suppressors (Fig 8). Together, the broad H3K4me3 epigenetic signature provides mutation-independent information for the discovery and characterization of novel tumor suppressors.
ONLINE METHODS
Tissue and cell line Native MNase H3K4me3 ChIP-seq
Native MNase ChIP-seq was performed as we descried previously46 with modifications. For tissue H3K4me3 ChIP-seq, the frozen tissues (50–100 mg), purchased from Cureline, were trimmed and chopped into small pieces on ice, and then washed with ice cold PBS twice. The pellets were homogenized in PBS containing proteinase inhibitor. The nuclei were checked by phase-contrast microscopy to maximize the yield of nuclei (~5×10⁷). With sufficient lysis in 25% sucrose, 0.2% NP-40/TBS, the pellets were layered on 50% [w/v] sucrose/TBS, and then centrifuged at 21,000 g, 30 min, 4°C. The nuclei pellets were resuspended in digestion buffer (0.32 M sucrose, 50 mM Tris-HCl (pH 7.5), 4 mM MgCl2, 1 mM CaCl2), and digested with MNase for ~10 min to generate mainly mononucleosomes that were immunoprecipitated with an anti-H3K4me3 antibody (ab8580, Abcam). After incubation over night, Protein A Dynal magnetic beads were washed 6 times using modified RIPA buffer (50 mM Tris-HCL pH 7.8, 1 mM EDTA, 0.25% Na Deoxycholate, 1% NP-40, 0.5 M LiCl). The DNA was eluted in 1% SDS and 0.1M NaHCO3 and reversed cross-linking at 65°C, over night. The library was generated using NEBNext ChIP-Seq Library Prep Master Mix Set, and amplified with 10 PCR cycles. The library was prepared by size selection for mononucleosome fragments. High throughput sequencing was performed using Illumina HiSeq 2500 at the Ohio State University Comprehensive Cancer Center (OSUCCC) sequencing core. For cell line native MNase H3K4me3 ChIP-seq, human lung cancer A549 cells were treated with 1μM of flavopiridol or DMSO alone for 1 h before rapid isolation of nucleus, following the same protocol described above to construct sequencing libraries.
Cell Proliferation Assay
Human breast cancer cell line (MCF7), lung cancer cell line (A549) and hepatocellular liver carcinoma cell line (HepG2) were obtained from the American Type Culture Collection (ATCC). The cell lines have been authenticated by ATCC by STR profiling and karyotyping, and the cell lines were regularly tested for mycoplasma infection. The cells were maintained in 10% fetal calf serum (FCS)-supplemented DMEM medium. Cell proliferation assays were performed as we described previously46,47 with modifications. For WST-1 assays, cells were seeded (2×10³ cells/well for A549, 4×10³ cells/well for MCF7 and 8×10³ cells/well for HepG2 cells) in 96-well plates in triplicates 24 h before transfection. For direct cell counting assays, A549 cells were seeded at 5×10⁴ cells/well in 6-well plates. siRNAs (on target plus Smart pool) targeting putative tumor suppressor genes or randomly selected genes with comparable expression, and on-target plus siRNA Controls were purchased from GE Dharmacon. siRNAs were transfected using Lipofectamine 2000 reagent according to the manufacturer’s instructions. After transfection for 4 days, the numbers of living cells were measured using a colorimetric WST-1 assay (Rhoch) or by direct cell counting. The data are presented as the mean ± SD. Student’s t-test was used to determine the statistical significance of the differences between the siControl and siPutative tumor suppressor genes.
Data source
A total of 1,134 data sets that were used in this manuscript are listed in Table S1. The table contains information about the web link and reference to each data set. Specifically, the tumor suppressors and oncogenes used in this study were defined by the TUSON algorithm from genome sequencing of >8,200 tumor-normal pairs48. TUSON is a computational method that analyzes the patterns of mutational signatures in tumors and predicts the likelihood that any individual gene functions as a tumor suppressor or oncogene. We ranked tumor suppressors by their TUSON predicting P values from the most to the least significant, and used the top 500 genes (p-value <0.01) as reference tumor suppressors throughout this study. We also used the same strategy to define the top 500 reference oncogenes.
ChIP-Seq, MeDIP-Seq, and MRE-Seq analysis
Sequencing reads were mapped to the human genome hg19 or mouse genome mm9. The Dregion function in DANPOS49 version 2.2.0 was used for reads density calculation and peak calling. Briefly, We extended each read at the 3′ end to be 200bp long, and then calculated read density as the number of reads covering each base pair in the genome. For each data set, the total number of mapped reads was normalized to the same 25 million followed by quantile normalization. We used MACS2’s broad-peak function for steps (1) and (2), and add an additional step (3) for a more stringent definition of broad peak: (1) use a peak-calling occupancy cutoff (i.e., Poisson P value 1e–8) to define seed peaks; (2) use an extending occupancy cutoff (i.e., Poisson P value 1e–5) to extend seed peak. If the occupancy at each nucleotide between seed peaks are all higher than this cutoff, the seed peaks will be merged into a single broad peak; (3) Only neighboring seed peaks with distance < 3kb can be merged into a single broad peak. When the distance between two seed peaks are too far, even if there are considerable H3K4me3 signal between them, it is still possible that they are two independent peaks. Therefore, we added a step (3) to require that only an extension shorter than 3kb can be allowed. Notably, using different extension lengths does not change our observations, e.g., the broad and sharp peaks (Fig S20), or the association between broad H3K4me3 and tumor suppressor (Fig S21). The multi-modal distribution of H3K4me3 peak sharpness is also not due to the extension length, but may be due to different statistical property of H3K4me3 signal at different genes (Fig S23). We mapped each peak to TSS based on the GREAT algorithm, requiring the peak to locate within from 10kb upstream to 4kb downstream of TSS. We used the Profile function in DANPOS version 2.2.0 to calculate average read density flanking a group of TSS or gene body. MEV version 4.5.0 was used for plotting heatmaps.
Microarray analysis
We downloaded Affymetrix array data from ENCODE project website, and Affymetrix U133 Plus 2.0 array data for CD4+T cells from NCBI GEO. We then used the ReadAffy and RMA functions in the R package Affy to calculate the expression value of each gene.
RNA-Seq analysis
For TCGA data sets, expression value (Transcripts Per Million, or TPM) of each gene in each sample was downloaded from the project website (see URLS). For other RNA-Seq data, we downloaded raw reads from the GEO database, used Tophat to map reads to the human genome hg19, used the htseq-count function in HTSeq to calculate reads count for each gene, and then calculated gene expression (Fragments Per Kilo base pairs Per Million, or FPKM) value based on the reads count. Gene expression values between samples were normalized using normalizeQuantiles function in the R package Limma.
Function enrichment analysis
We used DAVID for KEGG pathway analysis. Each pathway with a Q value (Bonferroni correction) smaller than 1×10⁻³ in Figure 1 or 0.05 in other Figures was defined as significantly enriched. Enrichment level of tumor suppressor, oncogene, and housekeeping genes were defined based on Fisher’s Exact Test. Since gene number may affect the P value (Fig S22), to make fair comparison between different gene sets, we always use the same number of top ranked genes for Fisher’s Exact Test.
Pol II pausing index calculation
We defined pausing region as from 30bp upstream to 300bp downstream of TSS, and defined elongation region as from 300bp downstream of TSS to 1kb downstream of TTS. We then calculated pausing index as the pausing to elongation ratio of Pol II ChIP-Seq read density.
Supplementary Material
Acknowledgments
We are grateful to Min Luo, Margaret Goodell, Lawrence Donehower, Thomas Westbrook and Anne Brunet for helpful discussions. This work was supported by US National Institutes of Health (NIH) grants R01HG007538 and R01CA193466, Cancer Prevention Research Institute of Texas (CPRIT) grants RP110471 and RP150292 (W. L.); and by NIH R01CA151979, DOD W81XWH-12-1-0615 and U54CA113001 (Q. W.). X.S. is an inaugural MDACC R. Lee Clark Fellow.
Footnotes
URLS
TCGA project website: http://cancergenome.nih.gov
ENCODE project website: hgdownload.cse.ucsc.edu/apache/htdocs/goldenPath/hg19/encodeDCC
Website for additional data sets for this project: https://sites.google.com/site/broadh3k4me3/
ACCESSION CODES
H3K4me3 ChIP-seq data of A549 cells and tumor/normal pairs have been submitted to the NCBI GEO database (GSE67471). To further increase transparency and reproducibility, we have created a website (see URLS) to host additional data sets used in this paper, including the bed and bigwig files for the H3K4me3 peaks and the data underlying the graphical representations used in the figures.
AUTHOR CONTRIBUTIONS
K.C. and W.L. conceived the project, designed the experiments and performed the data analysis. Z.C, D.W and Q.W. designed and performed the experiments. L.Z. designed the experiments and performed the data analysis, X.L., J.S., Y.X., and Z.X. analyzed the data. K.C., Q.W., and W.L. interpreted the data and wrote the manuscript with comments from B.R. X.C., and X.S.
COMPETING FINANCIAL INTERESTS
The authors have no competing financial interest that might influence the performance or presentation of the work described in this manuscript.
References
- 1.Weinstein JN, et al. The Cancer Genome Atlas Pan-Cancer analysis project. Nat Genet. 2013;45:1113–20. doi: 10.1038/ng.2764. [DOI] [PMC free article] [PubMed] [Google Scholar]
- 2.Davoli T, et al. Cumulative haploinsufficiency and triplosensitivity drive aneuploidy patterns and shape the cancer genome. Cell. 2013;155:948–962. doi: 10.1016/j.cell.2013.10.011. [DOI] [PMC free article] [PubMed] [Google Scholar]
- 3.Vogelstein B, et al. Cancer Genome Landscapes. Science (New York, NY) 2013;339:1546–1558. doi: 10.1126/science.1235122. [DOI] [PMC free article] [PubMed] [Google Scholar]
- 4.De S, Michor F. DNA replication timing and long-range DNA interactions predict mutational landscapes of cancer genomes. Nat Biotechnol. 2011;29:1103–1108. doi: 10.1038/nbt.2030. [DOI] [PMC free article] [PubMed] [Google Scholar]
- 5.Schuster-Böckler B, Lehner B. Chromatin organization is a major influence on regional mutation rates in human cancer cells. Nature. 2012:1–5. doi: 10.1038/nature11273. [DOI] [PubMed] [Google Scholar]
- 6.Lawrence MS, et al. Mutational heterogeneity in cancer and the search for new cancer-associated genes. Nature. 2013;499:214–8. doi: 10.1038/nature12213. [DOI] [PMC free article] [PubMed] [Google Scholar]
- 7.Barski A, et al. High-Resolution Profiling of Histone Methylations in the Human Genome. Cell. 2007;129:823–837. doi: 10.1016/j.cell.2007.05.009. [DOI] [PubMed] [Google Scholar]
- 8.Lauberth SM, et al. H3K4me3 interactions with TAF3 regulate preinitiation complex assembly and selective gene activation. Cell. 2013;152:1021–36. doi: 10.1016/j.cell.2013.01.052. [DOI] [PMC free article] [PubMed] [Google Scholar]
- 9.Zhao XD, et al. Whole-genome mapping of histone H3 Lys4 and 27 trimethylations reveals distinct genomic compartments in human embryonic stem cells. Cell Stem Cell. 2007;1:286–98. doi: 10.1016/j.stem.2007.08.004. [DOI] [PubMed] [Google Scholar]
- 10.Sims RJ, et al. Recognition of trimethylated histone H3 lysine 4 facilitates the recruitment of transcription postinitiation factors and pre-mRNA splicing. Molecular cell. 2007;28:665–676. doi: 10.1016/j.molcel.2007.11.010. [DOI] [PMC free article] [PubMed] [Google Scholar]
- 11.Borde V, et al. Histone H3 lysine 4 trimethylation marks meiotic recombination initiation sites. The EMBO journal. 2009;28:99–111. doi: 10.1038/emboj.2008.257. [DOI] [PMC free article] [PubMed] [Google Scholar]
- 12.Pena PV, Hom RA, Hung T, Lin H, Kuo AJ. Histone H3K4me3 binding is required for the DNA repair and apoptotic activities of ING1 tumor suppressor. Journal of molecular. 2008 doi: 10.1016/j.jmb.2008.04.061. [DOI] [PMC free article] [PubMed] [Google Scholar]
- 13.Calo E, Wysocka J. Modification of Enhancer Chromatin: What, How, and Why? Molecular cell. 2013;49:825–837. doi: 10.1016/j.molcel.2013.01.038. [DOI] [PMC free article] [PubMed] [Google Scholar]
- 14.Whyte WA, et al. Master transcription factors and mediator establish super-enhancers at key cell identity genes. Cell. 2013;153:307–319. doi: 10.1016/j.cell.2013.03.035. [DOI] [PMC free article] [PubMed] [Google Scholar]
- 15.Hnisz D, et al. Super-Enhancers in the Control of Cell Identity and Disease. Cell. 2013 doi: 10.1016/j.cell.2013.09.053. [DOI] [PMC free article] [PubMed] [Google Scholar]
- 16.Lovén J, et al. Selective inhibition of tumor oncogenes by disruption of super-enhancers. Cell. 2013;153:320–334. doi: 10.1016/j.cell.2013.03.036. [DOI] [PMC free article] [PubMed] [Google Scholar]
- 17.Virely C, et al. Haploinsufficiency of the IKZF1 (IKAROS) tumor suppressor gene cooperates with BCR-ABL in a transgenic model of acute lymphoblastic leukemia. Leukemia. 2010;24:1200–4. doi: 10.1038/leu.2010.63. [DOI] [PubMed] [Google Scholar]
- 18.Georgopoulos K, Winandy S, Avitahl N. The role of the Ikaros gene in lymphocyte development and homeostasis. Annu Rev Immunol. 1997;15:155–76. doi: 10.1146/annurev.immunol.15.1.155. [DOI] [PubMed] [Google Scholar]
- 19.Dail M, et al. Mutant Ikzf1, KrasG12D, and Notch1 cooperate in T lineage leukemogenesis and modulate responses to targeted agents. Proc Natl Acad Sci U S A. 2010;107:5106–11. doi: 10.1073/pnas.1001064107. [DOI] [PMC free article] [PubMed] [Google Scholar]
- 20.Gutierrez A, et al. High frequency of PTEN, PI3K, and AKT abnormalities in T-cell acute lymphoblastic leukemia. Blood. 2009;114:647–50. doi: 10.1182/blood-2009-02-206722. [DOI] [PMC free article] [PubMed] [Google Scholar]
- 21.Mendes RD, et al. PTEN microdeletions in T-cell acute lymphoblastic leukemia are caused by illegitimate RAG-mediated recombination events. Blood. 2014;124:567–78. doi: 10.1182/blood-2014-03-562751. [DOI] [PubMed] [Google Scholar]
- 22.Barski A, et al. High-resolution profiling of histone methylations in the human genome. Cell. 2007;129:823–837. doi: 10.1016/j.cell.2007.05.009. [DOI] [PubMed] [Google Scholar]
- 23.Eisenberg E, Levanon EY. Human housekeeping genes, revisited. Trends Genet. 2013;29:569–74. doi: 10.1016/j.tig.2013.05.010. [DOI] [PubMed] [Google Scholar]
- 24.Yasuo K, Shigeo O. Regulation of mitochondrial ATP synthesis in mammalian cells by transcriptional control. International Journal of Biochemistry. 1990 doi: 10.1016/0020-711x(90)90333-x. [DOI] [PubMed] [Google Scholar]
- 25.Smolle M, Workman JL. Transcription-associated histone modifications and cryptic transcription. Biochim Biophys Acta. 2013;1829:84–97. doi: 10.1016/j.bbagrm.2012.08.008. [DOI] [PMC free article] [PubMed] [Google Scholar]
- 26.Rahl PB, et al. c-Myc regulates transcriptional pause release. Cell. 2010;141:432–445. doi: 10.1016/j.cell.2010.03.030. [DOI] [PMC free article] [PubMed] [Google Scholar]
- 27.Glover-Cutter K, Kim S, Espinosa J, Bentley DL. RNA polymerase II pauses and associates with pre-mRNA processing factors at both ends of genes. Nat Struct Mol Biol. 2008;15:71–8. doi: 10.1038/nsmb1352. [DOI] [PMC free article] [PubMed] [Google Scholar]
- 28.Jonkers I, Kwak H, Lis JT. Genome-wide dynamics of Pol II elongation and its interplay with promoter proximal pausing, chromatin, and exons. Elife. 2014;3:e02407. doi: 10.7554/eLife.02407. [DOI] [PMC free article] [PubMed] [Google Scholar]
- 29.Veloso A, et al. Rate of elongation by RNA polymerase II is associated with specific gene features and epigenetic modifications. Genome Res. 2014;24:896–905. doi: 10.1101/gr.171405.113. [DOI] [PMC free article] [PubMed] [Google Scholar]
- 30.Nie Z, et al. c-Myc Is a Universal Amplifier of Expressed Genes in Lymphocytes and Embryonic Stem Cells. Cell. 2012 doi: 10.1016/j.cell.2012.08.033. [DOI] [PMC free article] [PubMed] [Google Scholar]
- 31.Lin CY, et al. Transcriptional amplification in tumor cells with elevated c-Myc. Cell. 2012;151:56–67. doi: 10.1016/j.cell.2012.08.026. [DOI] [PMC free article] [PubMed] [Google Scholar]
- 32.Chao SH, Price DH. Flavopiridol inactivates P-TEFb and blocks most RNA polymerase II transcription in vivo. J Biol Chem. 2001;276:31793–9. doi: 10.1074/jbc.M102306200. [DOI] [PubMed] [Google Scholar]
- 33.Kheradpour P, Kellis M. Systematic discovery and characterization of regulatory motifs in ENCODE TF binding experiments. Nucleic acids research. 2013 doi: 10.1093/nar/gkt1249. [DOI] [PMC free article] [PubMed] [Google Scholar]
- 34.Wang J, et al. Sequence features and chromatin structure around the genomic regions bound by 119 human transcription factors. Genome Res. 2012;22:1798–812. doi: 10.1101/gr.139105.112. [DOI] [PMC free article] [PubMed] [Google Scholar]
- 35.Barrett CW, et al. Tumor suppressor function of the plasma glutathione peroxidase gpx3 in colitis-associated carcinoma. Cancer Res. 2013;73:1245–55. doi: 10.1158/0008-5472.CAN-12-3150. [DOI] [PMC free article] [PubMed] [Google Scholar]
- 36.Matthew EM, et al. The p53 target Plk2 interacts with TSC proteins impacting mTOR signaling, tumor growth and chemosensitivity under hypoxic conditions. Cell Cycle. 2009;8:4168–75. doi: 10.4161/cc.8.24.10800. [DOI] [PMC free article] [PubMed] [Google Scholar]
- 37.Coley HM, et al. Polo Like Kinase 2 Tumour Suppressor and cancer biomarker: new perspectives on drug sensitivity/resistance in ovarian cancer. Oncotarget. 2012;3:78–83. doi: 10.18632/oncotarget.332. [DOI] [PMC free article] [PubMed] [Google Scholar]
- 38.Smith P, Syed N, Crook T. Epigenetic inactivation implies a tumor suppressor function in hematologic malignancies for Polo-like kinase 2 but not Polo-like kinase 3. Cell Cycle. 2006;5:1262–4. doi: 10.4161/cc.5.12.2813. [DOI] [PubMed] [Google Scholar]
- 39.Rincon-Arano H, Halow J, Delrow JJ, Parkhurst SM, Groudine M. UpSET recruits HDAC complexes and restricts chromatin accessibility and acetylation at promoter regions. Cell. 2012;151:1214–1228. doi: 10.1016/j.cell.2012.11.009. [DOI] [PMC free article] [PubMed] [Google Scholar]
- 40.Ali M, et al. Molecular basis for chromatin binding and regulation of MLL5. Proceedings of the National Academy of Sciences. 2013;110:11296–11301. doi: 10.1073/pnas.1310156110. [DOI] [PMC free article] [PubMed] [Google Scholar]
- 41.Xie W, et al. Epigenomic analysis of multilineage differentiation of human embryonic stem cells. Cell. 2013;153:1134–48. doi: 10.1016/j.cell.2013.04.022. [DOI] [PMC free article] [PubMed] [Google Scholar]
- 42.Jeong M, et al. Large conserved domains of low DNA methylation maintained by Dnmt3a. Nat Genet. 2014;46:17–23. doi: 10.1038/ng.2836. [DOI] [PMC free article] [PubMed] [Google Scholar]
- 43.Pekowska A, Benoukraf T, Ferrier P, Spicuglia S. A unique H3K4me2 profile marks tissue-specific gene regulation. Genome research. 2010;20:1493–1502. doi: 10.1101/gr.109389.110. [DOI] [PMC free article] [PubMed] [Google Scholar]
- 44.Shulha HP, et al. Epigenetic signatures of autism: trimethylated H3K4 landscapes in prefrontal neurons. Archives of general psychiatry. 2012;69:314–324. doi: 10.1001/archgenpsychiatry.2011.151. [DOI] [PubMed] [Google Scholar]
- 45.Benayoun BA, et al. H3K4me3 breadth is linked to cell identity and transcriptional consistency. Cell. 2014;158:673–88. doi: 10.1016/j.cell.2014.06.027. [DOI] [PMC free article] [PubMed] [Google Scholar]
- 46.Chen Z, et al. Agonist and antagonist switch DNA motifs recognized by human androgen receptor in prostate cancer. EMBO J. 2015;34:502–16. doi: 10.15252/embj.201490306. [DOI] [PMC free article] [PubMed] [Google Scholar]
- 47.Wang Q, et al. Androgen receptor regulates a distinct transcription program in androgen-independent prostate cancer. Cell. 2009;138:245–56. doi: 10.1016/j.cell.2009.04.056. [DOI] [PMC free article] [PubMed] [Google Scholar]
- 48.Davoli T, et al. Cumulative haploinsufficiency and triplosensitivity drive aneuploidy patterns and shape the cancer genome. Cell. 2013;155:948–962. doi: 10.1016/j.cell.2013.10.011. [DOI] [PMC free article] [PubMed] [Google Scholar]
- 49.Chen K, et al. DANPOS: Dynamic Analysis of Nucleosome Position and Occupancy by Sequencing. Genome research. 2012 doi: 10.1101/gr.142067.112. [DOI] [PMC free article] [PubMed] [Google Scholar]
Associated Data
This section collects any data citations, data availability statements, or supplementary materials included in this article.