

Abstract
An important element of mating in the malaria vector Anopheles gambiae in nature is the crepuscular mating aggregation (swarm) composed almost entirely of males, where most coupling and insemination is generally believed to occur. In this study we mathematically characterize the oscillatory movement of male An. gambiae in terms of an established individual-based mechanistic model that parameterizes the attraction of a mosquito towards the center of the swarm using the natural frequency of oscillation and the resistance to its motion, characterized by the damping ratio. Using three-dimensional trajectory data of ten wild mosquito swarms filmed in Mali, Africa, we show two new results for low and moderate wind conditions, and indicate how these results may vary in high wind. First, we show that in low and moderate wind the vertical component of the mosquito motion has a lower frequency of oscillation and higher damping ratio than horizontal motion. In high wind, the vertical and horizontal motions are similar to one another and the natural frequencies are higher than in low and moderate wind. Second, we show that the predicted average disagreement in the direction of motion of swarming mosquitoes moving at random is greater than the average disagreement we observed between each mosquito and its three closest neighbors, with the smallest level of disagreement occurring for the nearest neighbor in seven out of ten swarms. The alignment of the direction of motion between nearest neighbors is the highest in high wind. This result provides evidence for flight-path coordination between males flying in a swarm.
Keywords: swarming, Anopheles gambiae, autocorrelation
Introduction
Most studies on collective behavior focus on animal aggregations in which the interest of the constituent individuals are closely aligned; this is the case of anti-predator adaptations in flocks of starlings (Cavagna et al. 2010) and schooling fish (Ward et al. 2011), or collective transport for nest building by consensus decision making in ants (Berman et al. 2011). An important situation where the interests of individuals making up an aggregation may not align completely is in a mating aggregation or lek. A lek can be usefully defined as a non-resource-based aggregation where males come together to display and compete for females (Reynolds and Gross 1990).
In the malaria vector Anopheles gambiae, most coupling and subsequent insemination occurs in a crepuscular mating swarm, where many males gather and fly together in a collective, but only very few per night form couples with virgin females. One important and recently discovered characteristic of these mating aggregations is that they are monotypic: the M and S molecular forms of An. gambiae (Favia et al. 1997) have been found to swarm separately over natural markers and bare ground, respectively (Diabaté et al. 2009), at least in areas where there is low gene flow between them (Diabate et al. 2011).
In mathematical models of collective behavior, swarming can arise from minimal interactions between neighboring individuals (Shimoyama et al. 1996). A result of low levels of interaction is relatively high randomness of motion. Therefore, swarming motion is typically observed as a decrease in synchronized motion, perhaps due to a reduced tendency of aligning with the nearest neighbor. This result is common in Lagrangian systems where each member responds to physical cues or nearest neighbors (Okubo 1986; Grunbaum 1994; Shimoyama et al. 1996; Parrish and Hammer 1997; Couzin et al. 2002), possibly due in part to time delays (Forgoston and Schwartz 2008). In an Eulerian representation of a swarm, modeled as a discrete probability distribution function, interactions with neighboring individuals may depend on local density (Mogilner and Edelstein-Keshet 1999; Lee, Hoopes, and Diehl 2001).
As far as we are aware, the only model of swarming validated against real data is one where the individual interacts with the swarm centroid via an acceleration field that depends on the distance from the centroid (Okubo 1986). In that sense, the swarming individual moves similar to a harmonic oscillator subject to damping (i.e., resistance to motion such as aerodynamic drag) and random forcing. This simple model was validated using real data consisting of two-dimensional trajectories of swarming midges (Okubo 1986), and then again on three-dimensional trajectories of water fleas (Banas, Wang, and Yen 2004), albeit at low temporal resolution.
Equipped with data that is orders of magnitude more extensive than was previously available for reconstructing mosquito swarms (Gibson 1985; Ikawa et al. 1994; Manoukis et al. 2009), and the first to contain three-dimensional trajectories (Butail et al. 2012), we present a new characterization of the dynamics of male swarming in An. gambiae. Our analysis begins with computing the velocity autocorrelation in three separate dimensions: the vertical, the direction of ambient wind (unless there is no wind, which is rare), and the direction normal to the wind. We use the average wind direction to break the rotational symmetry in the horizontal plane in order to capture the effects if any of additional drag from increased airspeed; another option that we have found has little benefit is to use the direction of the setting sun. A damped harmonic oscillator model describes the motion of the mosquito as though it were coupled to the swarm centroid (Okubo 1986).
We use an analytical form of the velocity autocorrelation function to quantify the average natural frequency and damping ratio for each of ten reconstructed swarm sequences. (The damping ratio is a nondimensional measure for which unity represents critical damping, less than unity is underdamped, and more than unity is overdamped.) The first part of the analysis compares these values between swarms. The second part of our analysis looks at interactions between mosquitoes within each swarm. In particular, to compare the degree of alignment in the motion of neighboring mosquitoes, we use the average angular displacement between their unit velocities in three dimensions.
Materials and Methods
Data collection and processing
We filmed twenty-five mosquito swarms in the village of Donéguébougou, Mali (12°48′38″N, 7°59′05″ W), during the periods 21–29 August 2010 and 6–9 October 2011 (see Table 1). Donéguébougou is an agricultural village of approximately 1,500 inhabitants about 25 km from the capital, Bamako. The Sudan Savana habitat of this area includes a highly seasonal rainfall pattern, with a wet season between May and October. During this time the swarms of An. gambiae reach their largest size and form at twilight, often in the same locations as the previous evening (Diabaté et al. 2009). (For more details on the study area and people, please see (Manoukis et al. 2009).)
Table 1.
Reconstructed swarming sequences
| Date & Time (Swarm no.) | Track duration (s) | Swarm size | Temp. (°C) | Wind sp. (m/s) | Wind dir. (mag.) | Avg. height (m) | Marker | Type |
|---|---|---|---|---|---|---|---|---|
| Aug. 21, 2010 7:02 PM (1) | 47.0 | 12±5 | 26.6 | N/A | 160.5 | 1.9±0.1 | Bare ground | S |
| Aug. 25, 2010 7:00 PM (1) | 16.0 | 6±1 | 26.6 | 0.50 | 187.5 | 1.8±0.1 | Bare ground | S |
| Aug. 25, 2010 7:04 PM (2) | 8.4 | 24±6 | 26.0 | 0.43 | 337.8 | 1.8±0.0 | Bare ground | S |
| Aug. 26, 2010 6:58 PM (1) | 25.6 | 7±4 | 28.8 | 0.55 | 292.1 | 1.8±0.1 | Bare ground | S |
| Aug. 28, 2010 7:01 PM (1) | 30.5 | 12±4 | 28.1 | 0.74 | 299.2 | 2.0±0.1 | Bare ground | S |
| Aug. 29, 2010 7:00 PM (1) | 32.4 | 18±3 | 24.1 | 0.50 | 192.3 | 1.9±0.1 | Bare ground | S |
| Aug. 30, 2010 7:02 PM (2) | 9.2 | 20±3 | 24.9 | 0.61 | 136.4 | 1.6±0.1 | Bare ground | S |
| Sep. 01, 2010 6:53 PM (2) | 16.0 | 13±1 | 24.4 | 0.67 | 252.1 | 2.0±0.1 | Grass patch | S |
| Oct. 06, 2011 6:31 PM (2) | 8.2 | 12±3 | 27.0 | 0.54 | N/A | 2.1±0.0 | Bundle of wood | M* |
| Oct. 07, 2011 6:32 PM (2) | 7.0 | 9±2 | 26.8 | 0.48 | N/A | 2.2±0.0 | Bundle of wood | M* |
PCR data was not available for the putative M types
The data collection system consisted of a pair of time-synced Hitachi KP-F120CL cameras (Hitachi-Kokusai, Tokyo, Japan) with HF12.5SA-1 Fujinon lenses (Fujifilm, Valhalla, NY, USA) mounted in a parallel, stereo configuration that recorded image streams at 25 frames per second and 1392 × 1040 pixel resolution. The cameras were mounted approximately 20 cm apart from each other on a Slik Twin Camera bar (Slik corporation, Tokyo, Japan). The 20 cm baseline was chosen to obtain a balance between large overlap (the cameras had an approximate field of view of 38 °) and disparity. Each camera was calibrated onsite every day using a checkerboard and the MATLAB Calibration Toolbox (Bouguet) to get an accurate measure intrinsic camera properties such as the focal length and the center of the image and extrinsic camera properties such as the cameras’ relative orientation and position. The recording system was initially placed approximately 5 m away from the swarming location. Once the mosquitoes started swarming, the cameras were brought closer to the swarm until it filled the camera view and was centered in it. The majority of swarms were filmed at a distance of 1.5 – 2.5 m. The cameras were oriented towards the setting sun to get the brightest possible background. After filming, a multi-target tracking algorithm was run on the stereoscopic video streams to generate three-dimensional track segments with an average length of 0.6–1s. These segments were verified and combined under human supervision. (A detailed description of the tracking system is available in (Butail et al. 2012).)
Each swarm was filmed several times in sequences that last up to 90 seconds until it became too dark to see individual mosquitoes in the captured images. Sequences were selected for reconstruction based on minimizing the variability in swarm size and the presence of a relatively clear background. Our Bayesian multi-target tracking system (Butail et al. 2012) is able to localize and track individual males for periods of time lasting up to 60 seconds. The reconstructed sequences are of durations 7–47 seconds with swarm sizes in the range 6–24 mosquitoes (see Table 1). A Kestrel 4500 portable weather station (Nielsen-Kellerman, Boothwyn, PA, USA) mounted at the filming location recorded environmental parameters such as temperature, wind speed, and wind direction at regular intervals of two seconds during the filming. The average (respectively, highest) wind speed was 0.57 m/s (respectively, 0.74 m/s). The average height of a swarm is the mean height of all mosquitoes reconstructed during a particular sequence. Wherever available, we present polymerase chain reaction (PCR) test results for molecular type of the mosquito. PCR tests were performed on a sample of flying males caught with a hand net. If no discernible marker was found below the swarm, we note the marker as bare ground.
Modeling motion using a damped harmonic oscillator
Following (Okubo 1986), we model the total three-dimensional force Fi on a mosquito i in a swarm of N mosquitoes as a linear combination of an external (to the swarm) force , drag force , and an internal force Fij due to interaction with mosquito j. (We remove the bold font to denote the scalar components of the force.) Given the three-dimensional position ri relative to the swarm centroid and mass mi, and assuming Fij = 0 for i=j, we model the forces in each dimension independently as
| (1) |
where the noise term W includes effects from external and internal sources. The first term on the right-hand side represents a drag force with damping coefficient c and the second term represents an attractive spring force towards the centroid with zero rest length spring constant k. Other unknown interactions between mosquitoes such as coordinated motion and collision avoidance are included in W.
Equation (1) has the form of a standard harmonic oscillator with natural frequency and damping ratio ξ subject to random disturbance W: i.e., , which can be rewritten in terms of the inertial velocity component as
| (2) |
The velocity autocorrelation coefficient of the system in Eq. (2) is a time-independent function of time lag defined as . A large value of N is obtained through multiple realizations of the same mosquito from different points in its trajectory; we justify this approach by observing that the statistics of a single mosquito trajectory resembles that of every other mosquito in the swarm. (We also verified that the value of is independent of sampling time t by computing at different times in each sequence.)
Note, the integral of is proportional to the spatial size of the swarm. In a diffusion process for which the spatial size grows with time, the velocity autocorrelation coefficient decorrelates with its initial value exponentially with time, resulting in a positive value. On the other hand, in a swarming process, the velocity autocorrelation coefficient is characterized by multiple zero crossings that ultimately result in little or no change in the swarm size (Okubo 1986).
In order to obtain an analytical form of , we assume that the disturbance W is uncorrelated in time and that its autocorrelation can be represented as . The velocity autocorrelation can be found using the Wiener-Kinchin theorem [28] and the impulse response of a deterministic second order system, given by , where is the Laplace transform of the system described by Eq. (2), is the two-sided inverse Laplace transform, and is the power spectral density of the input. The velocity autocorrelation function is
| (3) |
where and are the roots of the characteristic equation . For an underdamped system ( ), Eq. (2) simplifies to , where (Okubo 1986). The limiting case of for which captures the kinetic energy of the swarm per unit mass. A has units of power per unit mass and represents the overall level of motion in the swarm. We used the Levenberg-Marquardt algorithm (Nocedal and Wright 1999) to minimize the sum of square errors between empirical data and the model function to estimate the values of ξ and .
Measuring coordination between neighbors
The three-dimensional orientation of mosquito velocity is represented by a point on the unit sphere with azimuth θ and elevation ϕ. To identify the mean separation between two vectors on a unit sphere we sample such that and . (A uniform distribution of points on a sphere equally populates each area element ). We define the average velocity disagreement between each mosquito and its nth nearest neighbor as
| (4) |
where is the unit vector in the direction of motion of mosquito i, is the nth nearest neighbor of i, and N is the number of data points within a particular sequence. We computed this value for all mosquitoes in the reconstructed sequences to find the level of disagreement between successive neighbors within the swarm. For example, the average disagreement of parallel (with respect to anti-parallel) velocities is (with respect to ). Note that the average pair-wise disagreement in a uniformly distributed set of random points is .
Results
Three-dimensional position and velocity
The average difference in position between the automated tracker and manually generated solutions (generated for comparison by selecting the mosquito center manually in each frame) was 1.74 ± 0.56 cm in a swarm of ten mosquitoes. There were ten swarming sequences analyzed for this paper (see Table 1). The sequences are labeled according to the date of filming and the swarm number for that day.
Oscillatory motion
Figure 1 shows the position and velocity of a randomly chosen mosquito from the Sep. 1 (2) sequence. The oscillations along each dimension are representative of mosquito motion within the swarm (see Java-enabled visualizations of select swarms at http://cdcl.umd.edu/mosquito/maleonly_SI). The primary component of oscillation is about the swarm centroid, which itself exhibits little motion.
Figure 1.
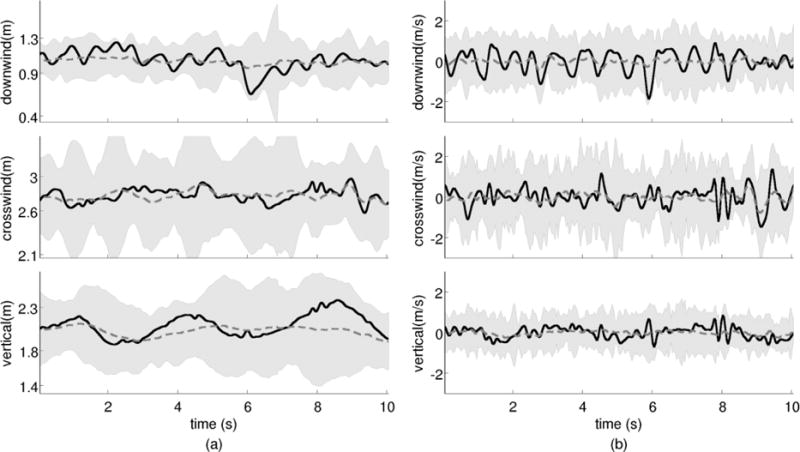
Three-dimensional position (a) and velocity (b) of a single mosquito (solid line) from Sep. 1, 2010 sequence that had a wind speed of 0.67 m/s in the compass direction 252°. The shaded region corresponds to bounds for position and velocity of all mosquitoes in the swarm, and the broken line is the mean. The origin of the inertial frame is located at the ground level under the camera rig.
The instantaneous size of the swarm (represented by three standard deviations of the positions of all mosquitoes in the swarm) shows that the swarm expands and contracts periodically along each dimension. We fit the average velocity autocorrelation to the model of a damped, noise-driven harmonic oscillator coupled to the swarm centroid (see Materials and Methods). Figures 2a and 2b show the velocity-autocorrelation model fits in each dimension for the sequences on Aug. 21 and Aug. 28, respectively, with the corresponding residual errors. Figure 2c shows the estimated values of and residual fitting error for each reconstructed sequence.
Figure 2.
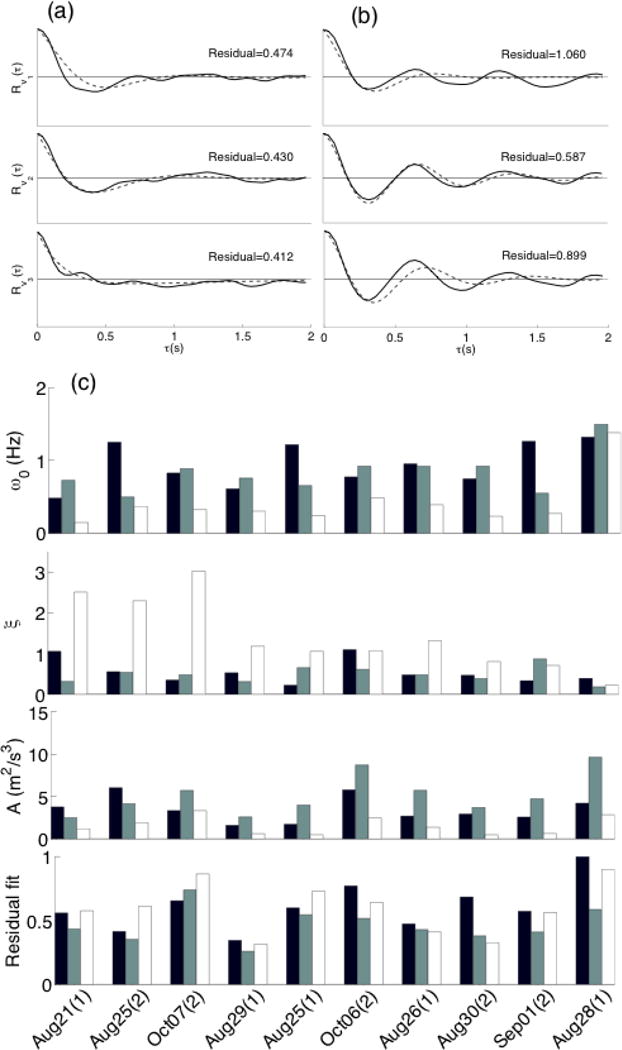
Velocity autocorrelation along downwind, crosswind, and vertical dimensions (solid black) and the respective function fits (dashed) for sequences from (a) Aug. 21 and (b) Aug. 28. The residual measure is the sum of the square error in the function fit. (c) Natural frequency ( ), damping ratio (ξ), overall level of motion (A) and residual fitting error for ten mosquito swarms sorted left to right in the order of wind speed. The inertial frame is oriented along downwind (black), crosswind (grey), and vertical (white), except for Aug. 21 for which the inertial frame is oriented north-south and east-west, wind speed was not available.
Figure 3 illustrates the difference between the horizontal and vertical movement of the mosquitoes using the average damping ratio ξ and natural frequency of the velocity autocorrelation model. Horizontal motion is distinguished from vertical motion by relatively lower damping and higher natural frequency, except the Aug. 28 sequence, which had the highest wind speed recorded during filming. On Aug. 28, the damping ratio was low and the natural frequency was high for both horizontal and vertical motion. Non-parametric Kruskal-Wallis tests show that the horizontal motion parameters are significantly different (p < 0.01) than the vertical motion parameters. Including the high-wind sequence, the maximum p-value between either of the horizontal dimensions and the vertical is 0.0025 for and 0.0032 for ξ, whereas the maximum p-value between the horizontal dimensions is 0.22 for and 0.76 for ξ. The average value of across all swarms was 1.02 Hz, 0.83 Hz, and 0.41 Hz along the downwind, crosswind and vertical directions respectively. The average values of ξ for the same directions were 0.48, 0.48, and 1.4, respectively. We see no discernible difference between M and S types, though PCR data were not available for the putative M types.
Figure 3.
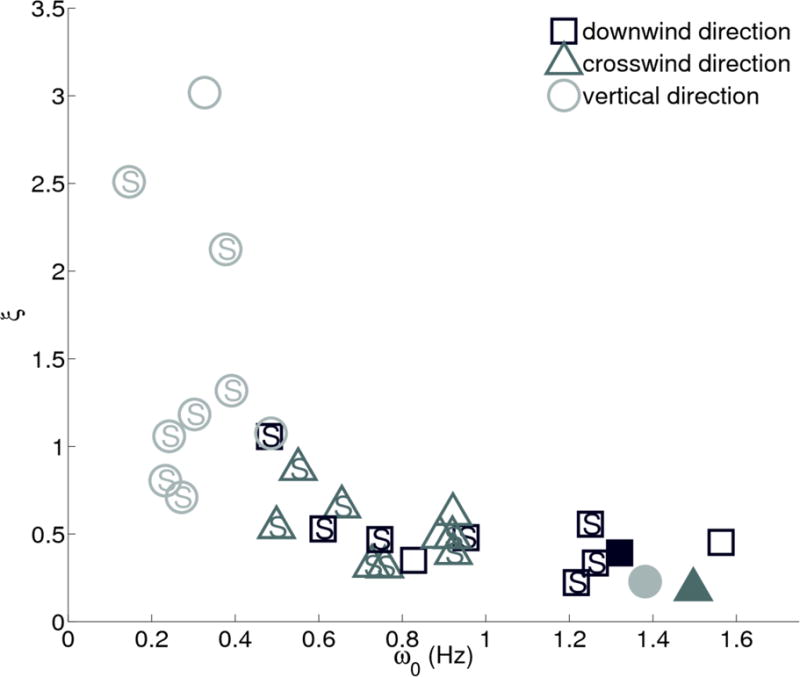
The plot of natural frequency ( ) versus damping ratio (ξ) for all swarms shows that the motion of the swarm is underdamped in the horizontal plane (square=downwind, triangle=crosswind) and overdamped in the vertical (circle). PCR results wherever available show the swarm molecular form. Solid markers are for Aug. 28, 2010 sequence with high wind.
Coordination between neighbors
To quantify the degree of coordination between neighboring mosquitoes we compute the average angle between their velocities in three dimensions. The disagreement value for random motion (83.6°) was greater than the average level of disagreement between each mosquito and its three closest neighbors in every swarm sequence. Further, the level of disagreement was lowest for the first nearest neighbor and increased with each successive neighbor in seven out of ten sequences. The average distance to the first nearest-neighbor across all swarms was 13 ±2.4 cm. Figure 4 shows the disagreement in direction of motion versus nearest-neighbor distance for each sequence. The average disagreement in the direction of motion of a mosquito with the first, second, and third nearest neighbor across all swarms was 74.5°, 75.6°, and 76.1° respectively. The sequence with the lowest level of disagreement (64.8°) in the direction of motion had the highest wind speed (Aug. 28). In three-dimensional reconstructions of the Aug. 28 sequence it is evident that the mosquitoes were flying in a synchronized, cyclic pattern (see supplementary video S1 of Aug. 28 swarm). We did not find any correlation between the level of disagreement and ambient wind-speed. In a separate experiment conducted on Oct 07, 2011, we subjected the swarm to artificial wind at 0.7 m/s using a calibrated window fan. The fan was held next to the cameras at a distance of approximately 1.5 m aimed directly at the swarm. We observed a drop in level of disagreement of approximately 6°. (Further analysis of these results is ongoing, so they are not included here.)
Figure 4.
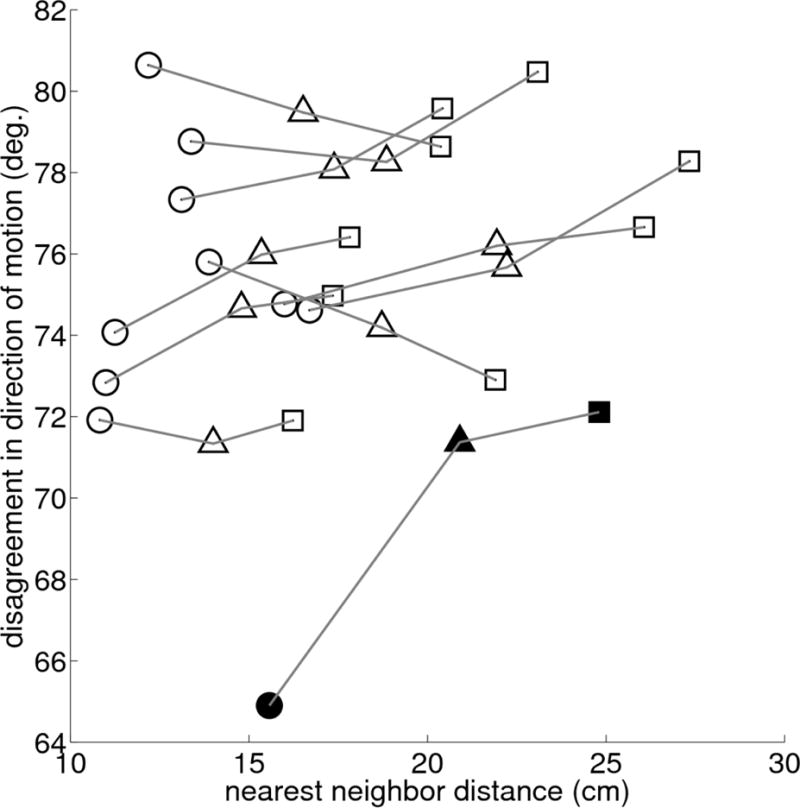
Mean first (circle), second (triangle), and third (square) nearest-neighbor distance versus average velocity disagreement for all swarms. Solid markers are for Aug. 28, 2010 sequence with high wind.
Discussion
We characterized the oscillatory dance of the malaria mosquito An. gambiae in natural mating swarms, finding divergent characteristic frequency and damping of motion the vertical direction as compared to the horizontal plane. We have also found possible evidence of coordination in movement between individual males and their nearest neighbors. These results were enabled by the large volume of three-dimensional tracking data on individual swarming males, previously unavailable.
We see a significant difference in the horizontal and vertical motion of An. gambiae across swarms, but no consistent differences between those composed of M-form and S-form males. The value of , an indicator of the stiffness of the attractive force towards the swarm centroid, is nearly two times larger in the horizontal plane than the vertical direction, indicating a greater tendency to pass through the approximate region of the centroid in the horizontal plane than the vertical direction. The presence of high wind changes this tendency, however, in that the vertical motion under those conditions also has high oscillatory frequency. We did not observe a similar pattern at the next highest wind speed recorded of 0.67 m/s, which points to a phase shift in the motion at certain value of ambient wind speed. The average natural frequency of 0.85 Hz along the horizontal plane means that the mosquitoes make one trip around the swarm in approximately one second, performing at the same time secondary oscillations at higher frequencies.
The damping ratio—which for a generic second-order system is independent from natural frequency—is representative of the resistance to motion in a particular direction. The damping ratio in the vertical direction was greater than one (overdamped) and more than twice the value in the horizontal plane, which was less than one (underdamped). There was no difference in the pattern of these two variables across dimensions between swarms composed of M-form versus S-form males, even though in the village of Donéguébougou the latter is known to swarm over bare ground and the former over a contrasting marker on the ground (Diabaté et al. 2009). With a ground marker, the observed difference between vertical and horizontal motion indicates a column-like region of attraction directly above the marker. However, in the case of swarms over bare ground the difference is still present. This indicates that, while attraction to the swarming site may be mediated by a marker for the M swarms (Charlwood et al. 2002) and is a currently unknown factor for the S swarms, the actual vertical and horizontal movement patterns of individuals within each swarm are probably driven separately. It is likely that the location and movement of other males impacts individual oscillations.
Interaction between neighboring mosquitoes, quantified as the level of disagreement in the direction of motion, shows that the nearest mosquitoes have the least disagreement in the majority of the cases. The lowest disagreement takes place in high wind when the whole swarm moves in a cyclic pattern. A possible explanation for this is that, beyond a given wind speed, the mosquitoes are subjected to a drag force that is nearly as large as their flight thrust force, thereby forcing them into an ordered pattern by bunching them together on the upwind leg of their circuit. This balancing of flight thrust force due to wind may justify the absence of correlation between wind-speed and level of disagreement. It also confirms the drop in the lowest level of disagreement within the same swarm we observed when a calibrated fan directed artificial wind towards the swarm with nearly the same speed as the highest wind speed.
Low levels of movement coordination, except for an exceptional windy circumstance, contrasts with other studies tracking individual movement in three dimensions over time where coordination can be seen out to the sixth nearest neighbor (Ballerini et al. 2008). Low coordination is, however, consistent with the biological role of the swarm as a lek, where constituent male evolutionary interests are aligned for bringing females to the aggregation, but at odds once she enters the swarm. Finally, the average distance between neighboring males (approximately 8 times the body length) is much larger than the 2 cm reported in male-female auditory interactions during flight (Pennetier et al. 2010). Indeed, the number of instances when two males were within an auditory range of each other of 2 cm was less than 1 percent across all swarms.
Supplementary Material
Acknowledgments
We would like to recognize the important contributions at many stages of this work of Tovi Lehmann of the Laboratory of Malaria and Vector Research (LMVR) at the National Institute of Allergy and Infectious Diseases, as well as the immense help from our experimental team at the Malaria Research and Training Center in Mali, especially Richard Sakai, Sékou Traoré and Adama Dao. We also gratefully acknowledge the travel support from Robert Gwadz of LMVR. We thank the anonymous reviewers for their detailed and constructive feedback. Finally, we would like to thank the residents of Donéguébogou for allowing us to film.
Contributor Information
Sachit Butail, Email: sb4304@nyu.edu.
Nicholas C. Manoukis, Email: nicholas.manoukis@ars.usda.gov.
Moussa Diallo, Email: moussad@icermali.org.
José M.C. Ribeiro, Email: jribeiro@niaid.nih.gov.
Derek A. Paley, Email: dpaley@umd.edu.
References cited
- Ballerini M, Cabibbo N, Candelier R, Cavagna A, Cisbani E, Giardina I, Lecomte V, et al. Interaction Ruling Animal Collective Behavior Depends on Topological Rather Than Metric Distance: Evidence from a Field Study. Proceedings of the National Academy of Sciences of the United States of America. 2008;105(4):1232–1237. doi: 10.1073/pnas.0711437105. [DOI] [PMC free article] [PubMed] [Google Scholar]
- Banas NS, Wang DP, Yen J. Experimental Validation of an Individual-Based Model for Zooplankton Swarming. Handbook of Scaling Methods in Aquatic Ecology Measurement, Analysis, Simulation. 2004:161–180. [Google Scholar]
- Berman Spring, Lindsey Quentin, Sakar Mahmut Selman, Kumar Vijay, Pratt Stephen C. Experimental Study and Modeling of Group Retrieval in Ants as an Approach to Collective Transport in Swarm Robotic Systems. Proceedings of the IEEE. 2011;99(9):1470–1481. [Google Scholar]
- Bouguet Jean-Yves. Camera Calibration Toolbox for Matlab. http://www.vision.caltech.edu/bouguetj/calib_doc/index.html.
- Butail S, Manoukis NC, Diallo M, Ribeiro JMC, Lehmann T, Paley DA. Reconstructing the Flight Kinematics of Swarming and Mating in Wild Mosquitoes. Journal of the Royal Society Interface. 2012;9(75):2624–2638. doi: 10.1098/rsif.2012.0150. [DOI] [PMC free article] [PubMed] [Google Scholar]
- Cavagna A, Cimarelli A, Giardina I, Parisi G, Santagati R, Stefanini F, Viale M. Scale-free Correlations in Starling Flocks. Proceedings of the National Academy of Sciences of the United States of America. 2010;107(26):11865–11870. doi: 10.1073/pnas.1005766107. [DOI] [PMC free article] [PubMed] [Google Scholar]
- Charlwood JD, Pinto J, Sousa CA, Madsen H, Ferreira C, do Rosario VE. The Swarming and Mating Behaviour of Anopheles Gambiae Ss (Diptera: Culicidae) from Sao Tome Island. Journal of Vector Ecology. 2002;27(2):178–183. [PubMed] [Google Scholar]
- Couzin ID, Krause J, James R, Ruxton GD, Franks NR. Collective Memory and Spatial Sorting in Animal Groups. Journal of Theoretical Biology. 2002;218(1):1–11. doi: 10.1006/jtbi.2002.3065. [DOI] [PubMed] [Google Scholar]
- Diabate Abdoulaye, Yaro Alpha S, Dao Adama, Diallo Moussa, Huestis Diana L, Lehmann Tovi. Spatial Distribution and Male Mating Success of Anopheles Gambiae Swarms. BMC Evolutionary Biology. 2011;11(1):184. doi: 10.1186/1471-2148-11-184. [DOI] [PMC free article] [PubMed] [Google Scholar]
- Diabaté A, Dao A, Yaro Alpha S, Adamou Abdoulaye, Gonzalez Rodrigo, Manoukis Nicholas C, Traore Sekou F, Gwadz Robert W, Lehmann Tovi. Spatial Swarm Segregation and Reproductive Isolation Between the Molecular Forms of Anopheles Gambiae. Proceedings of the Royal Society B: Biological Sciences. 2009:4215–4222. doi: 10.1098/rspb.2009.1167. [DOI] [PMC free article] [PubMed] [Google Scholar]
- Favia G, della Torre A, Bagayoko M, Lanfrancotti A, Sagnon N, Touré YT, Coluzzi M. Molecular Identification of Sympatric Chromosomal Forms of Anopheles Gambiae and Further Evidence of Their Reproductive Isolation. Insect Molecular Biology. 1997;6(4):377–383. doi: 10.1046/j.1365-2583.1997.00189.x. [DOI] [PubMed] [Google Scholar]
- Forgoston Eric, Schwartz Ira B. Delay-induced Instabilities in Self-propelling Swarms. Physical Review E. 2008;77(3) doi: 10.1103/PhysRevE.77.035203. [DOI] [PMC free article] [PubMed] [Google Scholar]
- Gibson Gabriella. Swarming Behaviour of the Mosquito Culex Pipiens Quinquefasciatus: a Quantitative Analysis. Physiological Entomology. 1985;10(3):283–296. doi: 10.1111/j.1365-3032.1985.tb00049.x. [DOI] [Google Scholar]
- Grunbaum D. Translating Stochastic Density-dependent Individual Behavior with Sensory Constraints to an Eulerian Model of Animal Swarming. Journal of Mathematical Biology. 1994;33(2):139–161. doi: 10.1007/BF00160177. [DOI] [PubMed] [Google Scholar]
- Ikawa T, Okabe H, Mori T, Urabe K, Ikeshoji T. A Method for Reconstructing Three-dimensional Positions of Swarming Mosquitoes. Journal of Insect Behavior. 1994;7(2):237–248. doi:dx.doi.org/10.1007/BF01990084. [Google Scholar]
- Lee CT, Hoopes MF, Diehl J. Non-local Concepts and Models in Biology. Journal of Theoretical Biology. 2001;210(2):201–219. doi: 10.1006/jtbi.2000.2287. [DOI] [PubMed] [Google Scholar]
- Manoukis NC, Diabate A, Abdoulaye A, Diallo M, Dao A, Yaro AS, Ribeiro JMC, Lehmann T. Structure and Dynamics of Male Swarms of Anopheles Gambiae. Journal of Medical Entomology. 2009;46(2):227–235. doi: 10.1603/033.046.0207. [DOI] [PMC free article] [PubMed] [Google Scholar]
- Mogilner Alexander, Edelstein-Keshet Leah. A Non-local Model for a Swarm. Journal of Mathematical Biology. 1999;38(6):534–570. doi: 10.1007/s002850050158. [DOI] [Google Scholar]
- Nocedal J, Wright SJ. Numerical Optimization. Springer Verlag; 1999. [Google Scholar]
- Okubo A. Dynamical Aspects of Animal Grouping: Swarms, Schools, Flocks, and Herds. Advances in Biophysics. 1986;22(0):1–94. doi: 10.1016/0065-227X(86)90003-1. [DOI] [PubMed] [Google Scholar]
- Parrish Julia K, Hammer William M. Animal Groups in Three Dimensions. Cambridge University Press; 1997. [Google Scholar]
- Pennetier Cédric, Warren Ben, Dabiré K Roch, Russell Ian J, Gibson Gabriella. ‘Singing on the Wing’ as a Mechanism for Species Recognition in the Malarial Mosquito Anopheles Gambiae. Current Biology. 2010 Jan;20(2):131–136. doi: 10.1016/j.cub.2009.11.040. [DOI] [PubMed] [Google Scholar]
- Reynolds JD, Gross MR. Costs and Benefits of Female Mate Choice: Is There a Lek Paradox? The American Naturalist. 1990;136(2):230–243. [Google Scholar]
- Shimoyama N, Sugawara K, Mizuguchi T, Hayakawa Y, Sano M. Collective Motion in a System of Motile Elements. Physical Review Letters. 1996;76(20):3870–3873. doi: 10.1103/PhysRevLett.76.3870. [DOI] [PubMed] [Google Scholar]
- Ward AJW, Herbert-Read JE, Sumpter DJT, Krause J. Fast and Accurate Decisions Through Collective Vigilance in Fish Shoals. Proceedings of the National Academy of Sciences of the United States of America. 2011;108(6):2312–2315. doi: 10.1073/pnas.1007102108. [DOI] [PMC free article] [PubMed] [Google Scholar]
Associated Data
This section collects any data citations, data availability statements, or supplementary materials included in this article.