

Abstract
Epidemiological evidence suggests that circulating 25-hydroxyvitamin D (25OHD) levels are inversely associated with hemoglobin (Hb) levels and anemia risk. We evaluated whether vitamin D supplementation improves Hb levels and reduces anemia risk in hypertensive patients. Two hundred patients with 25OHD levels <75 nmol/L who attended the Styrian Vitamin D Hypertension Trial were included, of whom 188 completed the trial. Patients randomly received 2800 IU vitamin D3 daily or a matching placebo for eight weeks. Initially, the prevalence of anemic status (Hb levels <12.5 g/dL) and deficient 25OHD levels (<30 nmol/L) was 6.5% and 7.5%, respectively. All anemic patients had 25OHD levels >50 nmol/L. The mean (95% confidence interval) vitamin D effect on Hb levels was 0.04 (−0.14 to 0.22) g/dL (P = 0.661). Moreover, vitamin D treatment did not influence anemic status significantly (P > 0.999). Likewise, vitamin D had no significant effect on Hb levels in the subgroups of anemic patients or in patients with initial 25OHD levels <30 nmol/L. In conclusion, a daily vitamin D supplement of 2800 IU for eight weeks did not improve Hb levels or anemic status in hypertensive patients. Future trials should focus on anemic patients with deficient 25OHD levels (e.g., <30 nmol/L). This trial is registered with clinicaltrials.gov [NCT02136771].
1. Introduction
Anemia is a global health problem [1] and an independent risk factor for increased morbidity and mortality in various groups of patients, especially in patients with chronic diseases and in the elderly [2]. Low levels of 25-hydroxyvitamin D (25OHD) are also highly prevalent among these patients [3].
Recent epidemiological evidence suggests that circulating 25OHD is inversely associated with hemoglobin (Hb) levels [4–15]. The risk of anemia is highest at deficient 25OHD levels (i.e., <30 nmol/L) and lowest at 25OHD levels of 50 to 125 nmol/L [4, 6, 15].
In chronic kidney disease (CKD) patients, some nonrandomized intervention studies could already show that intravenous administration of activated vitamin D (1,25-dihydroxyvitamin D3 = 1,25(OH)2D3) is associated with an increase in Hb levels within 12 months of treatment and a reduced need for erythropoietin (EPO) [16, 17]. Moreover, intravenous 1,25(OH)2D3 administration was associated with a decreased weekly EPO dose of 50% [18]. Regarding Hb levels, similar results have been obtained in hemodialysis patients with oral alfacalcidol (1α-vitamin D3) after 8 weeks [19] and also after 12 and 18 months of treatment [20]. In hemodialysis patients, high-dose oral vitamin D2 (50,000 IU monthly) was associated with dose-reductions in erythropoiesis-stimulating agents (ESA), while Hb concentrations remained unchanged [21, 22]. In children with CKD stage 5 and 25OHD levels <75 nmol/L, 12 weeks of vitamin D2 treatment in conjunction with 1,25(OH)2D3 was associated with a significantly reduced dose of ESA required to treat the children [23]. In anemic patients with preserved kidney function, however, one single intramuscular bolus of 600,000 IU vitamin D3 did not influence Hb levels [24]. Nevertheless, it is noteworthy that in general populations the effect of high-dose bolus administration of vitamin D on clinical outcomes has been questioned [25].
The purpose of the present study was to determine the effect of a daily vitamin D3 supplement on Hb levels in a group of hypertensive patients with preserved kidney function and inadequate 25OHD levels.
2. Methods
2.1. Study Design
This is a secondary analysis of the Styrian Vitamin D Hypertension Trial of a postspecified endpoint. The study was a randomized, double-blind, placebo-controlled, single-center trial which took place at the outpatient clinic at the Division of Endocrinology and Metabolism, Medical University of Graz, Austria. Major study results have already been published elsewhere [26]. The study was registered at EudraCT (number 2009-018125-70) and clinicaltrials.gov (NCT02136771). All study participants gave written informed consent. The study was approved by the Ethics Committee of the Medical University of Graz, Austria.
2.2. Participants
Two hundred study participants (106 men and 94 women) were recruited from the clinics of the Department of Cardiology and the Department of Internal Medicine, Division of Endocrinology and Metabolism, Medical University of Graz, Austria, from June 2011 to August 2014. Eligible study participants were adults aged 18 years or older with a serum 25OHD concentration below 75 nmol/L and arterial hypertension. Pregnant or lactating women were excluded as well as patients with hypercalcemia (serum calcium >2.65 mmol/L), regular vitamin D intake >880 IU per day during the last four weeks before the study, estimated glomerular filtration rate (eGFR) <15 mL/min per 1.73 m2, drug intake as part of another clinical study, acute coronary syndrome or cerebrovascular event in the previous two weeks, 24-hour systolic BP >160 mm Hg or <120 mm Hg, 24-hour diastolic BP >100 mm Hg, change in hypertensive treatment (drugs or lifestyle) in the previous four weeks or planned changes in antihypertensive treatment during the study, any disease with an estimated life expectancy of <1 year, any clinically significant acute disease requiring drug treatment, and chemotherapy or radiation therapy.
2.3. Intervention
Eligible study participants were randomly allocated to receive 2800 IU (70 μg) cholecalciferol as seven oily drops per day (Oleovit D3, Fresenius Kabi Austria, Graz, Austria) or a matching placebo for eight weeks. The dose of 2,800 IU vitamin D per day was chosen because a rule of thumb suggests that vitamin D supplementation of 1,000 IU increases 25OHD levels by approximately 25 nmol/L [27]. Given that a commonly used normal range of 25OHD is 75 to 150 nmol/L [28] we conclude that a supplementation of 2,800 IU daily may be sufficient to increase the 25OHD level of most study participants to target ranges without causing supraphysiological 25OHD levels. One hundred patients were assigned to the intervention group and 100 patients to the control group. Randomization was performed by web-based software (http://www.randomizer.at/) with a permuted block randomization (block size of 10 and stratification according to sex).
2.4. Endpoints
The primary outcome measures were Hb levels and anemia. In accordance with earlier classifications [4, 6, 29], Hb concentrations <12.5 g/dL were considered as anemic, which corresponded to the average threshold value of the World Health Organization gender-based definition (<13.0 g/dL in men and <12.0 g/dL in women).
2.5. Biochemical Measurements
Blood sampling was performed in the morning between 7 and 11 am after an overnight fast. All blood samples were either measured at least four hours after blood collection or immediately stored at −20°C until analysis. Measurement of 25OHD was performed by chemiluminescence assay (IDS-iSYS 25-hydroxyvitamin D assay; Immunodiagnostic Systems Ltd., Boldon, UK) on an IDS-iSYS multidiscipline automated analyzer. Lower and upper quantification limits were 17.5 nmol/L and 312.5 nmol/L, respectively. All hematological parameters were measured on a Sysmex® XE-5000 automated hematology analyzer (Sysmex America, Inc., Mundelein, IL, USA). eGFR was calculated using Modification of Diet in Renal Disease [30]. The measurements of other biochemical parameters have been described elsewhere [26]. In accordance with published data [31, 32] we categorized 25OHD levels <30 nmol/L as deficient, 30–49.9 nmol/L as insufficient, and 50 to 74.9 nmol/L as borderline.
2.6. Statistics
Categorical variables are reported as a percentage of observations. Normally distributed continuous data are shown as means with standard deviation. We used the Kolmogorov-Smirnov test to check normal data distribution. Normal distribution was a consideration when probability values were >0.05. Variables with a skewed distribution are shown as medians with interquartile range. Change from baseline data is shown as means and 95% confidence interval (CI). We used the McNemar test and Fisher's exact test, respectively, to assess differences in anemic status within and between groups. The unpaired t-test or chi-squared test was used for group comparisons at baseline. Skewed variables were normalized by logarithmic transformation before use in parametric statistical analysis. ANCOVA with adjustments for baseline values was used to test for differences in the outcome variables between the vitamin D and the placebo group at the follow-up visit. We considered P values < 0.05 (two-sided) as statistically significant. Analyses were performed using SPSS version 21.0 (SPSS, Inc., Chicago, IL, USA).
3. Results
Baseline characteristics of the study participants are shown in Table 1. In both groups, mean Hb values were clearly above the anemia threshold of 12.5 g/dL. At baseline, the proportion of anemia in the vitamin D and placebo groups was 9.0% and 4.0%, respectively (P = 0.152).
Table 1.
Baseline characteristics of the study groups.
| Characteristics | Vitamin D group | Placebo group | P value |
|---|---|---|---|
| (n = 100) | (n = 100) | ||
| Females (%) | 46 | 48 | 0.777 |
| Age (years) | 60.5 ± 10.9 | 59.7 ± 11.4 | 0.607 |
| Anemic subjects1 (%) | 9 | 4 | 0.152 |
| BMI (kg/m2) | 30.4 ± 4.4 | 30.4 ± 6.2 | 0.967 |
| Active smoker (%) | 19 | 14 | 0.341 |
| Previous MI (%) | 8 | 5 | 0.390 |
| Previous stroke (%) | 9 | 7 | 0.602 |
| Diabetes mellitus (%) | 32 | 41 | 0.186 |
| 25OHD (nmol/L) | 54.5 ± 13.6 | 51.0 ± 14.2 | 0.073 |
| PTH (pmol/L) | 5.2 (4.2–6.5) | 5.5 (4.2–7.0) | 0.931 |
| Phosphate (mg/dL) | 2.9 ± 0.5 | 3.0 ± 0.5 | 0.085 |
| Calcium (mmol/L) | 2.37 ± 0.10 | 2.37 ± 0.11 | 0.989 |
| Hemoglobin (g/dL) | 14.4 ± 1.3 | 14.4 ± 1.4 | 0.665 |
| Hematocrit (%) | 41.1 ± 3.3 | 41.5 ± 3.4 | 0.329 |
| Leukocyte counts (109/L) | 5.9 (5.1–7.0) | 6.0 (5.0–7.5) | 0.817 |
| Erythrocyte counts (1012/L) | 4.8 ± 0.4 | 4.9 ± 0.4 | 0.237 |
| MCV (µm3) | 86.1 ± 4.4 | 85.7 ± 4.0 | 0.457 |
| MCH (pg Hb/red blood cell) | 30.1 ± 1.9 | 29.8 ± 1.6 | 0.234 |
| MCHC (g/L) | 34.9 ± 1.0 | 34.7 ± 1.1 | 0.207 |
| Platelets (109/L) | 239 ± 64 | 232 ± 50 | 0.442 |
| MPV (fl) | 10.7 ± 1.0 | 10.7 ± 0.9 | 0.572 |
| CRP (mg/L) | 2.3 (1.13–3.8) | 1.4 (0.9–3.4) | 0.044 |
| eGFR (mL/min/1.73 m2) | 80.0 ± 17.9 | 77.2 ± 17.9 | 0.272 |
| Vitamin D supplement (%) | 5 | 9 | 0.268 |
| ACE-inhibitor (%) | 25 | 38 | 0.048 |
| AT II blocker (%) | 33 | 31 | 0.762 |
| Diuretic (%) | 42 | 48 | 0.394 |
| Beta-blocker (%) | 44 | 49 | 0.478 |
| Statin (%) | 26 | 32 | 0.350 |
| Calcium channel blocker (%) | 27 | 25 | 0.747 |
1Hemoglobin <12.5 g/dL.
25OHD: 25-hydroxyvitamin D; ACE: angiotensin converting enzyme; AT: angiotensin; BMI: body mass index; CAD: coronary artery disease; CRP: C-reactive protein; eGFR: estimated globular filtration rate; MCV: mean corpuscular volume; MCH: mean corpuscular hemoglobin; MCHC: mean corpuscular hemoglobin concentration; MI: myocardial infarction; MPV: mean platelet volume; PTH: parathyroid hormone.
Regarding 25OHD levels, 6.0% of the vitamin D group and 9.0% of the placebo group had deficient levels. The proportion of insufficient 25OHD levels was 27.0% and 36.0%, respectively. In the remaining 67.0% and 55.0%, the vitamin D status was classified as borderline.
Of the 200 participants, 188 terminated the study as planned. Table 2 shows the treatment results on biochemical parameters.
Table 2.
Results of vitamin D treatment on hematological parameters, calcium and phosphate metabolism, and additional parameters in hypertensive subjects.
| Characteristics | Vitamin D group (n = 93) | Placebo group (n = 95) | Treatment effect | P value2 | ||||
|---|---|---|---|---|---|---|---|---|
| Baseline | Follow-up (8 weeks) | Mean change from baseline1 | Baseline | Follow-Up (8 weeks) | Mean change from baseline1 | |||
| Hematological parameters | ||||||||
| Hemoglobin (g/dL) | 14.4 ± 1.3 | 14.3 ± 1.3 | −0.1 (−0.18 to 0.05) | 14.4 ± 1.4 | 14.3 ± 1.3 | −0.1 (−0.25 to 0.04) | 0.04 (−0.14 to 0.22) | 0.661 |
| Hematocrit (%) | 41.1 ± 3.2 | 41.1 ± 3.3 | 0.02 (−0.31 to 0.36) | 41.5 ± 3.5 | 41.3 ± 3.2 | −0.2 (−0.59 to 0.19) | 0.16 (−0.33 to 0.65) | 0.514 |
| Erythrocytes (1012/L) | 4.8 ± 0.4 | 4.8 ± 0.4 | −0.02 (−0.05 to 0.02) | 4.9 ± 0.4 | 4.8 ± 0.4 | −0.04 (−0.09 to 0.00) | 0.01 (−0.05 to 0.07) | 0.691 |
| MCV (µm3) | 86.4 ± 4.3 | 86.7 ± 4.6 | 0.3 (−0.14 to 0.72) | 85.6 ± 4.0 | 86.0 ± 4.0 | 0.3 (−0.09 to 0.77) | 0.01 (−0.59 to 0.61) | 0.971 |
| MCH (pg Hb/RBC) | 30.2 ± 1.8 | 29.9 ± 1.7 | −0.04 (−0.16 to 0.08) | 29.7 ± 1.6 | 29.7 ± 1.6 | 0.05 (−0.07 to 0.18) | −0.08 (−0.25 to 0.09) | 0.890 |
| MCHC (g/L) | 35.0 ± 1.0 | 34.8 ± 1.1 | −0.2 (−0.3 to 0.00) | 34.7 ± 1.1 | 34.7 ± 1.1 | −0.09 (−0.3 to 0.09) | −0.01 (−0.24 to 0.22) | 0.938 |
| Leucocytes (109/L) | 5.9 (5.1–7.0) | 6.0 (5.0–7.2) | 0.04 (−0.18 to 0.26) | 6.0 (5.0–7.5) | 5.8 (5.0–6.9) | −0.1 (−0.31 to 0.12) | −0.13 (−0.17 to 0.42) | 0.291 |
| Platelets (109/L) | 237 ± 62 | 240 ± 64 | 2.9 (−1.6 to 7.4) | 231 ± 50 | 232 ± 53 | 1.7 (−3.8 to 7.1) | 1.6 (−5.4 to 8.6) | 0.651 |
| Mean platelet volume (fl) | 10.7 ± 1.0 | 10.7 ± 0.9 | 0.01 (−0.08 to 0.09) | 10.8 ± 0.9 | 10.8 ± 0.9 | −0.02 (−0.1 to 0.08) | 0.01 (−0.12 to 0.13) | 0.887 |
| Calcium and phosphate metabolism | ||||||||
| 25-Hydroxyvitamin D (nmol/L) | 54.9 ± 13.6 | 90.3 ± 18.3 | 35.4 (31.2 to 39.6) | 50.8 ± 14.2 | 59.0 ± 22.1 | 8.1 (4.6 to 11.7) | 28.7 (23.5 to 34.2) | <0.001 |
| Parathyroid hormone (pmol/L) | 5.2 (4.3–6.5) | 4.8 (4.0–5.8) | −0.4 (−0.69 to −0.17) | 5.4 (4.1–6.8) | 5.3 (4.1–7.0) | 0.18 (−0.13 to 0.49) | −0.60 (−0.99 to −0.22) | 0.003 |
| Phosphate (mg/mL) | 2.9 ± 0.5 | 3.0 ± 0.5 | 0.1 (0.02 to 0.22) | 3.0 ± 0.5 | 3.1 ± 0.5 | 0.09 (−0.02 to 0.19) | −0.01 (−0.14 to 0.11) | 0.823 |
| Calcium (mmol/L) | 2.37 ± 0.1 | 2.37 ± 0.1 | 0.00 (−0.02 to 0.02) | 2.37 ± 0.1 | 2.35 ± 0.1 | −0.01 (−0.03 to 0.01) | −0.01 (−0.03 to 0.01) | 0.259 |
| Additional parameters | ||||||||
| C-reactive protein (mg/L) | 2.1 (0.9–3.8) | 2.2 (1.0–4.2) | 0.3 (−0.6 to 1.2) | 1.4 (0.8–3.0) | 1.4 (0.6–4.1) | 0.2 (−0.2 to 0.6) | 0.15 (−0.69 to 1.2) | 0.598 |
| eGFR (mL/min/1.732) | 80.5 ± 18.1 | 77.9 ± 18.8 | −2.7 (−5.0 to −0.4) | 77.5 ± 17.6 | 76.7 ± 16.9 | −0.9 (−3.0 to 1.3) | −1.3 (−4.3 to 1.7) | 0.398 |
1Change from baseline data is shown as means and 95% confidence interval.
2ANCOVA with adjustments for baseline values was used to test for differences in the outcome variables between the vitamin D and the placebo group.
MCV: mean corpuscular volume; MCH: mean corpuscular hemoglobin; Hb: hemoglobin; RBC: red blood cell; MCHC: mean corpuscular hemoglobin concentration; eGFR: estimated glomerular filtration rate.
Circulating 25OHD increased on average by 35.4 nmo/L (95% CI: 31.2 to 39.6 nmol/L) in the treatment group and 8.1 nmol/L (95% CI: 4.6 to 11.7 nmol/L) in the placebo group (P < 0.001). There was no significant vitamin D effect on Hb levels (Table 2). In both study groups, Hb levels remained almost constant. Moreover, vitamin D treatment did not influence anemic status significantly (P > 0.999). In detail, the percentage of anemic subjects remained constant in the vitamin D group (P > 0.999) and increased only slightly in the placebo group (P > 0.999) (Figure 1). Vitamin D treatment had no effect on other hematological parameters (Table 2).
Figure 1.
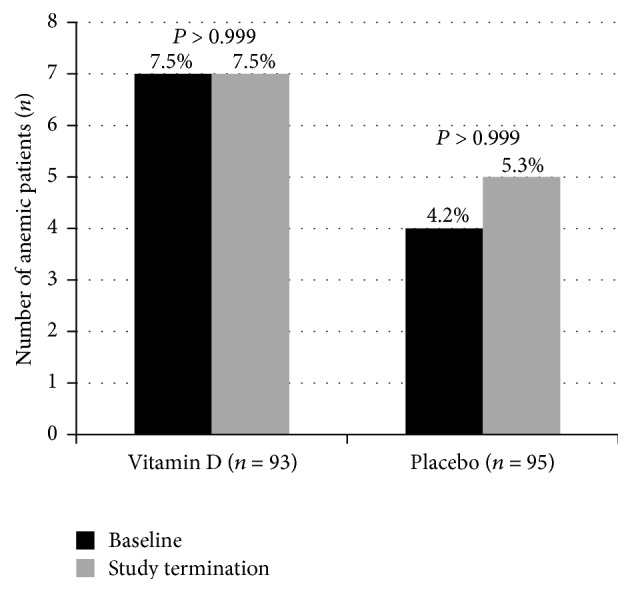
Anemia proportion in participants of the Styrian Vitamin D Hypertension Trial at baseline and study termination (by study group). P values indicated within study group results.
All anemic patients had initial 25OHD levels >50 nmol/L. Vitamin D treatment had no effect on Hb levels and other hematological parameters in anemic patients (see Table S1 in Supplementary Material available online at http://dx.doi.org/10.1155/2016/6836402). Moreover, there was no vitamin D effect on Hb levels and other hematological parameters in the group of subjects with initial 25OHD levels <30 nmol/L (Table S2).
There was, however, a significant vitamin D effect on PTH levels, with suppressed PTH levels in the vitamin D group (Table 2). Vitamin D treatment did not influence serum calcium and phosphate levels.
4. Discussion
This study showed that a daily vitamin D supplement of 2800 IU for 8 weeks had no effect on Hb levels or anemia risk in hypertensive patients with 25OHD levels <75 nmol/L.
Our study has several strengths. First, this is a randomized, placebo-controlled trial. In addition, compared with previous interventional studies we were able to include a large number of patients. Next, we included only patients with relatively low circulating 25OHD levels. Moreover, the daily vitamin D dose was sufficient to increase in-study 25OHD levels on average clearly above 75 nmol/L. This value is recommended by many endocrinologists and vitamin D researchers as the lower target level for various clinical outcomes [33, 34]. Our study also has some limitations. First, the prevalence of anemic patients at baseline was low. Second, the study duration of 8 weeks was relatively short, given that the half-life of red blood cells in circulation is 3 months. Third, we have no data on circulating levels of 1,25(OH)2D, which is the active, hormonal form of vitamin D.
Generally, evidence is increasing that 1,25(OH)2D can stimulate erythropoiesis in red blood cell precursor cells by increasing EPO sensitivity. Furthermore, 1,25(OH)2D can upregulate proliferation of hematopoietic progenitor cells [35, 36]. Nevertheless, our findings with plain vitamin D in patients with preserved kidney function do not support the beneficial impact on Hb levels of earlier studies with activated vitamin D in CKD patients [16, 17]. It is, however, noteworthy that in CKD patients the prevalence of anemia is high and circulating 1,25(OH)2D levels are low. Moreover, a recent meta-analysis of randomized controlled trials has demonstrated that, after administration of vitamin D or activated vitamin D, the increase in circulating 1,25(OH)2D tends to be much higher in CKD patients than in non-CKD patients [37]. In our study, a vitamin D-induced increase in circulating 1,25(OH)2D levels may have been blunted by the suppressed PTH levels, and this may have contributed, at least in part, to the null effect on Hb levels.
In the present study, the prevalence of deficient 25OHD levels was low. Moreover, it was a surprising finding that all 13 anemic patients had initial 25OHD levels >50 nmol/L. Generally, epidemiological evidence suggests that circulating 25OHD levels are inversely associated with Hb levels and anemia risk [4, 6]. A recent meta-analysis of retrospective observational studies showed that, compared with individuals with adequate 25OHD levels, low 25OHD levels were associated with an odds ratio for anemia of 2.25 (95% CI: 1.47–3.44) [38]. The cut-off for low 25OHD levels was 50 nmol/L in 5 out of the 7 included studies and 75 nmol/L in the remaining 2 studies. Only individuals without chronic diseases were included in that meta-analysis. However, two large studies in patients with cardiovascular disease [4, 6] indicate that Hb levels are only significantly affected if circulating 25OHD levels are in the deficiency range. Also of note is the fact that observational studies have shown circulating 1,25(OH)2D to be a better predictor of anemia than circulating 25OHD [4, 5, 39]. Altogether, data indicate that especially anemic patients with deficient 25OHD levels and low circulating 1,25(OH)2D levels may benefit from improved vitamin D status.
5. Conclusions
In conclusion, our data demonstrate that a daily vitamin D supplement of 2800 IU for 8 weeks does not increase Hb levels in nonanemic hypertensive patients with 25OHD levels <75 nmol/L. Future studies in this field should focus on anemic individuals with deficient 25OHD levels.
Supplementary Material
In a group of hypertensive subjects, vitamin D supplementation did not result in changes of hematological parameters, neither if only anemic patients were considered nor if only individuals with initial 25OHD levels <30 nmol/L were included in the analysis.
Conflict of Interests
The authors declare that there is no conflict of interests regarding the publication of this paper.
References
- 1.McLean E., Cogswell M., Egli I., Wojdyla D., de Benoist B. Worldwide prevalence of anaemia, WHO vitamin and mineral nutrition information system, 1993–2005. Public Health Nutrition. 2009;12(4):444–454. doi: 10.1017/s1368980008002401. [DOI] [PubMed] [Google Scholar]
- 2.Nissenson A. R., Goodnough L. T., Dubois R. W. Anemia: not just an innocent bystander? Archives of Internal Medicine. 2003;163(12):1400–1404. doi: 10.1001/archinte.163.12.1400. [DOI] [PubMed] [Google Scholar]
- 3.Zittermann A., Prokop S. The role of vitamin D for cardiovascular disease and overall mortality. Advances in Experimental Medicine and Biology. 2014;810:106–119. doi: 10.1007/978-1-4939-0437-2_6. [DOI] [PubMed] [Google Scholar]
- 4.Ernst J. B., Becker T., Kuhn J., Gummert J. F., Zittermann A. Independent association of circulating vitamin d metabolites with anemia risk in patients scheduled for cardiac surgery. PLoS ONE. 2015;10(4) doi: 10.1371/journal.pone.0124751.e0124751 [DOI] [PMC free article] [PubMed] [Google Scholar]
- 5.Zittermann A., Jungvogel A., Prokop S., et al. Vitamin D deficiency is an independent predictor of anemia in end-stage heart failure. Clinical Research in Cardiology. 2011;100(9):781–788. doi: 10.1007/s00392-011-0312-5. [DOI] [PubMed] [Google Scholar]
- 6.Zittermann A., Kuhn J., Dreier J., et al. Association of 25-hydroxyvitamin D with anemia risk in patients scheduled for cardiac surgery. International Journal of Laboratory Hematology. 2014;36(1):29–36. doi: 10.1111/ijlh.12112. [DOI] [PubMed] [Google Scholar]
- 7.Perlstein T. S., Pande R., Berliner N., Vanasse G. J. Prevalence of 25-hydroxyvitamin D deficiency in subgroups of elderly persons with anemia: association with anemia of inflammation. Blood. 2011;117(10):2800–2806. doi: 10.1182/blood-2010-09-309708. [DOI] [PubMed] [Google Scholar]
- 8.Patel N. M., Gutiérrez O. M., Andress D. L., Coyne D. W., Levin A., Wolf M. Vitamin D deficiency and anemia in early chronic kidney disease. Kidney International. 2010;77(8):715–720. doi: 10.1038/ki.2009.551. [DOI] [PubMed] [Google Scholar]
- 9.Smith E. M., Alvarez J. A., Martin G. S., Zughaier S. M., Ziegler T. R., Tangpricha V. Vitamin d deficiency is associated with anaemia among african americans in a us cohort. British Journal of Nutrition. 2015;113(11):1732–1740. doi: 10.1017/s0007114515000999. [DOI] [PMC free article] [PubMed] [Google Scholar]
- 10.Sim J. J., Lac P. T., Liu I. L. A., et al. Vitamin D deficiency and anemia: a cross-sectional study. Annals of Hematology. 2010;89(5):447–452. doi: 10.1007/s00277-009-0850-3. [DOI] [PMC free article] [PubMed] [Google Scholar]
- 11.Lee J. A., Hwang J. S., Hwang I. T., Kim D. H., Seo J. H., Lim J. S. Low vitamin d levels are associated with both iron deficiency and anemia in children and adolescents. Journal of Pediatric Hematology/Oncology. 2015;32(2):99–108. doi: 10.3109/08880018.2014.983623. [DOI] [PubMed] [Google Scholar]
- 12.Atkinson M. A., Melamed M. L., Kumar J., et al. Vitamin D, race, and risk for anemia in children. Journal of Pediatrics. 2014;164(1):153.e1–158.e1. doi: 10.1016/j.jpeds.2013.08.060. [DOI] [PMC free article] [PubMed] [Google Scholar]
- 13.Kendrick J., Targher G., Smits G., Chonchol M. 25-Hydroxyvitamin d deficiency and inflammation and their association with hemoglobin levels in chronic kidney disease. American Journal of Nephrology. 2009;30(1):64–72. doi: 10.1159/000202632. [DOI] [PubMed] [Google Scholar]
- 14.Kiss Z., Ambrus C., Almasi C., et al. Serum 25(OH)-cholecalciferol concentration is associated with hemoglobin level and erythropoietin resistance in patients on maintenance hemodialysis. Nephron—Clinical Practice. 2011;117(4):c373–c378. doi: 10.1159/000321521. [DOI] [PubMed] [Google Scholar]
- 15.Yoo E.-H., Cho H.-J. Prevalence of 25-hydroxyvitamin d deficiency in korean patients with anemia. Journal of Clinical Laboratory Analysis. 2015;29(2):129–134. doi: 10.1002/jcla.21740. [DOI] [PMC free article] [PubMed] [Google Scholar]
- 16.Goicoechea M., Vazquez M. I., Ruiz M. A., Gomez-Campdera F., Perez-García R., Valderrábano F. Intravenous calcitriol improves anaemia and reduces the need for erythropoietin in haemodialysis patients. Nephron. 1998;78(1):23–27. doi: 10.1159/000044877. [DOI] [PubMed] [Google Scholar]
- 17.Neves P. L., Triviño J., Casaubon F., et al. Elderly patients on chronic hemodialysis with hyperparathyroidism: increase of hemoglobin level after intravenous calcitriol. International Urology and Nephrology. 2006;38(1):175–177. doi: 10.1007/s11255-004-1563-0. [DOI] [PubMed] [Google Scholar]
- 18.Nazem A. K., Makó J. The effect of calcitriol on renal anaemia in patients undergoing long-term dialysis. International Urology and Nephrology. 1997;29(1):119–127. doi: 10.1007/bf02551427. [DOI] [PubMed] [Google Scholar]
- 19.Djordjevic V., Radivojevic J., Stefanovic V. Improvement of anemia in hemodialysis patients after pulse oral 1-alpha-d3 treatment. Clinical Nephrology. 2002;57(6):487–488. doi: 10.5414/cnp57487. [DOI] [PubMed] [Google Scholar]
- 20.Albitar S., Genin R., Fen-Chong M., Serveaux M.-O., Schohn D., Chuet C. High-dose alfacalcidol improves anaemia in patients on haemodialysis. Nephrology Dialysis Transplantation. 1997;12(3):514–518. doi: 10.1093/ndt/12.3.514. [DOI] [PubMed] [Google Scholar]
- 21.Kumar V. A., Kujubu D. A., Sim J. J., Rasgon S. A., Yang P. S. Vitamin D supplementation and recombinant human erythropoietin utilization in vitamin D-deficient hemodialysis patients. Journal of Nephrology. 2011;24(1):98–105. doi: 10.5301/jn.2010.1830. [DOI] [PubMed] [Google Scholar]
- 22.Saab G., Young D. O., Gincherman Y., Giles K., Norwood K., Coyne D. W. Prevalence of vitamin D deficiency and the safety and effectiveness of monthly ergocalciferol in hemodialysis patients. Nephron Clinical Practice. 2007;105(3):c132–c138. doi: 10.1159/000098645. [DOI] [PubMed] [Google Scholar]
- 23.Rianthavorn P., Boonyapapong P. Ergocalciferol decreases erythropoietin resistance in children with chronic kidney disease stage 5. Pediatric Nephrology. 2013;28(8):1261–1266. doi: 10.1007/s00467-013-2431-x. [DOI] [PubMed] [Google Scholar]
- 24.Sooragonda B., Bhadada S. K., Shah V. N., Malhotra P., Ahluwalia J., Sachdeva N. Effect of vitamin d replacement on hemoglobin concentration in subjects with concurrent iron-deficiency anemia and vitamin d deficiency: a randomized, single-blinded, placebo-controlled trial. Acta Haematologica. 2015;133(1):31–35. doi: 10.1159/000357104. [DOI] [PubMed] [Google Scholar]
- 25.Zheng Y. T., Cui Q. Q., Hong Y. M., Yao W. G. A meta-analysis of high dose, intermittent vitamin D supplementation among older adults. PLoS ONE. 2015;10(1) doi: 10.1371/journal.pone.0115850.e0115850 [DOI] [PMC free article] [PubMed] [Google Scholar]
- 26.Pilz S., Gaksch M., Kienreich K., et al. Effects of vitamin d on blood pressure and cardiovascular risk factors: a randomized controlled trial. Hypertension. 2015;65(6):1195–1201. doi: 10.1161/HYPERTENSIONAHA. [DOI] [PubMed] [Google Scholar]
- 27.Heaney R. P. Vitamin D in health and disease. Clinical Journal of the American Society of Nephrology. 2008;3(5):1535–1541. doi: 10.2215/cjn.01160308. [DOI] [PMC free article] [PubMed] [Google Scholar]
- 28.Holick M. F. Vitamin D deficiency. The New England Journal of Medicine. 2007;357(3):266–281. doi: 10.1056/nejmra070553. [DOI] [PubMed] [Google Scholar]
- 29.Karkouti K., Wijeysundera D. N., Beattie W. S. Risk associated with preoperative anemia in cardiac surgery: a multicenter cohort study. Circulation. 2008;117(4):478–484. doi: 10.1161/circulationaha.107.718353. [DOI] [PubMed] [Google Scholar]
- 30.Levey A. S., Bosch J. P., Lewis J. B., Greene T., Rogers N., Roth D. A more accurate method to estimate glomerular filtration rate from serum creatinine: a new prediction equation. Modification of diet in renal disease study group. Annals of Internal Medicine. 1999;130(6):461–470. doi: 10.7326/0003-4819-130-6-199903160-00002. [DOI] [PubMed] [Google Scholar]
- 31.Zittermann A., Kuhn J., Dreier J., Knabbe C., Gummert J. F., Börgermann J. Vitamin D status and the risk of major adverse cardiac and cerebrovascular events in cardiac surgery. European Heart Journal. 2013;34(18):1358–1364. doi: 10.1093/eurheartj/ehs468. [DOI] [PubMed] [Google Scholar]
- 32.Zittermann A., Kuhn J., Ernst J. B., et al. 25-hydroxyvitamin D, 1,25-dihydroxyvitamin D and postoperative outcome in cardiac surgery. Journal of Clinical Endocrinology and Metabolism. 2015;100(1):72–80. doi: 10.1210/jc.20143013. [DOI] [PubMed] [Google Scholar]
- 33.Souberbielle J.-C., Body J.-J., Lappe J. M., et al. Vitamin D and musculoskeletal health, cardiovascular disease, autoimmunity and cancer: recommendations for clinical practice. Autoimmunity Reviews. 2010;9(11):709–715. doi: 10.1016/j.autrev.2010.06.009. [DOI] [PubMed] [Google Scholar]
- 34.Holick M. F., Binkley N. C., Bischoff-Ferrari H. A., et al. Evaluation, treatment, and prevention of vitamin d deficiency: an Endocrine Society clinical practice guideline. The Journal of Clinical Endocrinology & Metabolism. 2011;96(7):1911–1930. doi: 10.1210/jc.2011-0385. [DOI] [PubMed] [Google Scholar]
- 35.Aucella F., Scalzulli R. P., Gatta G., Vigilante M., Carella A. M., Stallone C. Calcitriol increases burst-forming unit-erythroid proliferation in chronic renal failure. A synergistic effect with r-HuEpo. Nephron Clinical Practice. 2003;95(4):c121–c127. doi: 10.1159/000074837. [DOI] [PubMed] [Google Scholar]
- 36.Alon D. B., Chaimovitz C., Dvilansky A., et al. Novel role of 1,25(OH)2D3 in induction of erythroid progenitor cell proliferation. Experimental Hematology. 2002;30(5):403–409. doi: 10.1016/s0301-472x(02)00789-0. [DOI] [PubMed] [Google Scholar]
- 37.Zittermann A., Ernst J. B., Birschmann I., Dittrich M. Effect of vitamin D or activated vitamin D on circulating 1,25-dihydroxyvitamin D concentrations: a systematic review and metaanalysis of randomized controlled trials. Clinical Chemistry. 2015;61(12):1484–1494. doi: 10.1373/clinchem.2015.244913. [DOI] [PubMed] [Google Scholar]
- 38.Liu T., Zhong S., Liu L., et al. Vitamin D deficiency and the risk of anemia: a meta-analysis of observational studies. Renal Failure. 2015;37(6):929–934. doi: 10.3109/0886022X.2015.1052979. [DOI] [PubMed] [Google Scholar]
- 39.Hirani V., Cumming R. G., Blyth F., et al. Cross-sectional and longitudinal associations between the active vitamin D metabolite (1,25 dihydroxyvitamin D) and haemoglobin levels in older Australian men: the Concord Health and Ageing in Men Project. Age. 2015;37, article 8 doi: 10.1007/s11357-015-9749-1. [DOI] [PMC free article] [PubMed] [Google Scholar]
Associated Data
This section collects any data citations, data availability statements, or supplementary materials included in this article.
Supplementary Materials
In a group of hypertensive subjects, vitamin D supplementation did not result in changes of hematological parameters, neither if only anemic patients were considered nor if only individuals with initial 25OHD levels <30 nmol/L were included in the analysis.