Abstract
Frequency and intensity ranges (in true dB SPL re 20 μPa at 1 meter) of voice production in trained and untrained vocalists were compared to the perceived dynamic range (phons) and units of loudness (sones) of the ear. Results were reported in terms of standard Voice Range Profiles (VRPs), perceived VRPs (as predicted by accepted measures of auditory sensitivities), and a new metric labeled as an Overall Perceptual Level Construct. Trained classical singers made use of the most sensitive part of the hearing range (around 3–4 KHz) through the use of the singer’s formant. When mapped onto the contours of equal-loudness (depicting non-uniform spectral and dynamic sensitivities of the auditory system), the formant is perceived at an even higher sound level, as measured in phons, than a flat or A-weighted spectrum would indicate. The contributions of effects like the singer’s formant and the sensitivities of the auditory system helped the trained singers produce 20–40 percent more units of loudness, as measured in sones, than the untrained singers. Trained male vocalists had a maximum Overall Perceptual Level Construct that was 40% higher than the untrained male vocalists. While the A-weighted spectrum (commonly used in VRP measurement) is a reasonable first order approximation of auditory sensitivities, it misrepresents the most salient part of the sensitivities (where the singer’s formant is found) by nearly 10 dB.
Keywords: Voice Range Profile, long-term average spectrum, Singer’s formant, equal loudness, sone, phon, perception
I. INTRODUCTION
The Voice Range Profile (VRP) is a practical method of obtaining information on vocal intensity and frequency ranges. It is a map of the dynamic and fundamental frequency ranges of a voice, often obtained using a sound level meter and a pitch source (pitch pipe or keyboard) to cue fundamental frequency. Subjects/patients match a given pitch at both a low and high intensity with various steady vowels. In this way, the VRP may be used to show range change with therapy (1) or training (2).
Klingholz (3) provided an important tutorial showing how to measure and interpret the VRP of various singers; although only used as a brief illustration, he presented in his tutorial the overlap of the Stimmfeld (voice field) and the Hörfeld (hearing field). Subsequently, little has been done to relate the voice range to the auditory system. Hunter and Titze (4) directly compared the vocalization range and the auditory range, exploring possible relationships between the singer’s formant and auditory sensitivities. The trained singers from that study used, on average, 45 percent of the hearing range (at 1 meter) compared to 38 percent for untrained vocalist. The major difference between the untrained and trained vocalists could be traced to the trained singers’ use of the singer’s formant, which is located near the most sensitive spectral region of the ear (the frequency region around 3–4 kHz).
In using the VRP, vocologists (e.g., voice scientists, clinicians, and trainers) often follow a recommendation by Schutte and Seidner (5) that the VRP be measured with an A-weighted spectrum to reduce the influence of room noise. A study by Gramming et al. (6) showed that A-weighting affected a VRP by primarily lowering the measured dB of the soft renditions. However, because the A-weighted spectrum was designed to approximate the auditory system’s sensitivity to frequency, the use of A-weighting necessarily connects the VRP to the auditory system. Nevertheless, according to the knowledge of the authors, no study has yet taken into account that an A-weighted VRP necessarily includes the approximation made by this filtering, and is therefore related to an assumed perception, i.e. perceptual levels. The A-weighted spectrum misrepresents a trained singer’s VRP because the auditory system is nearly 10 dB more sensitive in the location of the singer’s formant than is the A-weighting characteristic response. Thus, based on the more exact frequency sensitivity of the auditory system (equal loudness contours in phon), a perceived VRP (PVRP) might better represent a trained singer’s voice.
To address these issues, two specific research questions were asked: 1) How does the VRP of a trained singer compare to a PVRP? and 2) How does the use of an A-weighted PVRP (PVRP-A) compare to a PVRP of a trained singer? To answer these questions, several acoustic measures of both trained and untrained singers were used or defined: a PVRP (based on the phon and sone scale), a standard VRP, a PVRP-A (in which A-weighting was used instead of phon), an A-weighted VRP (VRP-A), and an Overall Perceptual Level Construct (OPLC, to be defined later).
II. METHODS
The current study examined the vocal output produced by four trained singers, one from each of the categories of soprano, mezzo-soprano, tenor, and bass-baritone; four untrained vocalists were used as controls. VRPs were measured for all subjects. Also, third-octave band spectrum analysis (in dB SPL) was conducted; these band levels were converted to phons and sones (as reviewed later) from which PVRP and PVRP-A measures were calculated.
Subjects
Four professional vocalists trained in western opera and concert performance were recruited: two male vocalists (a bass-baritone and a tenor) and two female vocalists (a soprano and a mezzo-soprano), with an average age of 40. These vocalists, from the faculty of the School of Music at the University of Iowa, were recruited for their professional experience. In addition, four untrained vocalists were recruited with similar voice classifications as the trained singers: two male vocalists (a bass-baritone and a tenor, self-classified and verified by VRP comparisons) and two female vocalists (a soprano and a mezzo-soprano, again self-classified and verified by VRP comparisons), with an average age of 31. The untrained vocalists reported no formal training in singing or speaking performance; nevertheless, because the study required reproducing given pitches, all subjects had some informal singing/music experience. All subjects reported normal hearing. At the time of recording, all subjects reported they were in good vocal health.
Instrumentation
Acoustical recordings were conducted in an anechoic chamber at the Wendell Johnson Speech and Hearing Center at the University of Iowa. The chamber had fiberglass wedge sound treatment on the inner walls and was structurally isolated from the main building. The room was a cube, with internal dimensions of 6.33 m to each side and a total free space volume of 253 m3. The room was rated as anechoic for frequencies above 60 Hz.
The recording microphone (AKG Acoustics CK22, pressure gradient, C460B preamp: 20–20,000 Hz +/− 1dB) was mounted in parallel with a Quest Technologies Model 2700 sound-level meter (fast response, linear weighting) approximately 5 cm apart. Both microphones faced the sound source at a distance of 1 m. This distance was chosen because the AKG microphone frequency response (flat: 20–20,000 Hz +/− 1dB) was known at 1 m; fortuitously, this distance also corresponds to a likely distance between singers in a vocal duet or members in a choir and can be related to any other singer/listener distance (e.g., 30 cm as calculated later). The AKG microphone signal was amplified from microphone to line level with a Symmetrix Microphone preamplifier and recorded with a Panasonic SV-3700 DAT Recorder at a 48 kHz sampling frequency.
Before and after each recording session, the microphone recording system was calibrated to the sound level meter using a calibration tone. This was accomplished by presenting a calibration tone through a single loudspeaker at a distance of 1 m from the position the subject’s mouth would be at the microphone. This tone was recorded by the acquisition system (i.e., the microphones, amplifiers, and DAT deck described above); its level was recorded by reading the SPL value from the meter (linear weighting) and was used to scale the recorded tone (and, thus, the entire recording) to the appropriate dB SPL.
Recording Session
In summary, subjects produced the vowels /i/, /a/, and /u/ (5). Subjects were asked to sing each of the vowels at their lowest and highest comfortable loudness at multiple pitches, sustaining each production for at least 1.5 seconds. With nine possible unique sequences in which the vowels could be produced, each of the eight subjects had a unique vowel order; the order of the vowel sequence was randomly assigned to each of the subjects.
A typical recording session for a subject lasted 30–40 minutes. Subjects were provided with water and were given a break any time they felt it was necessary; no subject took more than a five-minute break. For a given vowel, a subject was first asked to produce the vowel at a comfortable pitch and loudness. Starting at the nearest keyboard note that matched this comfortable pitch, the subjects were then asked to sing the vowel at their lowest and then their highest loudness. A tone was played a whole step lower than the starting pitch, and the subject was asked to match the pitch and again sustain the same vowel at low and high loudness. This pattern was repeated with pitches progressively lowered in whole step increments until the lowest producible pitch was reached. Next, the subject was asked to produce a tone that was a whole step above the starting pitch as demonstrated by the keyboard, followed by successively higher pitches until the upper limit of the subject’s pitch range was reached. This same procedure was then repeated for the other two vowels.
Subjects were instructed to produce the vowels as if they were singing or performing. They were also instructed, as far as possible without straining their voice, to try and reach the extents of their voice (in both loudness and pitch). While these instructions might result in a smaller vocal range than is physiologically possible, the instructions were intended to identify how the voice range of a trained singer matches the auditory range as compared to an untrained singer as a trained performer is expected to be more familiar with their voice and would not likely to go outside his/her comfortable singing range on stage even if more range would be physiologically available.
Analysis
Recorded tokens were played back from the DAT into the line input of a Larson-Davis System 824 analyzer, with settings identical to the sound level meter (e.g., fast response, linear weighting). From the analyzer, the sound level (in dB and dB-A) of a produced token was obtained; simultaneously, the third-octave band levels of the token were obtained. All levels from the analyzer were afterwards converted to dB SPL using the previously mentioned recorded calibration tone.
From the dB SPL levels obtained, three vowel-specific VRP plots were created for each subject by taking the dB SPL (at a given pitch, or fundamental frequency) for each loud and soft token. A general VRP was also created for each subject by taking the extreme (maximum and minimum) dB SPL values across the three vowels. Third-octave level values (the frequency spectrum) calculated for each token (each vowel, each pitch, and each loud/soft token) were used to create the following two additional measures: (1) a PVRP, using equal loudness contours (phon) and loudness level (sone); and (2) a PVRP-A, which used A-weighting instead of equal loudness contours. Finally, an OPLC (overall perceptual level construct) was given to each group of subjects (trained/untrained) based on their maximum and average spectrum (the average and maximum levels within individual third-octave bands for all tokens). Details of PVRP, PVRP-A, and OPLC are described below after a review of some of the common principles and equations of the three calculations. For comparison purposes, a general vowel VRP-A was created for each subject using all three vowels. For a more thorough comparison of the VRP-A and VRP, see Gramming et al. (6).
Common Principles
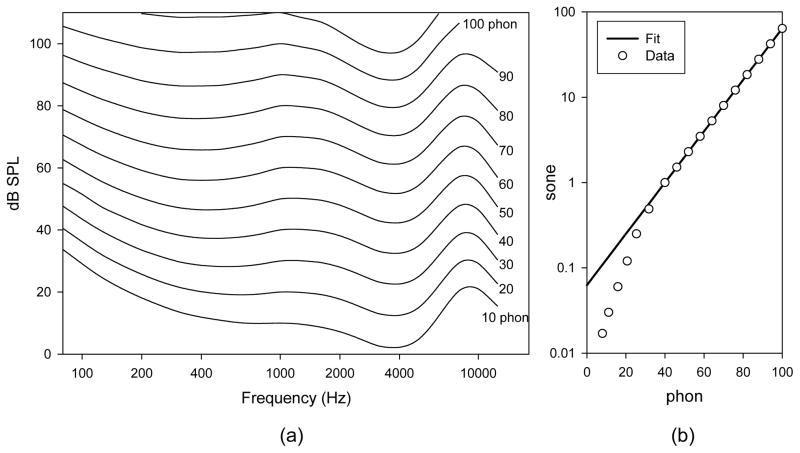
Human hearing sensitivity varies with frequency, as shown by the equal loudness contour standard (7) based on the judgment of equal loudness of pure tones (Figure 1a). For a given contour (an equal phon value), any frequency along that contour would be judged as having equal loudness. The dB SPL of a pure tone for a frequency can be mapped to the phon scale using the equal loudness contours; this phon scale is equal to the dB SPL scale at 1 kHz. Thus, a 50 phon tone (regardless of the frequency) is then judged as loud as a 50 dB SPL 1 kHz tone. The phon scale illustrates that the sensitivity of the ear decreases when the frequency goes below 500 Hz and above 4 kHz (i.e., pitches lower than 500 Hz and higher than 4 KHz require a larger dB SPL for equal loudness).
Figure 1.
Phon and Sone as given by ISO standards. (a) Equal loudness curves of pure tones showing the frequency and level relationship between dB SPL and phon. (b) The relation between equal loudness (phon) and loudness level (sone).
The commonly used A- and C- (and the seldom used B- and D-) weightings are attempts to simplify these equal loudness contours. However, despite the usefulness of the phon scale, it is not a practical method for comparing loudness values of two tones because the phon scale is not linear (i.e., 100 phon is not twice as loud as 50 phon). Therefore, the sone scale was created (8, 9) to provide a linear scale for loudness (e.g., 10 sone is twice as loud as 5 sone), with the following empirical relationship (from Figure 1b) between phon and sone:
| (1) |
Because this empirical relation does not adequately represent sone values for phon values less than 40, these values were taken directly from the graphs and tables in the standard (8).
The linearity of the sone scale allows multiple sone values to be mathematically summed if no two frequencies are within the same critical band of the ear. Third-octave bands, which approximate the critical bands of the ear above 400 Hz, allow for the calculated perceived loudness (in sone) of the original complex signal by a simple summation of all the sone values across the band spectrum (9). This total sone value can then be converted back to a total phon value which can be compared to a perceived dB SPL level of a 1 kHz tone (the point at which phon and dB SPL are equal). However, these calculations assume pure tones. In order to use third-octave band levels, the band of energy must be adjusted by the corresponding bandwidth for if the bandwidth is less than or equal to a critical band (about a third-octave). For this case, the loudness of a bandwidth of sound is judged to be about as loud as a pure tone of equal intensity at the center frequency of the band (10). Since this calculation is to be done on speech (complex) sounds, or non-pure tones, then the third-octave band dB SPL levels must first be converted to pressure spectrum level (PSL), which is dependent on the third-octave bandwidth w or what a corresponding pure tone at the center would be (9, 11).
| (2) |
This relation allows the level of a third-octave band to be comparable to a pure tone level (via PSL) as needed in ISO 226.
PVRP Creation
For a given token’s third-octave band dB SPL (Ln, where n represents the specific band), the band’s PSL was calculated using Equation 2 (LPSL,n= Ln − 10 log w); this level (LPSL,n) is then comparable to the dB SPL of pure tones. Using this level as if it were the level of a pure tone, each LPSL,n value was converted to a phon value (Lphon,n) using the equal loudness contours of ISO 226 (7) (Figure 1a). Using the graph and tables from which Equation 1 was generated, this phon value was then converted to sone (Lsone,n), with the total loudness of a token being the sum of all third-octave loudnesses (Lsone=Σ Lsone,n). By once again using Equation 1, total loudness (Lsone) was related to phon and could be thus compared to the dB SPL of a 1 kHz tone at the point where dB SPL and phon were equal.
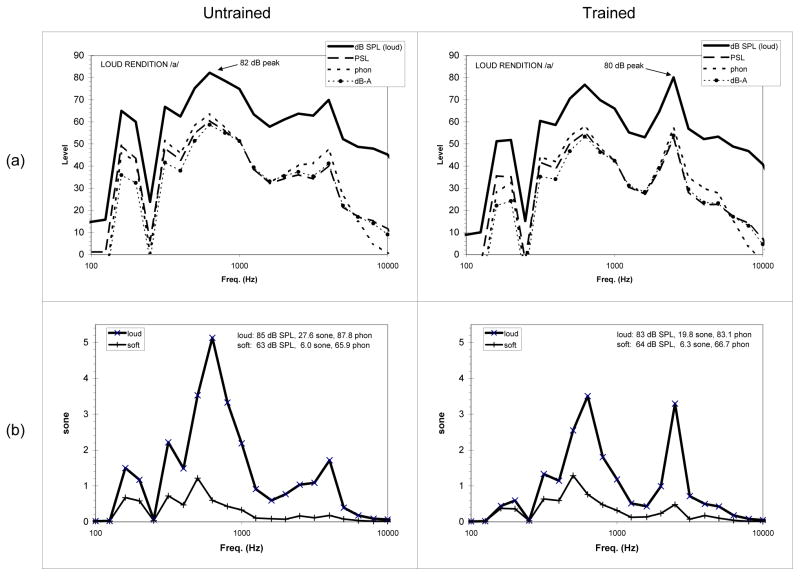
A mid-range rendition of an /a/ vowel from the trained and untrained bass-baritones’ VRP measures (/a/, F3, 174 Hz), where the loud dB SPLs were 82.5 and 85 dB respectively, can be used to illustrate these steps. First, for each rendition, the third-octave levels were obtained, L. Next, these levels were mapped to the phon scale by first calculating LPSL, (long dash) and then Lphon (short dash), as shown in Figure 2. The phon values were converted to sone (Lsone, Figure 2b) and summed to obtain the total loudness (both soft and loud renditions for /a/, F3, 174 Hz are shown). Finally, the total loudness in sone was converted back to total phons. This final phon value, a predicted dB SPL level as if it were from a 1 kHz tone, becomes one point in the PVRP of a subject. In a PVRP creation, the same steps would be done to each rendition with each rendition resulting in a single phon value. In summary, a given set of third-octave levels calculated for a token was mapped onto the phon scale, converted to sone, summed to total sone, and converted back to phon.
Figure 2.
Spectral information of the untrained and trained bass-baritone rendering the /a/ vowel for (F3) used to illustrate PVRP creation. (a) Third-octave levels, the pressure spectrum level, and then phon and A-weighted versions of the pressure spectrum level were shown. (b) Loud and soft renditions of the vowel were shown in terms of sone, based on the phon pressure spectrum level.
PVRP-A Creation
A PVRP-A was created to further investigate the viability of A-weighting (approximating the 40 phon equal loudness contour) when measuring trained singers. The steps taken to create a PVRP-A were similar to those for a PVRP. Starting with LPSL,n, each level was first adjusted by the A-weighting (correction values for A-weighting in dB for octave bands can be found in many acoustic texts; e.g., 9). The A-weighted levels were then converted into an approximated A-weighted phon scale (Lphon-A,n, see Figure 2a for example values- dotted line). Using the graph and tables from which Equation 1 was generated, Lphon-A,n became Lsone-A,n by summing these individual loudnesses, Lsone-A= Σ Lsone-A,n, and the total A-weighted loudness was calculated. This total was converted back to Lphon-A, which was used to create a PVRP-A. Although Equation 1 was not designed with the A-weighting scale in mind, the scale was meant to be an approximation of the equal loudness curves and is commonly used in sound measurement.
Overall Perceptual Level Construct (OPLC)
By joining the trained singers and the untrained singers into four subject groups (trained male, trained female, untrained male, untrained female), OPLCs were created from combinations of all tokens (average loud, maximum loud). For a given subject group and a given loud token, the average (converting dB to intensities, averaging, then converting the result back to dB) and maximum levels across individual third-octave bands (Lavg,n and Lmax,n) were obtained; likewise, average and minimum third-octave band levels for each soft token were obtained. This allowed a range of loud or soft tokens to be treated as a single sound, an overall pseudo-sound. Using the third-octave levels of the eight overall pseudo-sounds (i.e., average loud, maximum loud, average soft, and minimum soft for each subject group), an overall perceived total phon level (OPLC dB SPL) was calculated using steps similar to those described above in the PVRP creation. The OPLC was labeled as a “level construct” to differentiate it from the term “level” since the OPLC was only a construct encompassing the band levels across multiple renditions, rather than an actual level from a single production. The OPLC was based on the frequency/level sensitivity of the ear; thus, it was a value that could be used to calculate approximately how much of the human auditory range was used by the trained and untrained vocalists.
III. RESULTS
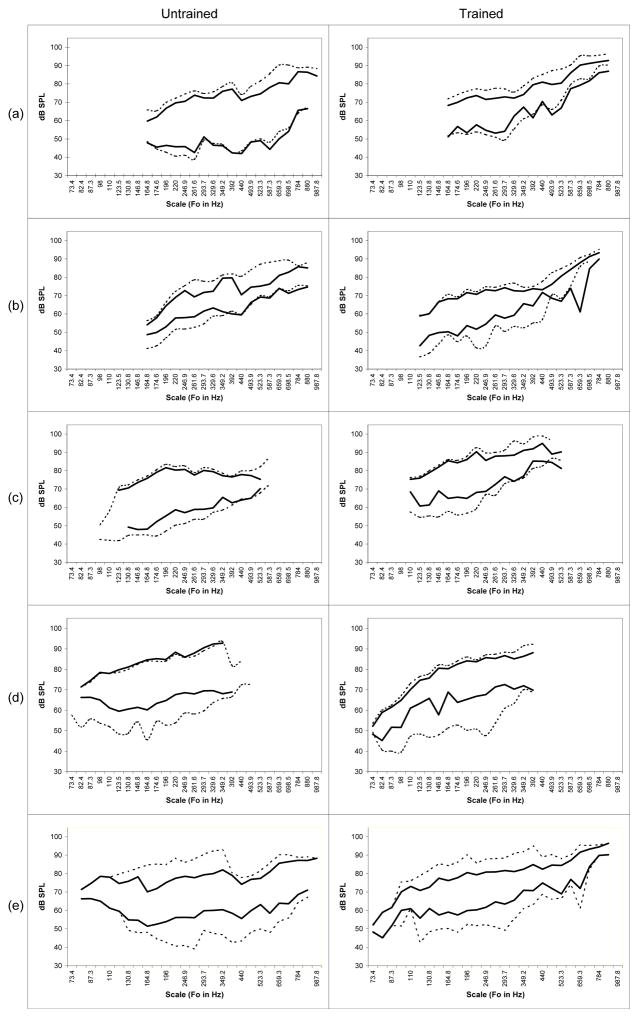
The subjects’ VRP plots (Figure 3) were found to be comparable to those found in the literature for similar voice classifications (3). VRP plots for the /a/ vowel (the most commonly used token in VRP production) are depicted by solid lines; for each subject, the maximum dB SPL of the loud renditions and the minimum dB SPL of the soft renditions for the three vowels (/a/, /i/, /u/) were also graphed for a given pitch (dotted line, Figure 3), demonstrating the VRP variation with vowel. The left column contains the VRPs for the untrained vocalists and the right column contains the VRPs for the trained vocalists (Figures 3a–3d). Figure 3e (at the bottom) depicts the average VRP of all untrained and trained vocalists (solid line), as well as the across-subject extreme (overall maximum and minimum) which illustrates the general voice range of the trained as compared to the untrained singers. Subjects produced an average VRP scale of 19 whole steps from low pitch to high.
Figure 3.
VRP (in dB SPL) is shown for each subject (Left: untrained voice users. Right: trained singers. Voice types: (a) soprano, (b) mezzo-soprano, (c) tenor, (d) bass-baritone. In (a)–(d) the solid line represents a VRP created with the /a/ vowel (loud and soft) and the dotted line represents the maximum and minimum loud and soft across /a/, /i/, and /u/ vowels. (e) Averages of the untrained and trained extreme VRP where the solid line was the statistical average of the subjects and the dotted line was the maximum and minimum across subjects.
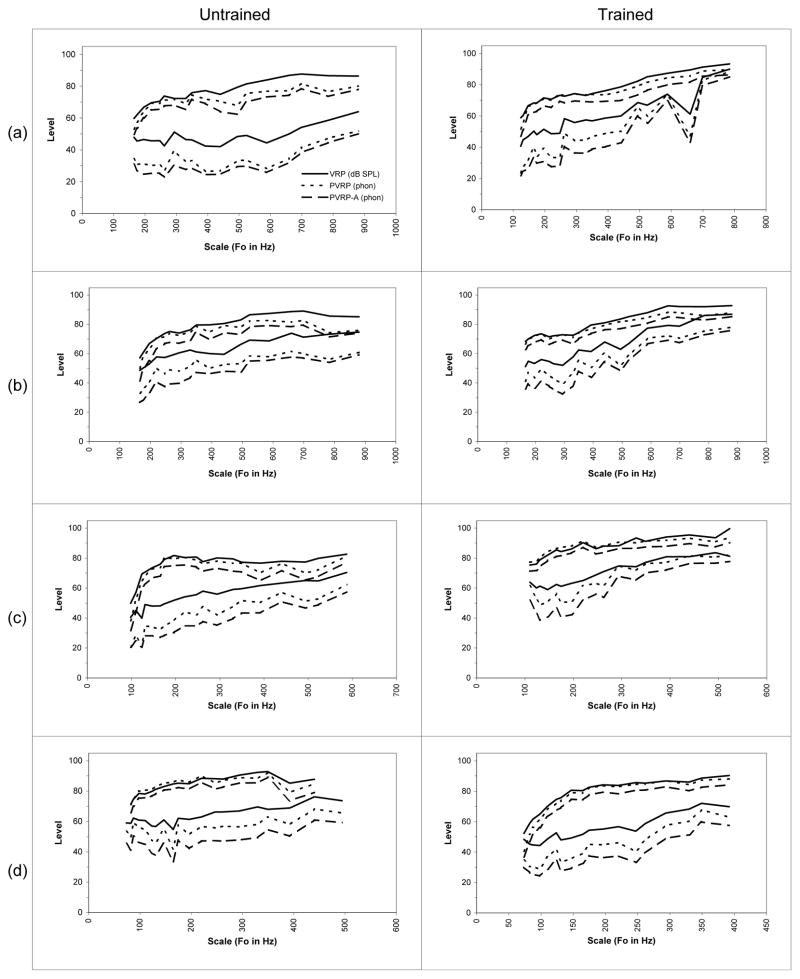
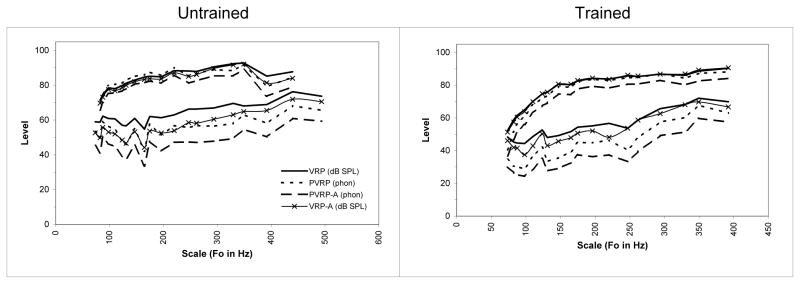
The PVRP, VRP, and PVRP-A are plotted together in Figure 4. By taking perception into account (PVRP and PVRP-A), a larger dynamic range is generally seen as compared to the VRP. Further, the loud rendition curves showed more similarities in the PVRP, VRP, and PVRP-A (across the trained/untrained in the four voice classifications) than the soft rendition curves. By focusing on the loud renditions across the subjects, the male voices (untrained/trained, Figure 4.c 4.d) had less variation (+/− 3 dB) between the PVRP and the VRP than the female voices (untrained/trained). By next focusing on the loud renditions in the female singers (Figure 4.a, 4.b, the trained female singers had a variation of approximately 6 dB between the PVRP and the VRP, where the maximum variation for the untrained female singers approached 15 dB.
Figure 4.
Voice Range Profiles (solid lines) across the three vowels are shown along with predicted Perceived Voice Range Profile (PVRP, dotted lines) based on equal loudness contours, and the PVRP-A (dashed lines) as based on A-weighting. The PVRP level in phon can be compared to the dB SPL of a 1 kHz tone.
In all of the curves shown in Figure 4, the PVRP-A was consistently lower than the VRP and PVRP (average of 3 dB lower than PVRP for loud rendition, and 7 dB lower for the soft rendition). For comparison, Figure 5 illustrates all VRP-related measures for the two bass-baritones (untrained/trained). Generally, the VRP-A was nearer the VRP than either PVRP or PVRP-A. The A-weighting caused the VRP-A to underestimate the VRP, and caused the PVRP-A to underestimate the PVRP. It is also important to note that there is greater variation between the PVRP and the VRP-A in the trained than the untrained. In general, all subjects’ VRP and PVRP levels were lowered when the A-weighting was applied (creating the VRP-A and PVRP-A). Further, while the VRP-A differed nearly uniformly from the VRP, the perceived measures (PVRP and PVRP-A) differed non-uniformly.
Figure 5.
For comparison purposes, the VRP-A is plotted along with the VRP, PVRP and PVRP-A. Only the base-baritone subjects are shown.
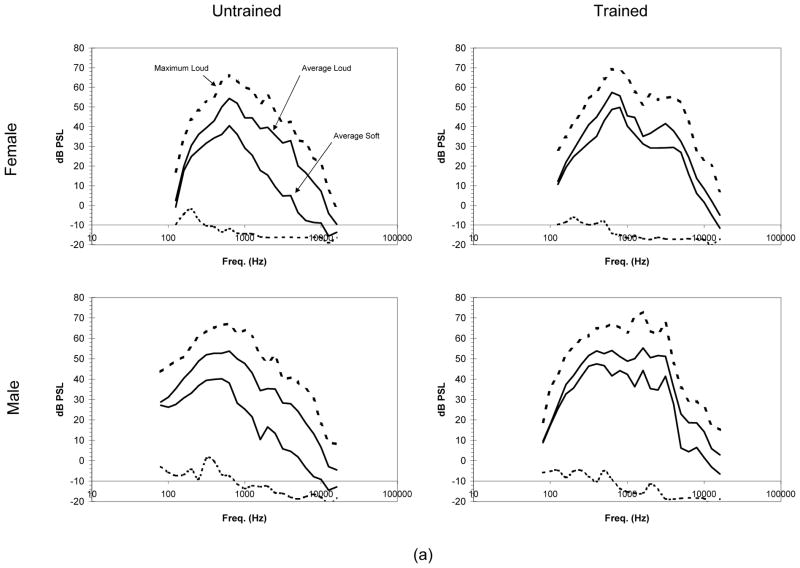
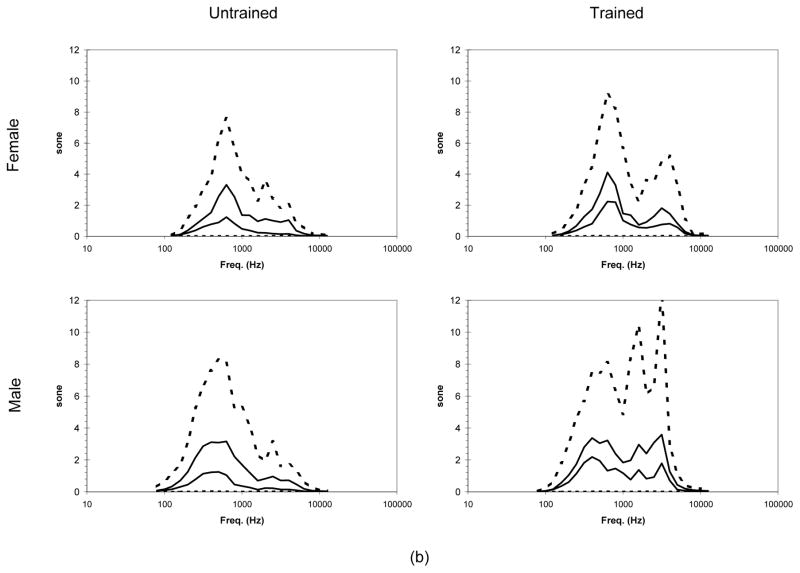
Figure 6 contains a plot showing the calculation of the OPLC grouping by gender and training. Figure 6a illustrates the average spectrum for the loud rendition, soft rendition, and maximum loud and minimum soft renditions across all vowels and subjects (untrained and trained, female and male). Generally, the loud average spectral values were very similar for frequencies up to 1000 Hz. The minimum soft, which was similar across all subjects, was assumed to be near the noise floor for the recording/analysis system because across all renditions (vowels and fundamental frequencies), it would be feasible that a band, for some rendition, would have few or no frequency components resulting in a minimum near the noise floor. These average (via averaging intensity) and maximum/minimum spectral graphs (Figure 6a) were converted to sone (Figure 6b); with the respective loudness values (sum of all sone in a curve) labeled on the figure. Below 1000 Hz, all sone spectra (like the dB SPL spectra) were similar. Above 1000 Hz, the singer’s formant is enhanced in comparison to the dB SPL spectrum with the male singer’s formant the very noticeable.
Figure 6.
Obtaining the Overall Perceptual Level Construct for the untrained and trained singers. (a) All subject maximum loud (upper dotted), average loud (upper solid), average soft (lower solid) and minimum soft third octave spectrum level are shown. (b) Levels are converted first to phon (not shown in the figure) then to loudness (sone) using the same legend as in figure (a).
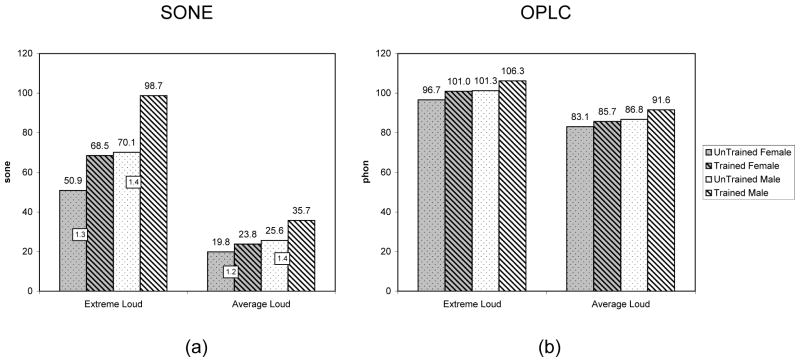
The total sone values for average loud rendition and extreme loud in Figure 6b were also presented in Figure 7a concurrently with ratios between the trained loudness and untrained loudness (shown in boxes). From the loudness values, equivalent phons were calculated as the OPLC (overall perceptual level construct, Figure 7b). The trained male singers had a maximum sone value 40% more than the untrained (Figure 7a, ratio of 1.4), which means that, in general, male trained singers maximum loudness was 40% louder than the untrained. Similarly, the female trained singers were 30% louder than the untrained (ratio of 1.3). However, because the maximum loudness value is based on the maximum levels in each band across a group of subjects (gender, training), the maximum third-octave levels may be primarily from a single singer who was particularly loud; therefore, the maximum OPLC may not be indicative of a trend of the group but of one loud subject. Thus, the average sone value may more realistically represent a group of singers. Nevertheless, the average loud rendition still showed that the trained males were 40% louder than the untrained while the average loud for the female singers was 20% louder. These sone values, when related to phon, show the trained male vocalists had a higher OPLC (by 5.0 phon) than the untrained male (3.3 phon for the female) for the all-inclusive maximum and a higher OPLC (4.8 phon for male, 2.6 for female) for the average loud spectrum. If the OPLC represented 1 kHz tones in phon, the 2.6 phon difference between the average value of the trained and untrained female singers would relate to a 2.6 dB difference. In other words, on average it would take nearly two of the untrained female singers (3 dB corresponds to a doubling of intensity or twice the number of identical sound sources) to produce the same OPLC as one trained singer, even though the trained female singers are only 20% louder (Fig. 7a, avg-loud, in sone).
Figure 7.
(a) The total sone levels of the extreme spectra are plotted with ratios between trained and untrained values (squares). (b) From the loudness values, equivalent phons are calculated as the Overall Perceptual Level Construct.
IV. DISCUSSION
This was a study of loudness differences between a small number of untrained and trained vocalists, illustrating the effects of taking into account the auditory sensitivities on the Voice Range Profile. An Overall Perceptual Level Construct was defined as the value in phon of the overall spectrum from a group of trained and a group of untrained singers. The measured Voice Range Profiles of the singers, and their spectra, are not unique; more extensive and detailed studies are found in the literature. Likewise, the A-weighted VRP has been discussed (6). However, this study presents several unique perspectives on the sensitivity of the auditory system.
First, when comparing the maximum third-octave loudness levels (Figure 6, in sone) for each set of subjects, the untrained male singers had more loudness below 630 Hz. In contrast, the trained singers had more loudness above 630 Hz, with a peak at the 3150 Hz third-octave band; this peak was identified as the singer’s formant (Figure 6b). The singer’s formant added energy to the trained singer’s spectra. Further, this addition was enhanced when computing loudness because the formant occurs in the most sensitive part of the auditory system, increasing the formant’s effect on loudness. This enhancement was likely the largest factor in the trained subjects having a 20–40 percent boost in average spectral loudness over the untrained vocalist (as calculated in sone), resulting in a difference of nearly 3 phon (5.6 for male) in the respective group’s OPLC.
Second, the results demonstrate that A-weighting (VRP-A) increases the presented dynamic range of the VRP, particularly by decreasing the soft rendition measures. A similar but more pronounced phenomenon was found for PVRP and the PVRP-A (using the A-weighting). This supports the finding of Gramming et al. (6) that the use of VRP-A resulted in lower dB measures than no weighting, particularly in the soft renditions (/a/ vowel). The current study also demonstrated that, when computing loudness (in sones), the A-weighting is a poor representation of the equal loudness contours because the PVRP-A always underestimates the PVRP for both loud and soft renditions. The A-weighting tapers off more quickly at the lower and higher frequencies than the equal loudness curves, which causes most of this difference. Important to note is that the A-weighted spectrum underestimated the specific spectral sensitivity of the ear at 3–4 kHz by nearly 10dB, potentially underestimating the effect of a strong singer’s formant.
Several aspects of this study could be improved in more comprehensive follow-up studies. First, only a small sample of subjects was used; a larger subject pool used to obtain OPLC would yield more representative results. Nevertheless, a small group approach was a practicable first step. Second, a true perceptual testing component might be added by recruiting listeners to judge the difference in loudness of untrained and trained singers, normalized in some way. However, one pitfall would be that the level acuity of listening subjects with complex sounds (non-pure tones) though well studied is also complicated and not easily implemented. Third, sound samples or tokens would need to be synthesized (using a well-documented voice synthesizer) to allow for specific differences in the sounds (e.g., same output dB SPL, one with a singer’s formant, one without). Fourth, the calculations of perceptual loudness were based on averages and, thus, may not reflect individual hearing differences (e.g., equal loudness contours are averages of hundreds of tests, but individuals with “normal hearing” can have various auditory acuity). Finally, while all of the calculations were based on perceptual measures and theory, the perceptual differences in phon and dB between the groups are not exact but rather only approximated by the calculations. For instance, the 3 dB difference in the OPLC value between the trained and untrained singers is expected to be easily distinguishable by normal listeners (differences of 0.3–2 dB are normally detectable, 10) but since the calculated values are only approximations a special perceptual study would be needed to support this assumption.
CONCLUSIONS
The trained voice has been well studied from a production point of view, and the singer’s formant enhancement has been well documented. However, by comparing a singer’s voice spectrum to the equal loudness contours from a perceptual point of view, understanding of the trained singer’s voice is enhanced even more. The standard Voice Range Profile (VRP) plot, as well as a Perceptual Voice Range Profile (PVRP), was shown. It appears that, since the singer’s formant is in close proximity to the ear’s most spectrally sensitive area, the singer’s formant is ideally suited for the auditory system. Thus, the perceived dynamic range, as illustrated by the PVRP, is a much greater value than depicted by the VRP (A-weighted or not). The PVRP does not uniformly differ from the VRP, where the difference varies with fundamental frequency. The VRP-A, on the other hand, seems to differ from the VRP in a more uniform way. The VRP-A may be used to first-order approximate the VRP for loud renditions but not for soft renditions. However, since the singer’s formant is in close proximity to the auditory system’s most spectrally sensitive area, the A-weighting is not suggested as a means to approximate the auditory sensitivity particularly when making acoustical measures of trained singers with a strong singer’s formant, especially if the formant is of interest in the study question. As stated previously, the A-weighting underestimates the most sensitive region of the ear by nearly 10 dB which is also the location of the singer’s formant.
In a novel attempt to capture the extent a performer might use the auditory system of a listener, an overall perceptual level construct was created based on the average and maximum productions that a group of singers produces. The current study used this measure to show the perceptual differences between the trained and untrained singers. The overall perceptual level construct allows for a single value associated with the auditory system to be given to a singer; such a value could be used in conjunction with other metrics (e.g., spectral slope and vibrato extent) in comparing individual singers or for monitoring improvements during therapy and/or training. Further investigation is needed to study the usefulness of this measure.
Extending these concepts from a comparison of vocalist’s output to the auditory system’s sensitivities presents an interesting question: Did the evolution of western operatic training to obtain a singer’s formant occur because it was physiologically (through the epilaryngeal tube) the easiest way to increase output, or through trial and error, did the training to find the singer’s formant via the epilaryngeal tube not because it was the easiest but because it is optimized to the sensitivity of the ear? This question is particularly interesting given the observations that Chinese opera singers do not use the singer’s formant (12). It is possible that eastern instrumental accompaniment for voice, room acoustics, and audience size dictate a different spectral distribution to maximize perception. Further questions concerning the connectivity between the auditory and vocal systems could be extended to animal vocalization, an area of considerable interest today.
Finally, in discussing vocal output and auditory sensitivity, hearing damage to performers in a singing environment should be considered. One study examining this issue focused on noise exposure among the Finish National Opera personnel during rehearsal and performance (13). This study found that the singers were exposed to sound that exceeded the Finish National Action Level and recommended hearing protection, quantifying exposure in terms of A-weighted dB. Although this is the standard in noise level instrumentation, this study demonstrated that A-weighted dB might underestimate the hearing sensitivities around the singer’s formant by as much as 10 dB, which, according to Figure 6, can be the highest level of the trained vocalists’ spectrum. In an environment like a chorus where there may be large spectral peaks in the region of the most sensitive part of the ear, further study would be needed to quantify how this formant region might affect hearing loss. Any spectral peak at the most sensitive frequency region of the auditory system might be uncomfortable at close proximity (such as in a choir, or small ensemble) and at loudness levels found in singing. This may be one reason for the observation by Rossing et al. (14) that singers use the singer’s formant in a solo setting but not in a choral setting.
Acknowledgments
This work was supported by grant DC04347-03 from the National Institutes of Health/National Institute on Deafness and Other Communication Disorders.
This work was supported by grant number R01-DC04347 from the National Institutes of Health/National Institute on Deafness and Other Communication Disorders. The authors express their thanks to Laura M. Hunter for the technical review and to the anonymous reviewers for their invaluable comments.
References
- 1.Baken RJ, Orlikoff RF. Clinical Measurement of Speech and Voice. 2. San Diego: Singular Publishing Group; 2000. [Google Scholar]
- 2.Sulter AM, Schutte HK, Miller DG. Differences in phonetogram features between male and female subjects with and without vocal training. J Voice. 1995;9(4):363–377. doi: 10.1016/s0892-1997(05)80198-5. [DOI] [PubMed] [Google Scholar]
- 3.Klingholz F. The Voice Field: A practical guide for measurement and evaluation (in German) Munchen: Verlag J. Peperny; 1990. [Google Scholar]
- 4.Hunter EJ, Titze IR. Overlap of Hearing and Voicing Ranges in Singing. Journal of Singing. In press. [PMC free article] [PubMed] [Google Scholar]
- 5.Schutte HK, Seidner W. Recommendation by the Union of European Phoniatricians (UEP): standardizing voice area measurement/phonetography. Folia Phoniatr (Basel) 1983;35(6):286–288. doi: 10.1159/000265703. [DOI] [PubMed] [Google Scholar]
- 6.Gramming P, Sundberg J. Spectrum factors relevant to phonetogram measurement. J Acoust Soc Am. 1988;83(6):2352–2360. doi: 10.1121/1.396366. [DOI] [PubMed] [Google Scholar]
- 7.ISO 226. Acoustics -- Normal equal-loudness-level contours. International Organization for Standardization; 2003. [Google Scholar]
- 8.ISO 131. Acoustics -- Expression of physical and subjective magnitudes of sound or noise in air. International Organization for Standardization; 1979. [Google Scholar]
- 9.Kinsler LE, Frey AR, Coppens AB, Sanders JV. Fundamentals of Acoustics. 4. Wiley Text Books; 1999. [Google Scholar]
- 10.Zwicker E, Fastl H. Psychoacoustics – Facts and Models. Springer-Verlag; Berlin: 1990. [Google Scholar]
- 11.Speaks CE. Introduction to Sound; Acoustics for the Hearing and Speech Sciences. 3. San Diego: Singular Publishing Group; 1999. [Google Scholar]
- 12.Wang S. Singing voice: bright timbre, singer’s formants and larynx positions. Paper presented at the 1985 Stockholm Music Acoustics Conference; Stockholm. [Google Scholar]
- 13.Laitinen HM, Toppila EM, Olkinuora PS, Kuisma K. Sound exposure among the Finnish National Opera personnel. Appl Occup Environ Hyg. 2003;18(3):177–182. doi: 10.1080/10473220301356. [DOI] [PubMed] [Google Scholar]
- 14.Rossing TD, Sundberg J, Ternstrom S. Acoustic comparison of voice use in solo and choir singing. J Acoust Soc Am. 1986;79(6):1975–1981. doi: 10.1121/1.393205. [DOI] [PubMed] [Google Scholar]


