

Abstract

Microsatellite instability (MSI) is a frequent and clinically relevant molecular phenotype in colorectal cancer. MSI cancers have favorable survival compared with microsatellite stable cancers (MSS), possibly due to the pronounced tumor-infiltrating lymphocytes observed in MSI cancers. Consistent with the strong immune response that MSI cancers trigger in the host, previous transcriptome expression studies have identified mRNA signatures characteristic of immune response in MSI cancers. However, proteomics features of MSI cancers and the extent to which the mRNA signatures are reflected at the protein level remain largely unknown. Here, we performed a comprehensive comparison of global proteomics profiles between MSI and MSS colorectal cancers in The Cancer Genome Atlas (TCGA) cohort. We found that protein signatures of MSI are also associated with increased immunogenicity. To reliably quantify post-transcription regulation in MSI cancers, we developed a resampling-based regression method by integrative modeling of transcriptomics and proteomics data sets. Compared with the popular simple method, which detects post-transcriptional regulation by either identifying genes differentially expressed at the mRNA level but not at the protein level or vice versa, our method provided a quantitative, more sensitive, and accurate way to identify genes subject to differential post-transcriptional regulation. With this method, we demonstrated that post-transcriptional regulation, coordinating protein expression with key players, initiates de novo and enhances protective host response in MSI cancers.
Keywords: colorectal cancer, microsatellite instability, integrative omics analysis, protective host response, post-transcription regulation
Introduction
Colorectal cancer (CRC) is the third most common cancer diagnosed worldwide and the fourth leading cause of cancer death.1 Genomic instability is the key factor of CRC development, leading to the accumulation of sequential genetic alternations involving oncogenes and tumor suppressor genes that drive the progression from early adenomas to metastatic carcinomas. There are two main forms of genomic instability: chromosomal instability (CIN) and microsatellite instability (MSI).2 Most colorectal cancers are chromosomal instable but microsatellite stable (MSS), whereas a small portion of colorectal cancers (approximately 15%) is characterized by widespread MSI.3
Microsatellites are very short repetitive units distributed throughout the genome, which are prone to insertions and deletions during the DNA replication process. When a temporary error is created by DNA polymerase slippage, it is normally recognized and corrected by the DNA mismatch repair (MMR) system. Failure to repair these mutations due to a defective MMR system allows the accumulation of errors in microsatellites, resulting in the phenomenon of MSI.3 MSI cancers are divided into two distinct phenotypes: MSI-H (high-frequency MSI) and MSI-L (low-frequency MSI). Compared with MSS counterparts, MSI-H cancers have distinctive biological, pathological, and clinical features,4−9 whereas MSI-L cancers are similar to MSS in most regards.10 MSI-H cancers produce abnormal peptides, which act as tumor specific antigens and trigger specific antitumor immune responses to limit tumor progression.11,12 Strong tumor-infiltrating lymphocytes were observed in MSI-H cancers,13−16 which have a favorable impact on clinical outcome and are specifically associated with better survival rates.11,17
Several groups have investigated genomics and transcriptomics differences between MSI and MSS cancers using high throughput technologies.18−27 Banerjea et al. compared 29 MSI-H and 104 MSS cancers and identified 2070 genes differentially expressed between the two groups.25 Watanabe et al. reported signatures characteristic of MSI status by the microarray analysis of 33 MSI-H and 51 MSS cancers.20 Lanza et al. studied mRNA and miRNA expression signatures of MSI-H cancers and suggested that the combination of miRNA and mRNA gene signatures improved the molecular separation of MSS versus MSI-H colon cancers.23 Jorissen et al. evaluated cross-study consistency of MSI-associated gene expression changes based on the microarray data of 89 MSI-H and 140 MSS colorectal cancers from their study and 58 MSI and 77 MSS cases from three published reports.22 Most of these studies found that genes related to immune response were upregulated in MSI-H cancers, which is consistent with a pronounced antitumor immune reaction and a dense immune cell infiltration that can be observed in MSI-H cancers. Compared to the well-studied genomics and transcriptomics effect of mismatch repair deficiencies, little is known about proteomics signatures of MSI-H cancers.
We previously analyzed the proteomics profiles of 10 CRC cell lines differing in mutations in DNA mismatch repair genes and revealed multisystem adaption of CRC cells to MMR deficiency.28 In addition, we combined mRNA, miRNA, and protein expression profiles to identify miRNA-mediated post-transcriptional regulation in the CRC cell lines.29 Recently, we performed proteogenomic analysis of 95 CRC samples by integrating proteomics data from CPTAC and genomics and transcriptomics data from TCGA.30 The proteogenomic analysis refined colorectal cancer subtypes and prioritized cancer driver genes, which holds great promise for enabling new advances in cancer biology and diagnosis. In the meantime, the availability of large-scale transcriptomics and matched proteomics data sets provided a great opportunity to study post-transcriptional regulation. Here, we compared the transcriptomics and proteomics profiles associated with MSI status using the TCGA cohort.30 We developed a resampling-based regression method to quantify differential post-transcriptional regulation in MSI-H versus MSS cancers. The findings broaden our understanding of molecular features and phenotypes associated with MSI status. Furthermore, our method is directly applicable to other integrative proteomics and transcriptomics studies for elucidating the role of post-transcriptional regulation.
Materials and Methods
Transcriptomics and Proteomics Data Sets
The Cancer Genome Atlas (TCGA) Research Network has collected detailed clinical records and generated various omics data for multiple types of tumors, including genomics, epigenomics, and transcriptomics profiles. An integrative analysis of omics data sets from different molecular layers in colorectal cancer has presented a comprehensive molecular characterization of the cancer and suggested new markers.31 We downloaded the TCGA CRC RNA-seq data and clinical information from the website of Broad Institute’s Genome Data Analysis Center (http://gdac.broadinstitute.org/runs/stddata__2015_06_01/data/COADREAD/20150601/), which developed the Firehose pipeline management system to make TCGA preprocessed data publicly available via web services and data portals. The RNA-seq data were analyzed by the RNA-seq version 2 analysis pipeline, which used MapSplice to do the alignment32 and RSEM to perform the quantification and normalization.33 The transcriptomics profiles included RSEM measurements for 264 samples and 20,531 genes. If multiple genes have the same gene name (HGNC name), we selected the gene with the largest interquartile range (IQR) to represent the concentration of the gene. After this procedure, expression abundances of 20,501 genes were log-transformed for the integrative analysis.
The Clinical Proteomic Tumor Analysis Consortium (CPTAC) has performed proteomics analyses of TCGA tumor specimens for selected cancer types. In our previous study, we performed liquid chromatography-tandem mass spectrometry (LC MS/MS)-based shotgun proteomics analyses on 95 TCGA tumor samples from 90 CRC patients.30 Both database (Refseq human protein sequence database, release version 54) and peptide library search strategies were used for peptide identification. The IDPicker 3 algorithm was used for protein assembly, and spectral counts were applied to quantify protein abundance. Applying the required minimal average count of 1.4 for a reliable relative protein abundance comparison, we identified 4,122 protein groups with protein-level FDR < 0.5%, which corresponded to 3,899 genes. We used spectral count to quantify protein abundance, which has been demonstrated to achieve similar accuracy with intensity-based quantification methods.34−36 We also previously verified proteomics changes based on spectral count quantification in different data sets,28,37 demonstrating the reliability of spectral count for differential protein analysis. The spectral counts of 3,899 genes were quantile-normalized and log-transformed. The detailed description of methods for peptide and protein identification and quantification of protein abundance and the quantile-normalized and log-transformed spectral count data for these samples are available in Zhang et al.30 The primary data from LC-MS/MS and derived secondary data files can also be downloaded from the CPTAC website (https://cptac-data-portal.georgetown.edu/cptac/s/S022). We matched the proteomics and RNA-seq data with sample and gene names (HGNC name). Eighty-seven common samples and 3,764 common genes were used for the downstream analysis. Among the 87 samples, 16 cancers were identified as MSI-H, 13 as MSI-L, and 58 as MSS (Table S1). Because the behavior of MSI-L cancers is similar to that of MSS cancers in most regards,10 we followed the common procedure in this research field and combined the MSI-L and MSS cancers as an MSS group.
Two independent mRNA expression profiles of CRC patients were obtained from the Gene Expression Omnibus. One contained gene expression profiles from 155 colorectal cancer patients (GSE13294, http://www.ncbi.nlm.nih.gov/geo/query/acc.cgi?acc=GSE13294), and the other included 176 colorectal cancers from the MECC study (GSE26882, http://www.ncbi.nlm.nih.gov/geo/query/acc.cgi?acc=GSE26682). For both data sets, the MAS5.0 procedure was used to make calls of expression. Data from each sample were quantile normalized and log-2 transformed.
Data Analysis
The workflow of data analysis is illustrated in Figure 1. We first identified mRNA and protein signatures associated with MSI status. We then integrated transcriptomics and proteomics profiles to detect genes with differential post-transcriptional regulation. Finally, we tried to interpret the potential role of post-transcriptional regulation by functional enrichment analysis, network analysis, and independent data sets.
Figure 1.
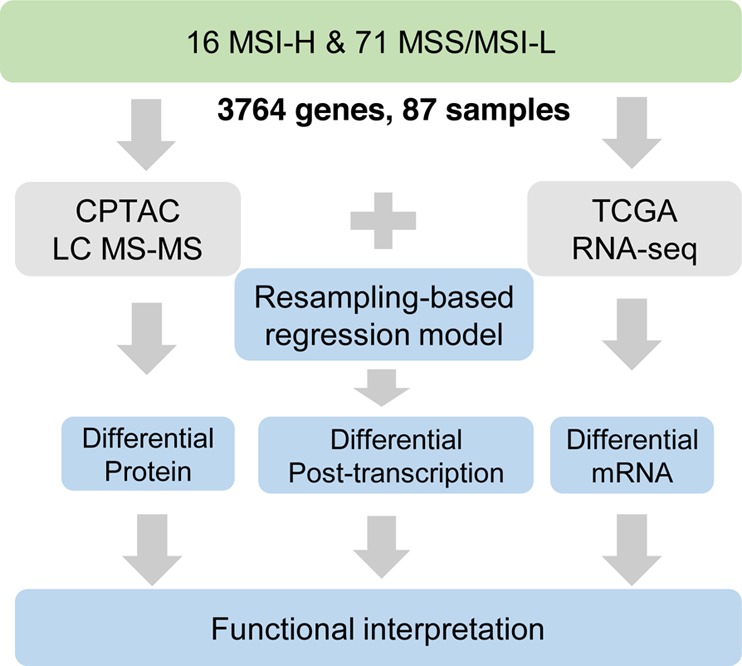
Schema of the integrative analysis pipeline. We performed comparative transcriptomics and proteomics analysis in 16 MSI-H versus 71 MSS/MSI-L cancers for 3,764 genes and developed a resampling-based regression method to detect significant differential post-transcriptional regulation.
To identify mRNA/protein signatures associated with MSI status, we compared mRNA/protein expression profiles between MSI-H and MSS cancers (Figure 1). The Limma (Linear Models for Microarray Data) R package38 (version 3.18.9) was used to identify differentially expressed mRNAs/proteins between the 16 MSI-H and 71 MSS/MSI-L cancers. The p-values were corrected for multiple testing using Benjamini and Hochberg’s procedure.39 The significantly changed mRNAs/proteins were determined based on an absolute log2 fold change greater than 1 (|log2FC| > 1) and an adjusted p-value less than 0.05.
Gene Ontology enrichment analysis for the upregulated and downregulated mRNA or proteins was carried out separately by WebGestalt (http://bioinfo.vanderbilt.edu/webgestalt/).40,41 Enrichment p-values were generated by Fisher’s exact test and adjusted by Benjamini and Hochberg’s multiple test correction procedures.39 Gene Ontology terms with an adjusted p-value less than 0.05 were reported. Hierarchical clustering of differentially expressed mRNAs/proteins for 87 samples was generated by R Stats package (version 3.1.1) using Pearson correlation as a similarity measure and average linkage method. The heatmap gene expression values were gene-wise Z-score transformed in the 87 samples.
All protein–protein interactions (PPI) with at least one publication supported from seven curated databases, HPRD, BioGrid, BOND, DIP, IntAct, MINT, and Reactome, were combined to build the protein–protein interaction network.42 The shortest path between two genes on the PPI network was calculated by the R package igraph (version 0.7.1).
Modeling Post-Transcriptional Regulation
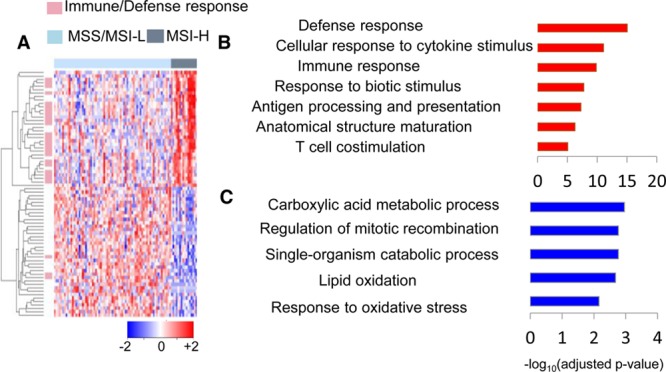
To quantify the magnitude and evaluate the significance of differential post-transcriptional regulation in MSI-H versus MSS cancers, we developed a resampling-based regression method by integrative modeling proteomics and transcriptomics profiles. After removing the effect of mRNA expression on protein abundance, we attributed the residue protein change associated with MSI status to differential post-transcriptional regulation, which can be formulated by the additive linear model
 |
where [P1, P2...Pn] is the protein expression vector of a gene in the n samples, [M1,M2,...Mn] is the mRNA expression vector of this gene, [G1,G2,...Gn] is the MSI-status of the n samples, α is regression intercept, and ε is the error term. βT is the regression coefficient for evaluating the effect of the mRNA expression on protein abundance, which can be regarded as translational efficiency. βPT is the regression coefficient for estimating the residue protein change associated with MSI status beyond the effect of mRNA expression, which can be considered as post-transcriptional change in MSI-H versus MSS cancers. Regression coefficients βT and βPT were estimated by ordinary least squares (OLS) regression. The significances of the coefficients (p-values) were determined by degrees of freedom and t-statistic values, which were calculated by the estimated coefficients divided by their standard errors. A regression model was implemented for each gene separately to estimate the significance of differential post-transcriptional regulation on individual genes.
A resampling scheme was used to obtain robust and reliable estimations. Because bootstrapping produces data sets with identical replicate items, it artificially reduces the actual variance of the original data set within each group and inflates the significance of differential expression.43 Therefore, subsampling technique instead of bootstrapping was chosen, whereby a subset of samples was sampled without replacement from the original data set. In each resampled data set, a regression model was implemented to quantify and evaluate the significance of post-transcriptional regulation change for each gene in MSI-H versus MSS cancers. Genes satisfying the threshold (an absolute value of βPT greater than 0.5 and p-value less than 0.05) were regarded to be supported by the resampling data set. Genes with very strong resampling support frequency (greater than 90%) were identified to be significantly differential post-transcriptionally regulated. Otherwise, genes were detected to be nonsignificantly changed. We studied the effect of resampling scheme and the number of resampling repetitions on the results. We found the post-transcriptional changes to be highly similar between 90 and 80% item resampling even at 100 repetitions (R = 0.999, Figure S1A). As the number of repetitions increased, the correlations between the changes in these two types of resampling improved, coming close to 1 at 1000 repetitions (Figure S1B). That is to say, 90 and 80% item resampling obtained almost identical results when we increased resampling times. Here, we reported the results on 90% item resampling and 1000 repetitions. The model was performed in the R environment (version 3.1.1), which is freely available under the GNU General Public License. The R source code for the resampling-based regression model, and the input transcriptomics and proteomics data are available at http://bioinfo.vanderbilt.edu/zhanglab/msi/index.html.
In addition to the additive model, we also built a full model that incorporates an interaction term, that is, the interaction between mRNA expression levels and the MSI-status of genes (P = α + βTM + βPTG + βIntM * G + ε). The interaction term may help reveal potentially different translational rates between MSI-H and MSS cancers. We compared the additive model and the full model using analysis of variance (ANOVA). Only one gene (HLA-DRA) showed a significant interaction effect (FDR < 0.05). Thus, the additive model is sufficient for representing the data, indicating there is a subtle, if any, difference in translational rates between MSI-H and MSS cancers.
Results and Discussion
Transcriptomics and Proteomics Signatures Characteristic of MSI-H Cancers
We analyzed 87 CRC samples in the TCGA cohort with both mRNA and protein profiles, among which 16 cancers were classified as MSI-H, 13 as MSI-L, and 58 as MSS (Table S1). Because the behavior of MSI-L cancers is similar to that of MSS in most regards, we grouped MSI-L as MSS cases as have previous studies.10
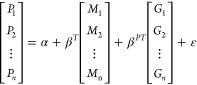
An initial comparison of transcriptomics profiles of MSI-H versus MSS cancers identified 219 differentially expressed mRNAs (|log2FC| > 1 and adjusted p-value <0.05, Table S2). There were 134 genes overexpressed in MSI-H cancers, and 85 genes were underexpressed. To illustrate the difference between the two groups, a heatmap was generated using the 219 differentially expressed genes (Figure 2A). For the 134 upregulated genes, functional enrichment analysis revealed that they are most frequently associated with immune response, defense response, cellular response to cytokine stimulus, and antigen processing and presentation, which is consistent with previous discoveries (Figure 2B).44,45 The major histocompatibility complex (MHC) regulates various kinds of immune reactions, including antigen presentation, cytotoxic response, and immune recognition.46 Notably, our analysis identified eight MHC class-II molecules overexpressed in MSI-H cancers, including CD74, HLA-DRA, HLA-DPB1, HLA-DPA1, HLA-DRB1, HLA-DQA1, HLA-DRB5, and HLA-DQB1 (Table 1), suggesting that the efficient presentation of antigens to the helper arm of the immune system plays a major role in the immunogenicity of MSI-H cancers. Although not as dramatic as the upregulation of the MHC class II machinery, the MHC class I pathway seemed activated as well due to increased expression of HLA-F, TAP1, and TAP2 in MSI-H cancers (Table 1). HLA-F belongs to MHC class I, whereas TAP1 and TAP2 transport cytosolic peptides to the endoplasmic reticulum where they bind to MHC class I molecules. The role of antigen processing and presentation by MHC I and II in MSI-induced immune response is also supported by the observation that the density of CD8 (cytotoxic T lymphocytes) and Th1 CD4 cells are higher in MSI-H than in MSS cancers.47,48 Besides antigen-directed immune response, genes functioning in natural killer cell-mediated cytotoxicity (ITGB2, RAC2, LCK, RAC3, and ICAM1) were overexpressed in MSI-H cancers (Table 1), indicating increased innate immune response as well. Compared to 64 out of the 134 upregulated genes (47.8%) involved in immune or defense response, only 10.6% of downregulated genes (9 out of 85) are associated with host defense response. Instead, genes related to metabolic process, response to metal ion, and oxidation–reduction processes are enriched in the downregulated gene list (Figure 2C).
Figure 2.
mRNA signatures associated with MSI status. (A) Hierarchical clustering of 219 differentially expressed mRNAs in MSI-H versus MSI-L/MSS cancers. Each row represents a single gene and each column represents a single patient. Genes involved in immune/defense response are represented by pink bars on the left side of the heatmap. MSI-L/MSS patients are denoted by light blue bars and MSI-H by dark gray bars on the top of the heatmap. mRNA expression values are gene-wise z-transformed and are colored red for high intensities and blue for low intensities (scale at the right bottom). (B) Enriched GO terms of upregulated mRNAs. (C) Enriched GO terms of downregulated mRNAs. X axis shows the significance of the enrichment −log10(adjusted p-value).
Table 1. Protein Expression Changes of Genes Related to MHC Class I, MHC Class II, Natural Killer whose mRNA Abundances are Significantly Overexpressed in MSI-H versus MSS/MSI-L Cancers.
| mRNA |
protein |
|||
|---|---|---|---|---|
| log2FC | adjusted p-value | log2FC | adjusted p-value | |
| MHC class II | ||||
| CD74 | 2.04 | 4.1e-07 | 1.06 | 8.3e-04 |
| HLA-DPA1 | 2.37 | 4.4e-07 | 0.62 | 0.09 |
| HLA-DRB1 | 2.21 | 4.6e-06 | 1.25 | 3.0e-03 |
| HLA-DQA1 | 2.40 | 5.0e-06 | 1.20 | 6.6e-04 |
| HLA-DRB5 | 2.12 | 9.6e-06 | 1.17 | 1.0e-03 |
| HLA-DQB1 | 2.36 | 1.3e-05 | 1.34 | 6.6e-04 |
| HLA-DRA | 2.35 | 2.7e-07 | 1.05 | 1.4e-04 |
| HLA-DPB1 | 2.29 | 3.5e-07 | 0.96 | 9.0e-03 |
| MHC class I | ||||
| HLA-F | 1.37 | 1.2e-03 | 0.44 | 0.3 |
| TAP1 | 1.41 | 9.7e-05 | 0.52 | 0.06 |
| TAP2 | 1.24 | 6.0e-06 | 0.84 | 0.06 |
| Nature killer cell-related | ||||
| ITGB2 | 1.95 | 8.0e-05 | 0.97 | 9.0e-03 |
| RAC2 | 1.01 | 1.3e-02 | 0.11 | 0.56 |
| LCK | 1.31 | 9.5e-04 | –0.09 | 0.73 |
| RAC3 | 1.03 | 3.3e-03 | –0.14 | 0.43 |
| ICAM1 | 1.52 | 8.8e-07 | 0.62 | 0.04 |
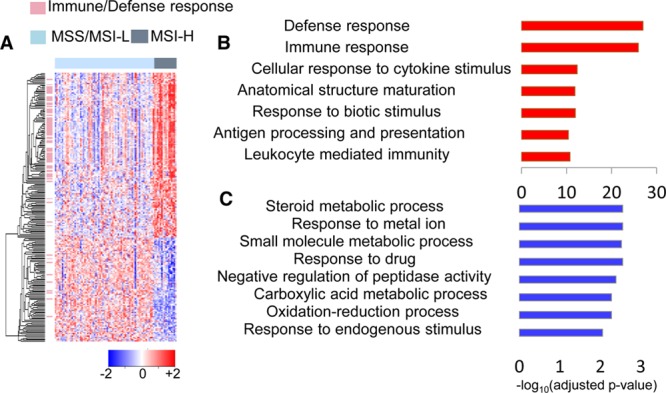
Although mRNA signatures suggest increased immune response in MSI-H cancers, it remains largely unknown how these mRNA alterations manifest themselves at the protein level. By comparing the protein expression between the 16 MSI-H and 71 MSS/MSI-L cancers, we only identified 34 upregulated proteins and 38 downregulated proteins (|log2FC| > 1 and adjusted p-value < 0.05) (Table S3). A heatmap was generated based on the 72 differentially expressed proteins between the two groups (Figure 3A). Among the 34 upregulated proteins, 24 proteins (70%) are related to immune/defense response. Upregulated proteins are specifically associated with defense response, immune response, cellular response to cytokine stimulus, response to biotic stimulus, and antigen processing and presentation (Figure 3B), which agrees with the transcriptomics signatures. Among the eight MHC II genes upregulated at the mRNA level, seven were also overexpressed at the protein level, except for HLA-DPA1, which had increased abundance but did not reach statistical significance (adjusted p-value = 0.09, Table 1). In contrast, the three MHC class I genes (HLA-F, TAP1, and TAP2) with overexpressed transcripts only showed minor overexpression at the protein level. Genes in the natural killer cell-mediated cytotoxicity pathway, although significantly overexpressed at the transcript level, were either slightly overexpressed (ITGB2 and ICAM1) or not significantly changed (RAC2, RAC3, and LCK) at the protein level (Table 1). The results further demonstrate the enhanced immunogenicity in MSI-H cancers and indicate that MHC class II-dependent immune response might play a more important role than innate and other adaptive immune response. For the 38 downregulated proteins, only three are associated with immune/defense response (MRE11A, GPX2, and ROMO1). Metabolic process, lipid oxidation, and response to oxidative stress are specifically represented in the downregulated proteins, which are consistent with transcriptomics changes between the two groups (Figure 3C).
Figure 3.
Protein signatures associated with MSI status. (A) Hierarchical clustering of 72 differentially expressed proteins in MSI-H versus MSI-L/MSS cancers. Each row represents a single gene, and each column represents a single patient. Genes involved in immune/defense response are annotated by pink bars on the left side, and gene symbols are labeled on the right side of the heatmap. MSI-L/MSS patients are denoted by light blue bars and MSI-H by dark gray bars on the top of the heatmap. Protein expression values are gene-wise z-transformed and are colored red for high abundances and blue for low abundances (scale at the right bottom). (B) Enriched GO terms of overexpressed proteins. (C) Enriched GO terms of underexpressed proteins. The x axis shows the significance of the enrichment (−log10(adjusted p-value)).
Post-Transcriptional Regulation in MSI-H Cancers
The aforementioned studies found that both mRNA and protein signatures showed increased protective host response in MSI-H cancers. An important question to ask is whether transcriptional regulation determines the whole process or whether post-transcriptional regulation also contributes to the antitumor immune response in MSI-H cancers.
Although an increasing number of research activities are investigating post-transcriptional regulation by joint analyses of protein and mRNA profiling,49−61 these studies used either an arbitrary threshold to identify genes differentially expressed at the mRNA level but not at the protein level or vice versa,49,52,54,56 or they simply calculated the correlation between mRNA and protein levels.50,53 Reliable quantification of post-transcriptional regulation remains a significant computational challenge. Here, we developed a resampling-based regression method to reliably quantify differential post-transcriptional regulation associated with MSI status. We demonstrated the power of our method by comparing the results with those from the simple comparison method using an arbitrary threshold.
Simple Comparison between Transcriptomics and Proteomics Profiles
The log–log linear correlation between mRNA and protein changes was modest (rho = 0.5, Figure 4A). A similar correlation coefficient value has been observed by many previous comparative transcriptomics and proteomics studies independent of the proteomics approach (labeling or label-free) and quantification method (spectral count or intensity-based).62,63 Therefore, the divergence between mRNA and protein is more likely to be driven by post-transcriptional regulation rather than an artifact introduced by the protein quantification method. A simple comparison between differentially expressed mRNAs and proteins (|log2FC| > 1 and adjusted p-value <0.05) identified only 26 common upregulated genes and 19 downregulated genes (Figure 4A). We did not find any genes with opposite mRNA and protein expression changes. Notably, eight genes showed significant upregulation at the protein but not at the mRNA level (Figure 4B), suggesting that post-transcriptional regulation adds new components to the protein difference between MSI-H and MSS cancers. As an example, the mRNA abundance of S100A12 was not significantly overexpressed (log2FC = 0.31, adjusted p-value = 0.71), but its protein abundance was significantly increased in MSI-H cancers (log2FC = 1.13, adjusted p-value = 0.03) (Figure 4C). Functional analysis revealed that seven out of the eight genes, all except P4HA1, are associated with immune/defense response. Specifically, CAMP, ELANE, PRTN3, S100A12, and S100A9 are highly expressed in neutrophils and are responsible for neutrophil activation and regulation of neutrophil homeostasis, migration, and recruitment.64−69 CAMP, ELANE, and PRTN3 have also been reported to interact with each other in the STRING database of protein–protein interactions,70,71 which further suggests that they might act in concert in neutrophil-mediated immune response. Consistently, a significantly higher level of myeloperoxidase immune reactivity, a key component of the neutrophil cytotoxic granules, was observed in MSI-H as compared to MSS cancers.72 Our results suggest that neutrophil-mediated immune response is mainly initiated or enhanced by post-transcriptional regulation. Although P4HA1 has not been annotated as an immune response gene, its expression in macrophages indicates a possible role of modulating macrophage-leukocyte communication and organizing the immune response.73 The fact that most post-transcriptionally regulated genes are involved in the protective host response indicates the importance of post-transcriptional regulation in initiating novel protective host defense response in MSI-H cancers, especially the neutrophil-mediated immune response.
Figure 4.
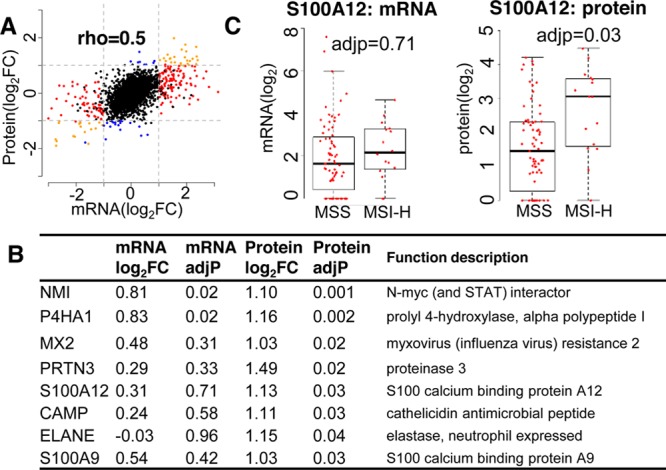
Comparison between mRNA and protein changes in MSI-H versus MSI-L/MSS cancers. (A) Scatterplot of mRNA change versus protein change. Genes differentially expressed at both mRNA and protein levels (|log2FC| > 1 and adjusted p-value < 0.05) (orange), genes detected only at the mRNA level (red), and those identified only at the protein level (blue). (B) List of 8 genes significantly upregulated at the protein level but not at the mRNA level, including fold change, adjusted p-value, and functional description. (C) mRNA and protein abundances of S100A12 in MSI-H and MSS-L/MSS cancers.
Resampling-Based Regression Model to Quantify Differential Post-Transcriptional Regulation
Although the simple comparison between differentially expressed mRNAs and proteins already indicated the critical role of post-transcriptional regulation in MSI-H cancers, the results are highly dependent on the arbitrary threshold of defining differential expression, and useful information is lost in the discretization process. More importantly, the magnitude and the statistical significance of post-transcriptional changes are hard to quantify. Here, we developed a resampling-based regression method to quantify differential post-transcriptional regulation by integrative modeling of proteomics and transcriptomics profiles (Materials and Methods). As a result, we detected 49 significantly upregulated genes and 86 significantly downregulated genes at the post-transcriptional level in MSI-H versus MSS cancers (Tables S4 and S5).
The 49 post-transcriptionally upregulated genes included all eight genes identified by the simple method (Figure 4B). As mentioned above, the simple method first chose an arbitrary threshold to define differential expression at both mRNA and protein levels and then performed the comparison to select genes only detected at one level. These eight genes were upregulated at the protein but not at the mRNA level; thus, they were identified to be post-transcriptionally enhanced by the simple method (Figure 4C). Besides the eight genes, our method discovered an additional 41 genes, among which 34 genes showed some extent of post-transcriptional upregulation but were missed by the simple method (Table S4). Thirty-two genes were moderately overexpressed at the protein level (log2FC ≥ 0.58 and adjusted p-value < 0.1), and most of their mRNA expression abundances were not significantly changed. As an example, RFC4 was moderately upregulated at the protein level (log2FC = 0.91, adjusted p-value = 0.0017) but remained unchanged at the mRNA level (log2FC = 0.24, adjusted p-value = 0.6), suggesting the role of post-transcriptional upregulation in the increase of protein abundance. However, without satisfying the stringent criteria (|log2FC| > 1 and adjusted p-value < 0.05), the moderate protein change was completely eliminated, which led to RFC4 undiscovered by the simple method (false negatives). Additionally, only two genes, CRTAP and STK4, exhibited moderate mRNA expression downregulation without protein changes, indicating the minor role of post-transcription upregulation for buffering mRNA perturbation (Table S4). The 86 post-transcriptionally downregulated genes included 17 out of 19 genes detected by the simple threshold method, except for ROMO1 and MAOA (Figure 4A). It is highly possible that these two genes were misclassified to be post-transcriptionally downregulated by the simple method due to the arbitrary threshold setting (false positives). In fact, ROMO1 and MAOA exhibited not only protein downregulation but also moderate mRNA underexpression (Table S2). However, the moderate mRNA underexpression was lost in the simple method. Among the remaining 69 genes, only three genes (CSPR2, PRKCDBP, and MAPRE2) exhibited moderately/highly overexpressed mRNA but no protein changes or even moderate protein downregulation, suggesting a minor role of post-transcriptional downregulation in buffering unwanted transcriptomics signatures. In contrast, 62 genes showed moderate protein underexpression but unchanged mRNA abundances in MSI-H versus MSS cancers, indicating a major role of post-transcriptional regulation in generating de novo protein changes (Table S5). These results demonstrated the advantage of the resampling-based regression method of reducing false negatives and false positives over the simple threshold approach.
Functional Role of Post-Transcriptional Regulation
Genes upregulated at mRNA, post-transcriptional, or protein levels in MSI-H cancers can be classified into three major groups (Gain, Maintain, and Lose; Figure 5A). Both “Maintain” and “Lose” groups showed mRNA overexpression in MSI-H cancers. However, the overexpression carried over to the protein level in the “Maintain” group but was lost in the “Lose” group. In the “Maintain” group, transcriptome changes dominated proteome alterations without any additional changes at the post-transcriptional level. As a result, upregulated mRNA signatures were sustained at the protein level. In the “Lose” group, however, transcriptome changes were altered by inconsistent or heterogeneous post-transcriptional regulation, except for CSPR2, whose mRNA overexpression was counteracted by significant post-transcriptional inhibition (Figure 5A). The post-transcriptional regulation in the group is so heterogeneous that genes were post-transcriptionally upregulated in some MSI-H cancers but downregulated in others. Because the direction and magnitudes of post-transcriptional regulation were inconsistent across MSI-H cancers, no significant post-transcriptional changes were detected in MSI-H versus MSS cancers for the “Lose” group (Figure 5A). Such heterogeneous and loosely controlled post-transcriptional regulation perturbed the mRNA signatures, making them unobservable at the protein level. Additionally, the mRNA signatures in the “Maintain” group were more likely to be kept in other independent data sets than those in the “Lose” group. We applied the differential analysis on two independent gene expression profiles of CRC cancers. One included 155 primary CRC samples, of which 77 were MSS cancers and 78 were MSI cancers (GSE13294). The other consisted of 176 samples collected from the MECC study, of which 18 were MSI-H, 23 were MSI-L, 119 were MSS, and 16 were unknown (GSE26682). We found that genes in the “Maintain” group were more likely to be upregulated than genes in the “Lose” group in the two independent data sets (Figure 5B; p = 0.0004 and p = 0.04, respectively). In comparison to the “Lose” group, the fact that the mRNA signatures of the “Maintain” group could be carried over to the protein level and were more likely to be observed in independent data sets suggests that the “Maintain” group is more important than the “Lose” group. The potentially nonfunctional transcriptomics changes in the “Lose” group were mainly removed or reduced by loosely controlled and heterogeneous post-transcriptional regulation.
Figure 5.

Genes with increased post-transcriptional regulation. (A) Hierarchical clustering of genes with upregulation either at mRNA, post-transcriptional, or protein levels. Each row represents a single gene, and each column represents a single level. The value is the regulation change of each gene at each level, which is colored blue (downregulation) or red (upregulation). The color scale is at the top of the heatmap. Three major groups are labeled on the right side: “Maintain” (green), “Gain” (red), and “Lose” (blue). How mRNA, post-transcriptional regulation, and protein changes in these three groups are illustrated beside each group. (B) Differential expression of genes in the “Maintain” (green) and the “Lose” groups (blue) on two independent mRNA expression profiles (GSE13294 and GSE26682). (C) Functional relationship between the “Maintain”, “Gain”, and “Lose” groups on the PPI network. The x axis is the shortest path length, and the y axis is the percentage of pairs with the length. Shortest path between “Gain” and “Maintain” groups are denoted by light blue, whereas the shortest path between “Lose” and “Maintain” groups are denoted by dark blue.
As compared to the genes in the “Maintain” and “Lose” groups, most genes in the “Gain” group did not show mRNA overexpression but rather exhibited de novo protein upregulation in MSI-H cancers, which was initiated by tightly controlled and homogeneous post-transcriptional upregulation. To evaluate the potential role of this group, we explored the functional relationship between key players in the “Maintain” group and those in the “Gain” group on the protein–protein interaction (PPI) network. Although the “Maintain” and “Lose” groups shared common features of mRNA upregulation, genes in the “Gain” group were more functionally related to genes in the “Maintain” group on the PPI network than those in the “Lose” group. Sixty percent of pairwise relationships between the “Gain” and “Maintain” groups had the shortest path of 2 or <2 as compared to only 55% between the “Lose” and “Maintain” groups (p < 1e-05, Figure 5C, Fisher’s exact test). These results suggest the biological importance of post-transcriptional upregulation in MSI-H cancers. Although most genes in the “Gain” group were not upregulated at the mRNA level, post-transcriptional mechanisms upregulated their protein expression levels to allow them to cofunction with key players in the “Maintain” group. Compared to the loosely controlled and heterogeneous post-transcriptional regulation in the “Lose” group that removes potentially nonfunctional transcriptomics signatures, the tightly controlled and homogeneous post-transcriptional upregulation in the “Gain” group introduces new protein signatures in MSI-H cancers.
Functional enrichment analysis found that post-transcriptionally upregulated genes are highly enriched in defense response (adjusted p-value = 0.0007), phagosome maturation (adjusted p-value = 0.02), extracellular matrix organization (adjusted p-value = 0.02), secretion by cells (adjusted p-value = 0.03), and nucleotide-excision repair (adjusted p-value = 0.04) (Table 2). In addition to the five genes (CAMP, ELANE, S100A12, PRTN3, and S100A9) involved in the neutrophil-mediated immune response, as previously mentioned, our method identified several other genes that regulate neutrophil functions (Table 3). For example, APOA2 may participate in the regulation of neutrophil activity.74 CLU is a negative regulator specific to MT6-MMP/MMP25 produced by neutrophils, suggesting that CLU plays a role at the inflammatory site where neutrophils accumulate.75 ITGAX, as a potential receptor for fibrinogen on neutrophils, induces oxidative burst in neutrophils.76 BPI and LTF are stored in the primary and secondary granules of neutrophils and affect neutrophil recruitment and activation.77,78 Our resampling-based regression method further revealed the post-transcriptionally enhanced host protective response in MSI-H cancers, especially the neutrophil-mediated immune response. Contrary to the decreased DNA synthesis and repair in MMR-deficient cell lines suggested by Halvey et al.,28 DNA damage repair genes RFC4 and RPA3 were post-transcriptionally enhanced in MSI-H patients.
Table 2. Functional Enrichment of Post-Transcriptionally Enhanced Genes.
| function | genes | adjusted p-value |
|---|---|---|
| defense response | NMI, APOA2, CLU, ELANE, CAMP, AZU1, SERPINF2, NFKB2, ITGAX, S100A9, MX2, LTF, S100A12, BPI, IFI35 | 0.0007 |
| phagosome maturation | CAMP, ATP6V1E1, LTF | 0.02 |
| extracellular matrix organization | P4HA1, ELANE, NFKB2, SERPINF2, CRTAP | 0.02 |
| secretion by cell | VGF, SEC11C, APOA2, FGG, STXBP2, CLU, SERPINF2, S100A12 | 0.03 |
| nucleotide-excision repair | RFC4, RPA3 | 0.04 |
Table 3. List of 15 Post-Transcriptionally Upregulated Genes Related to Defense Response.
| gene | log2FC | supp. freq. | neutrophil |
|---|---|---|---|
| APOA2 | 0.79 | 96% | √ |
| IFI35 | 0.58 | 94% | |
| CLU | 0.61 | 96% | √ |
| ELANE | 1.13 | 100% | √ |
| CAMP | 1.15 | 100% | √ |
| AZU1 | 1.03 | 97% | √ |
| SERPINF2 | 0.86 | 100% | |
| NFKB2 | 0.82 | 100% | |
| ITGAX | 0.73 | 99% | √ |
| S100A9 | 0.89 | 97% | √ |
| MX2 | 0.79 | 99% | |
| LTF | 0.78 | 92% | √ |
| S100A12 | 1.06 | 98% | √ |
| BPI | 1.01 | 96% | √ |
| NMI | 0.91 | 100% |
Similarly, genes downregulated at mRNA, post-transcriptional, or protein levels can also be classified into three major groups (Gain, Maintain, and Lose; Figure S2A). Most genes in the “Gain” group were post-transcriptionally repressed, inducing downregulated protein signatures in MSI-H cancers. In contrast, mRNA signatures in the “Maintain” group were sustained at the protein level without the involvement of post-transcriptional regulation, whereas most mRNA features in the “Lose” group were altered by heterogeneous post-transcriptional regulation, leading to indistinguishable protein signatures. The post-transcriptionally downregulated genes are enriched in the organic acid metabolic process (adjusted p-value = 0.004), DNA geometric change (adjusted p-value = 0.003), and cell adhesion (adjusted p-value = 0.01) (Table 4). Similar to post-transcriptional upregulation, the “Gain” group was more functionally related to the “Maintain” group than the “Lose” group on the PPI network (Figure S2B). These results suggest the role of heterogeneous post-transcriptional regulation in removing less important mRNA signatures in the “Lose” group and significant and homogeneous post-transcriptional downregulation for generating new signatures in the “Gain” group.
Table 4. Functional Enrichment of Post-Transcriptionally Downregulated Genes.
| function | genes | adjusted p-value |
|---|---|---|
| organic acid metabolic process | ACSL5, PCCB, CHDH, PCCA, MCCC1, DDAH2, ACSS2, VCAN, DARS2, ACOT11, ACAD8, ACSS1, ACOT8, TMLHE, PSMB6, B3GNT3 | 0.004 |
| DNA geometric change | MRE11A, ATRX, RAD50, NBN | 0.003 |
| cell adhesion | FBLIM1, AOC3, FERMT1, MCAM, FBLN5, VCAN, PRKG1, FERMT2, SCRIB, SORBS3, ITGA1, TGFB1I1, PTPRK, LPP | 0.01 |
| negative regulation of G1/S transition of mitotic cell cycle | KANK2, FHL1 | 0.02 |
Recent studies have explained the difference between proteome and transcriptome changes by features or post-transcriptional regulators that affect translation and protein degradation, which include RNA-binding proteins,55 small regulatory RNAs (e.g., miRNA, piRNA, antisense RNA),29,50,79 codon usage,80 and so forth. We discovered two major types of post-transcriptional regulatory mechanisms that led to mRNA and protein divergence. One is the loosely controlled post-transcriptional regulation on proteins whose abundance might not be critical for defining phenotypic differences, and the other is the tightly controlled post-transcriptional regulation to generate de novo protein signatures. Loosely controlled regulation leads to inconsistent post-transcriptional impact on different samples, which is different from the previously proposed feedback model where post-transcriptional regulators function with other regulators to reduce transcription noise.81,82 In contrast, tightly controlled regulation results in consistent post-transcriptional impact on different samples and de novo protein signatures. On the basis of matched miRNA expression data from 71 samples, we tried to explain the mRNA and protein difference in terms of miRNA activity using the Lasso approach (Figure S3A). We found several miRNAs that might be responsible for generating novel protein signatures in MSI-H cancers. Among them, three downregulated miRNAs (miR-181d, miR-552, and miR-592) were highly associated with enhanced protective host response in MSI-H cancers (Figure S3B). Interestingly, miR-552 and miR-592 were found to exhibit decreased abundances in MSI cancers as compared to MSS cancers in an independent data set,83 and miR-181 family members are known to play important roles in the immune system.84−86
Conclusions
We performed the first comprehensive comparison of proteomics profiles between microsatellite instable and stable CRC tumors and developed a novel quantitative method to evaluate differential post-transcriptional regulation by integrating transcriptomics and proteomics profiles. Proteomics signatures are characterized by an increased protective host response in MSI-H cancers, which is consistent with the features of known transcriptomics signatures. Moreover, both transcriptional and post-transcriptional regulations contribute significantly to enhanced protective host response in MSI-H cancers.
Acknowledgments
The authors wish to thank Stephanie Hoskins for editorial work on this manuscript. This work was supported by NIH (http://www.nih.gov/) grants U24 CA159988 and contract 13XS029 from Leidos Biomedical Research, Inc.
Supporting Information Available
The Supporting Information is available free of charge on the ACS Publications website at DOI: 10.1021/acs.jproteome.5b00847.
Figure S1, effect of resampling schemes and number of resampling times on the results; Figure S2: functional role of post-transcriptionally inhibited genes; and Figure S3, miRNA regulation network responsible for the mRNA and protein divergence, especially for the enhanced protective host response (PDF)
Table S1, clinical information for 87 patients; Table S2, differential expression analysis results on transcriptomics profiles between MSI-H and MSS/MSI-L cancers; Table S3, differential expression analysis results on proteomics profiles between MSI-H and MSS/MSI-L cancers; Table S4, 49 post-transcriptionally enhanced genes; and Table S5, 86 post-transcriptionally inhibited genes (XLSX)
The authors declare no competing financial interest.
Supplementary Material
References
- Haggar F. A.; Boushey R. P. Colorectal cancer epidemiology: incidence, mortality, survival, and risk factors. Clinics in colon and rectal surgery 2009, 22 (4), 191–7. 10.1055/s-0029-1242458. [DOI] [PMC free article] [PubMed] [Google Scholar]
- Worthley D. L.; Leggett B. A. Colorectal cancer: molecular features and clinical opportunities. Clinical biochemist. Reviews/Australian Association of Clinical Biochemists 2010, 31 (2), 31–8. [PMC free article] [PubMed] [Google Scholar]
- Boland C. R.; Goel A. Microsatellite instability in colorectal cancer. Gastroenterology 2010, 138 (6), 2073–2087 e3. 10.1053/j.gastro.2009.12.064. [DOI] [PMC free article] [PubMed] [Google Scholar]
- de la Chapelle A.; Hampel H. Clinical relevance of microsatellite instability in colorectal cancer. J. Clin. Oncol. 2010, 28 (20), 3380–7. 10.1200/JCO.2009.27.0652. [DOI] [PMC free article] [PubMed] [Google Scholar]
- Brueckl W. M.; Jung A.; Wein A.; Brabletz T.; Guenther K.; Nusko G.; Hahn E. G. Microsatellite instability in colorectal adenomas: relevance and clinical importance. International journal of colorectal disease 2000, 15 (4), 189–96. 10.1007/s003840000241. [DOI] [PubMed] [Google Scholar]
- Popat S.; Hubner R.; Houlston R. S. Systematic review of microsatellite instability and colorectal cancer prognosis. J. Clin. Oncol. 2005, 23 (3), 609–618. 10.1200/JCO.2005.01.086. [DOI] [PubMed] [Google Scholar]
- Wright C. M.; Dent O. F.; Barker M.; Newland R. C.; Chapuis P. H.; Bokey E. L.; Young J. P.; Leggett B. A.; Jass J. R.; Macdonald G. A. Prognostic significance of extensive microsatellite instability in sporadic clinicopathological stage C colorectal cancer. Br. J. Surg. 2000, 87 (9), 1197–202. 10.1046/j.1365-2168.2000.01508.x. [DOI] [PubMed] [Google Scholar]
- Ward R.; Meagher A.; Tomlinson I.; O’Connor T.; Norrie M.; Wu R.; Hawkins N. Microsatellite instability and the clinicopathological features of sporadic colorectal cancer. Gut 2001, 48 (6), 821–9. 10.1136/gut.48.6.821. [DOI] [PMC free article] [PubMed] [Google Scholar]
- Gryfe R.; Kim H.; Hsieh E. T.; Aronson M. D.; Holowaty E. J.; Bull S. B.; Redston M.; Gallinger S. Tumor microsatellite instability and clinical outcome in young patients with colorectal cancer. N. Engl. J. Med. 2000, 342 (2), 69–77. 10.1056/NEJM200001133420201. [DOI] [PubMed] [Google Scholar]
- Lindor N. M.; Burgart L. J.; Leontovich O.; Goldberg R. M.; Cunningham J. M.; Sargent D. J.; Walsh-Vockley C.; Petersen G. M.; Walsh M. D.; Leggett B. A.; Young J. P.; Barker M. A.; Jass J. R.; Hopper J.; Gallinger S.; Bapat B.; Redston M.; Thibodeau S. N. Immunohistochemistry versus microsatellite instability testing in phenotyping colorectal tumors. J. Clin. Oncol. 2002, 20 (4), 1043–8. 10.1200/JCO.20.4.1043. [DOI] [PubMed] [Google Scholar]
- Guidoboni M.; Gafa R.; Viel A.; Doglioni C.; Russo A.; Santini A.; Del Tin L.; Macri E.; Lanza G.; Boiocchi M.; Dolcetti R. Microsatellite instability and high content of activated cytotoxic lymphocytes identify colon cancer patients with a favorable prognosis. Am. J. Pathol. 2001, 159 (1), 297–304. 10.1016/S0002-9440(10)61695-1. [DOI] [PMC free article] [PubMed] [Google Scholar]
- Drescher K. M.; Sharma P.; Lynch H. T. Current hypotheses on how microsatellite instability leads to enhanced survival of Lynch Syndrome patients. Clin. Dev. Immunol. 2010, 2010, 1–13. 10.1155/2010/170432. [DOI] [PMC free article] [PubMed] [Google Scholar]
- Kim H.; Jen J.; Vogelstein B.; Hamilton S. R. Clinical and pathological characteristics of sporadic colorectal carcinomas with DNA replication errors in microsatellite sequences. American Journal of Pathology 1994, 145 (1), 148–56. [PMC free article] [PubMed] [Google Scholar]
- Smyrk T. C.; Watson P.; Kaul K.; Lynch H. T. Tumor-infiltrating lymphocytes are a marker for microsatellite instability in colorectal carcinoma. Cancer 2001, 91 (12), 2417–22. . [DOI] [PubMed] [Google Scholar]
- Tougeron D.; Fauquembergue E.; Rouquette A.; Le Pessot F.; Sesboue R.; Laurent M.; Berthet P.; Mauillon J.; Di Fiore F.; Sabourin J. C.; Michel P.; Tosi M.; Frebourg T.; Latouche J. B. Tumor-infiltrating lymphocytes in colorectal cancers with microsatellite instability are correlated with the number and spectrum of frameshift mutations. Mod. Pathol. 2009, 22 (9), 1186–95. 10.1038/modpathol.2009.80. [DOI] [PubMed] [Google Scholar]
- Kloor M.; Michel S.; von Knebel Doeberitz M. Immune evasion of microsatellite unstable colorectal cancers. Int. J. Cancer 2010, 127 (5), 1001–10. 10.1002/ijc.25283. [DOI] [PubMed] [Google Scholar]
- Deschoolmeester V.; Baay M.; Van Marck E.; Weyler J.; Vermeulen P.; Lardon F.; Vermorken J. B. Tumor infiltrating lymphocytes: an intriguing player in the survival of colorectal cancer patients. BMC Immunol. 2010, 11, 19. 10.1186/1471-2172-11-19. [DOI] [PMC free article] [PubMed] [Google Scholar]
- Vilar E.; Gruber S. B. Microsatellite instability in colorectal cancer-the stable evidence. Nat. Rev. Clin. Oncol. 2010, 7 (3), 153–62. 10.1038/nrclinonc.2009.237. [DOI] [PMC free article] [PubMed] [Google Scholar]
- Vilar E.; Scaltriti M.; Balmana J.; Saura C.; Guzman M.; Arribas J.; Baselga J.; Tabernero J. Microsatellite instability due to hMLH1 deficiency is associated with increased cytotoxicity to irinotecan in human colorectal cancer cell lines. Br. J. Cancer 2008, 99 (10), 1607–12. 10.1038/sj.bjc.6604691. [DOI] [PMC free article] [PubMed] [Google Scholar]
- Watanabe T.; Kobunai T.; Toda E.; Yamamoto Y.; Kanazawa T.; Kazama Y.; Tanaka J.; Tanaka T.; Konishi T.; Okayama Y.; Sugimoto Y.; Oka T.; Sasaki S.; Muto T.; Nagawa H. Distal colorectal cancers with microsatellite instability (MSI) display distinct gene expression profiles that are different from proximal MSI cancers. Cancer Res. 2006, 66 (20), 9804–8. 10.1158/0008-5472.CAN-06-1163. [DOI] [PubMed] [Google Scholar]
- Balaguer F.; Moreira L.; Lozano J. J.; Link A.; Ramirez G.; Shen Y.; Cuatrecasas M.; Arnold M.; Meltzer S. J.; Syngal S.; Stoffel E.; Jover R.; Llor X.; Castells A.; Boland C. R.; Gironella M.; Goel A. Colorectal cancers with microsatellite instability display unique miRNA profiles. Clin. Cancer Res. 2011, 17 (19), 6239–49. 10.1158/1078-0432.CCR-11-1424. [DOI] [PMC free article] [PubMed] [Google Scholar]
- Jorissen R. N.; Lipton L.; Gibbs P.; Chapman M.; Desai J.; Jones I. T.; Yeatman T. J.; East P.; Tomlinson I. P.; Verspaget H. W.; Aaltonen L. A.; Kruhoffer M.; Orntoft T. F.; Andersen C. L.; Sieber O. M. DNA copy-number alterations underlie gene expression differences between microsatellite stable and unstable colorectal cancers. Clin. Cancer Res. 2008, 14 (24), 8061–9. 10.1158/1078-0432.CCR-08-1431. [DOI] [PMC free article] [PubMed] [Google Scholar]
- Lanza G.; Ferracin M.; Gafa R.; Veronese A.; Spizzo R.; Pichiorri F.; Liu C. G.; Calin G. A.; Croce C. M.; Negrini M. mRNA/microRNA gene expression profile in microsatellite unstable colorectal cancer. Mol. Cancer 2007, 6, 54. 10.1186/1476-4598-6-54. [DOI] [PMC free article] [PubMed] [Google Scholar]
- Giacomini C. P.; Leung S. Y.; Chen X.; Yuen S. T.; Kim Y. H.; Bair E.; Pollack J. R. A gene expression signature of genetic instability in colon cancer. Cancer Res. 2005, 65 (20), 9200–5. 10.1158/0008-5472.CAN-04-4163. [DOI] [PubMed] [Google Scholar]
- Banerjea A.; Ahmed S.; Hands R. E.; Huang F.; Han X.; Shaw P. M.; Feakins R.; Bustin S. A.; Dorudi S. Colorectal cancers with microsatellite instability display mRNA expression signatures characteristic of increased immunogenicity. Mol. Cancer 2004, 3, 21. 10.1186/1476-4598-3-21. [DOI] [PMC free article] [PubMed] [Google Scholar]
- Kruhoffer M.; Jensen J. L.; Laiho P.; Dyrskjot L.; Salovaara R.; Arango D.; Birkenkamp-Demtroder K.; Sorensen F. B.; Christensen L. L.; Buhl L.; Mecklin J. P.; Jarvinen H.; Thykjaer T.; Wikman F. P.; Bech-Knudsen F.; Juhola M.; Nupponen N. N.; Laurberg S.; Andersen C. L.; Aaltonen L. A.; Orntoft T. F. Gene expression signatures for colorectal cancer microsatellite status and HNPCC. Br. J. Cancer 2005, 92 (12), 2240–8. 10.1038/sj.bjc.6602621. [DOI] [PMC free article] [PubMed] [Google Scholar]
- Kim T. M.; Laird P. W.; Park P. J. The landscape of microsatellite instability in colorectal and endometrial cancer genomes. Cell 2013, 155 (4), 858–68. 10.1016/j.cell.2013.10.015. [DOI] [PMC free article] [PubMed] [Google Scholar]
- Halvey P. J.; Wang X.; Wang J.; Bhat A. A.; Dhawan P.; Li M.; Zhang B.; Liebler D. C.; Slebos R. J. Proteogenomic analysis reveals unanticipated adaptations of colorectal tumor cells to deficiencies in DNA mismatch repair. Cancer Res. 2014, 74 (1), 387–97. 10.1158/0008-5472.CAN-13-2488. [DOI] [PMC free article] [PubMed] [Google Scholar]
- Liu Q.; Halvey P. J.; Shyr Y.; Slebos R. J.; Liebler D. C.; Zhang B. Integrative omics analysis reveals the importance and scope of translational repression in microRNA-mediated regulation. Mol. Cell. Proteomics 2013, 12 (7), 1900–11. 10.1074/mcp.M112.025783. [DOI] [PMC free article] [PubMed] [Google Scholar]
- Zhang B.; Wang J.; Wang X.; Zhu J.; Liu Q.; Shi Z.; Chambers M. C.; Zimmerman L. J.; Shaddox K. F.; Kim S.; Davies S. R.; Wang S.; Wang P.; Kinsinger C. R.; Rivers R. C.; Rodriguez H.; Townsend R. R.; Ellis M. J.; Carr S. A.; Tabb D. L.; Coffey R. J.; Slebos R. J.; Liebler D. C.; Nci C. Proteogenomic characterization of human colon and rectal cancer. Nature 2014, 513 (7518), 382–7. 10.1038/nature13438. [DOI] [PMC free article] [PubMed] [Google Scholar]
- Cancer Genome Atlas N. Comprehensive molecular characterization of human colon and rectal cancer. Nature 2012, 487 (7407), 330–7. 10.1038/nature11252. [DOI] [PMC free article] [PubMed] [Google Scholar]
- Wang K.; Singh D.; Zeng Z.; Coleman S. J.; Huang Y.; Savich G. L.; He X.; Mieczkowski P.; Grimm S. A.; Perou C. M.; MacLeod J. N.; Chiang D. Y.; Prins J. F.; Liu J. MapSplice: accurate mapping of RNA-seq reads for splice junction discovery. Nucleic Acids Res. 2010, 38 (18), e178. 10.1093/nar/gkq622. [DOI] [PMC free article] [PubMed] [Google Scholar]
- Li B.; Dewey C. N. RSEM: accurate transcript quantification from RNA-Seq data with or without a reference genome. BMC Bioinf. 2011, 12, 323. 10.1186/1471-2105-12-323. [DOI] [PMC free article] [PubMed] [Google Scholar]
- Ning K.; Fermin D.; Nesvizhskii A. I. Comparative analysis of different label-free mass spectrometry based protein abundance estimates and their correlation with RNA-Seq gene expression data. J. Proteome Res. 2012, 11 (4), 2261–71. 10.1021/pr201052x. [DOI] [PMC free article] [PubMed] [Google Scholar]
- Zybailov B.; Coleman M. K.; Florens L.; Washburn M. P. Correlation of relative abundance ratios derived from peptide ion chromatograms and spectrum counting for quantitative proteomic analysis using stable isotope labeling. Anal. Chem. 2005, 77 (19), 6218–24. 10.1021/ac050846r. [DOI] [PubMed] [Google Scholar]
- Old W. M.; Meyer-Arendt K.; Aveline-Wolf L.; Pierce K. G.; Mendoza A.; Sevinsky J. R.; Resing K. A.; Ahn N. G. Comparison of label-free methods for quantifying human proteins by shotgun proteomics. Mol. Cell. Proteomics 2005, 4 (10), 1487–502. 10.1074/mcp.M500084-MCP200. [DOI] [PubMed] [Google Scholar]
- Slebos R. J.; Jehmlich N.; Brown B.; Yin Z.; Chung C. H.; Yarbrough W. G.; Liebler D. C. Proteomic analysis of oropharyngeal carcinomas reveals novel HPV-associated biological pathways. Int. J. Cancer 2013, 132 (3), 568–79. 10.1002/ijc.27699. [DOI] [PMC free article] [PubMed] [Google Scholar]
- Smyth G. K. Linear models and empirical bayes methods for assessing differential expression in microarray experiments. Stat. Appl. Genet. Mol. Biol. 2004, 3, 1. 10.2202/1544-6115.1027. [DOI] [PubMed] [Google Scholar]
- Benjamini Y.; Hochberg Y. Controlling the False Discovery Rate - a Practical and Powerful Approach to Multiple Testing. Journal of the Royal Statistical Society Series B-Methodological 1995, 57 (1), 289–300. [Google Scholar]
- Wang J.; Duncan D.; Shi Z.; Zhang B. WEB-based GEne SeT AnaLysis Toolkit (WebGestalt): update 2013. Nucleic Acids Res. 2013, 41, W77–83. 10.1093/nar/gkt439. [DOI] [PMC free article] [PubMed] [Google Scholar]
- Zhang B.; Kirov S.; Snoddy J. WebGestalt: an integrated system for exploring gene sets in various biological contexts. Nucleic Acids Res. 2005, 33, W741–8. 10.1093/nar/gki475. [DOI] [PMC free article] [PubMed] [Google Scholar]
- Wang J.; Duncan D.; Shi Z.; Zhang B. WEB-based GEne SeT AnaLysis Toolkit (WebGestalt): update 2013. Nucleic Acids Res. 2013, 41, W77–83. 10.1093/nar/gkt439. [DOI] [PMC free article] [PubMed] [Google Scholar]
- Monti S.; Tamayo P.; Mesirov J.; Golub T. Consensus clustering: A resampling-based method for class discovery and visualization of gene expression microarray data. Machine Learning 2003, 52 (1–2), 91–118. 10.1023/A:1023949509487. [DOI] [Google Scholar]
- Bustin S. A.; Li S. R.; Phillips S.; Dorudi S. Expression of HLA class II in colorectal cancer: evidence for enhanced immunogenicity of microsatellite-instability-positive tumours. Tumor Biol. 2001, 22 (5), 294–8. 10.1159/000050630. [DOI] [PubMed] [Google Scholar]
- Lovig T.; Andersen S. N.; Thorstensen L.; Diep C. B.; Meling G. I.; Lothe R. A.; Rognum T. O. Strong HLA-DR expression in microsatellite stable carcinomas of the large bowel is associated with good prognosis. Br. J. Cancer 2002, 87 (7), 756–62. 10.1038/sj.bjc.6600507. [DOI] [PMC free article] [PubMed] [Google Scholar]
- Allcock R. J. The major histocompatibility complex: a paradigm for studies of the human genome. Methods Mol. Biol. 2012, 882, 1–7. 10.1007/978-1-61779-842-9_1. [DOI] [PubMed] [Google Scholar]
- Boissiere-Michot F.; Lazennec G.; Frugier H.; Jarlier M.; Roca L.; Duffour J.; Du Paty E.; Laune D.; Blanchard F.; Le Pessot F.; Sabourin J. C.; Bibeau F. Characterization of an adaptive immune response in microsatellite-instable colorectal cancer. Oncoimmunology 2014, 3, e29256. 10.4161/onci.29256. [DOI] [PMC free article] [PubMed] [Google Scholar]
- Lee S. Y.; Miyai K.; Han H. S.; Hwang D. Y.; Seong M. K.; Chung H.; Jung B. H.; Devaraj B.; McGuire K. L.; Carethers J. M. Microsatellite instability, EMAST, and morphology associations with T cell infiltration in colorectal neoplasia. Dig. Dis. Sci. 2012, 57 (1), 72–8. 10.1007/s10620-011-1825-5. [DOI] [PMC free article] [PubMed] [Google Scholar]
- Lan P.; Li W.; Schmidt W. Complementary proteome and transcriptome profiling in phosphate-deficient Arabidopsis roots reveals multiple levels of gene regulation. Mol. Cell. Proteomics 2012, 11 (11), 1156–66. 10.1074/mcp.M112.020461. [DOI] [PMC free article] [PubMed] [Google Scholar]
- Gan H.; Cai T.; Lin X.; Wu Y.; Wang X.; Yang F.; Han C. Integrative proteomic and transcriptomic analyses reveal multiple post-transcriptional regulatory mechanisms of mouse spermatogenesis. Mol. Cell. Proteomics 2013, 12 (5), 1144–57. 10.1074/mcp.M112.020123. [DOI] [PMC free article] [PubMed] [Google Scholar]
- Lee M. V.; Topper S. E.; Hubler S. L.; Hose J.; Wenger C. D.; Coon J. J.; Gasch A. P. A dynamic model of proteome changes reveals new roles for transcript alteration in yeast. Mol. Syst. Biol. 2011, 7, 514. 10.1038/msb.2011.48. [DOI] [PMC free article] [PubMed] [Google Scholar]
- Khositseth S.; Pisitkun T.; Slentz D. H.; Wang G.; Hoffert J. D.; Knepper M. A.; Yu M. J. Quantitative protein and mRNA profiling shows selective post-transcriptional control of protein expression by vasopressin in kidney cells. Mol. Cell. Proteomics 2011, 10 (1), M110 004036. 10.1074/mcp.M110.004036. [DOI] [PMC free article] [PubMed] [Google Scholar]
- Juschke C.; Dohnal I.; Pichler P.; Harzer H.; Swart R.; Ammerer G.; Mechtler K.; Knoblich J. A. Transcriptome and proteome quantification of a tumor model provides novel insights into post-transcriptional gene regulation. Genome Biol. 2013, 14 (11), r133. 10.1186/gb-2013-14-11-r133. [DOI] [PMC free article] [PubMed] [Google Scholar]
- Fournier M. L.; Paulson A.; Pavelka N.; Mosley A. L.; Gaudenz K.; Bradford W. D.; Glynn E.; Li H.; Sardiu M. E.; Fleharty B.; Seidel C.; Florens L.; Washburn M. P. Delayed correlation of mRNA and protein expression in rapamycin-treated cells and a role for Ggc1 in cellular sensitivity to rapamycin. Mol. Cell. Proteomics 2010, 9 (2), 271–84. 10.1074/mcp.M900415-MCP200. [DOI] [PMC free article] [PubMed] [Google Scholar]
- Vogel C.; Silva G. M.; Marcotte E. M. Protein expression regulation under oxidative stress. Mol. Cell. Proteomics 2011, 10 (12), M111 009217. 10.1074/mcp.M111.009217. [DOI] [PMC free article] [PubMed] [Google Scholar]
- Lackner D. H.; Schmidt M. W.; Wu S.; Wolf D. A.; Bahler J. Regulation of transcriptome, translation, and proteome in response to environmental stress in fission yeast. Genome Biol. 2012, 13 (4), R25. 10.1186/gb-2012-13-4-r25. [DOI] [PMC free article] [PubMed] [Google Scholar]
- Vogel C.; Abreu S.; Ko D.; Le S. Y.; Shapiro B. A.; Burns S. C.; Sandhu D.; Boutz D. R.; Marcotte E. M.; Penalva L. O. Sequence signatures and mRNA concentration can explain two-thirds of protein abundance variation in a human cell line. Mol. Syst. Biol. 2010, 6, 400. 10.1038/msb.2010.59. [DOI] [PMC free article] [PubMed] [Google Scholar]
- Foss E. J.; Radulovic D.; Shaffer S. A.; Goodlett D. R.; Kruglyak L.; Bedalov A. Genetic variation shapes protein networks mainly through non-transcriptional mechanisms. PLoS Biol. 2011, 9 (9), e1001144. 10.1371/journal.pbio.1001144. [DOI] [PMC free article] [PubMed] [Google Scholar]
- Ghazalpour A.; Bennett B.; Petyuk V. A.; Orozco L.; Hagopian R.; Mungrue I. N.; Farber C. R.; Sinsheimer J.; Kang H. M.; Furlotte N.; Park C. C.; Wen P. Z.; Brewer H.; Weitz K.; Camp D. G. 2nd; Pan C.; Yordanova R.; Neuhaus I.; Tilford C.; Siemers N.; Gargalovic P.; Eskin E.; Kirchgessner T.; Smith D. J.; Smith R. D.; Lusis A. J. Comparative analysis of proteome and transcriptome variation in mouse. PLoS Genet. 2011, 7 (6), e1001393. 10.1371/journal.pgen.1001393. [DOI] [PMC free article] [PubMed] [Google Scholar]
- Wu L.; Candille S. I.; Choi Y.; Xie D.; Jiang L.; Li-Pook-Than J.; Tang H.; Snyder M. Variation and genetic control of protein abundance in humans. Nature 2013, 499 (7456), 79–82. 10.1038/nature12223. [DOI] [PMC free article] [PubMed] [Google Scholar]
- Wei Y.-N.; Hu H.-Y.; Xie G.-C.; Fu N.; Ning Z.-B.; Zeng R.; Khaitovich P. Transcript and protein expression decoupling reveals RNA binding proteins and miRNAs as potential modulators of human aging. Genome biology 2015, 16, 41. 10.1186/s13059-015-0608-2. [DOI] [PMC free article] [PubMed] [Google Scholar]
- Wang X.; Liu Q.; Zhang B. Leveraging the complementary nature of RNA-Seq and shotgun proteomics data. Proteomics 2014, 14 (23–24), 2676–87. 10.1002/pmic.201400184. [DOI] [PMC free article] [PubMed] [Google Scholar]
- Cho Y. E.; Moon P. G.; Lee J. E.; Singh T. S.; Kang W.; Lee H. C.; Lee M. H.; Kim S. H.; Baek M. C. Integrative analysis of proteomic and transcriptomic data for identification of pathways related to simvastatin-induced hepatotoxicity. Proteomics 2013, 13 (8), 1257–75. 10.1002/pmic.201200368. [DOI] [PubMed] [Google Scholar]
- De Filippo K.; Neill D. R.; Mathies M.; Bangert M.; McNeill E.; Kadioglu A.; Hogg N. A new protective role for S100A9 in regulation of neutrophil recruitment during invasive pneumococcal pneumonia. FASEB J. 2014, 28 (8), 3600–8. 10.1096/fj.13-247460. [DOI] [PubMed] [Google Scholar]
- Kessenbrock K.; Frohlich L.; Sixt M.; Lammermann T.; Pfister H.; Bateman A.; Belaaouaj A.; Ring J.; Ollert M.; Fassler R.; Jenne D. E. Proteinase 3 and neutrophil elastase enhance inflammation in mice by inactivating antiinflammatory progranulin. J. Clin. Invest. 2008, 118 (7), 2438–47. 10.1172/JCI34694. [DOI] [PMC free article] [PubMed] [Google Scholar]
- Guignard F.; Mauel J.; Markert M. Identification and characterization of a novel human neutrophil protein related to the S100 family. Biochem. J. 1995, 309 (Pt 2), 395–401. 10.1042/bj3090395. [DOI] [PMC free article] [PubMed] [Google Scholar]
- Rouleau P.; Vandal K.; Ryckman C.; Poubelle P. E.; Boivin A.; Talbot M.; Tessier P. A. The calcium-binding protein S100A12 induces neutrophil adhesion, migration, and release from bone marrow in mouse at concentrations similar to those found in human inflammatory arthritis. Clin. Immunol. 2003, 107 (1), 46–54. 10.1016/S1521-6616(02)00043-8. [DOI] [PubMed] [Google Scholar]
- Simard J. C.; Girard D.; Tessier P. A. Induction of neutrophil degranulation by S100A9 via a MAPK-dependent mechanism. J. Leukocyte Biol. 2010, 87 (5), 905–14. 10.1189/jlb.1009676. [DOI] [PubMed] [Google Scholar]
- Ryckman C.; McColl S. R.; Vandal K.; de Medicis R.; Lussier A.; Poubelle P. E.; Tessier P. A. Role of S100A8 and S100A9 in neutrophil recruitment in response to monosodium urate monohydrate crystals in the air-pouch model of acute gouty arthritis. Arthritis Rheum. 2003, 48 (8), 2310–20. 10.1002/art.11079. [DOI] [PubMed] [Google Scholar]
- Sorensen O. E.; Follin P.; Johnsen A. H.; Calafat J.; Tjabringa G. S.; Hiemstra P. S.; Borregaard N. Human cathelicidin, hCAP-18, is processed to the antimicrobial peptide LL-37 by extracellular cleavage with proteinase 3. Blood 2001, 97 (12), 3951–9. 10.1182/blood.V97.12.3951. [DOI] [PubMed] [Google Scholar]
- Szklarczyk D.; Franceschini A.; Kuhn M.; Simonovic M.; Roth A.; Minguez P.; Doerks T.; Stark M.; Muller J.; Bork P.; Jensen L. J.; von Mering C. The STRING database in 2011: functional interaction networks of proteins, globally integrated and scored. Nucleic Acids Res. 2011, 39, D561–8. 10.1093/nar/gkq973. [DOI] [PMC free article] [PubMed] [Google Scholar]
- Roncucci L.; Mora E.; Mariani F.; Bursi S.; Pezzi A.; Rossi G.; Pedroni M.; Luppi D.; Santoro L.; Monni S.; Manenti A.; Bertani A.; Merighi A.; Benatti P.; Di Gregorio C.; de Leon P. M. Myeloperoxidase-positive cell infiltration in colorectal carcinogenesis as indicator of colorectal cancer risk. Cancer Epidemiol., Biomarkers Prev. 2008, 17 (9), 2291–7. 10.1158/1055-9965.EPI-08-0224. [DOI] [PubMed] [Google Scholar]
- Schnoor M.; Cullen P.; Lorkowski J.; Stolle K.; Robenek H.; Troyer D.; Rauterberg J.; Lorkowski S. Production of type VI collagen by human macrophages: a new dimension in macrophage functional heterogeneity. J. Immunol. 2008, 180 (8), 5707–19. 10.4049/jimmunol.180.8.5707. [DOI] [PubMed] [Google Scholar]
- Furlaneto C. J.; Ribeiro F. P.; Hatanaka E.; Souza G. M.; Cassatella M. A.; Campa A. Apolipoproteins A-I and A-II downregulate neutrophil functions. Lipids 2002, 37 (9), 925–8. 10.1007/s11745-002-0981-4. [DOI] [PubMed] [Google Scholar]
- Matsuda A.; Itoh Y.; Koshikawa N.; Akizawa T.; Yana I.; Seiki M. Clusterin, an abundant serum factor, is a possible negative regulator of MT6-MMP/MMP-25 produced by neutrophils. J. Biol. Chem. 2003, 278 (38), 36350–7. 10.1074/jbc.M301509200. [DOI] [PubMed] [Google Scholar]
- Ruf A.; Patscheke H. Platelet-induced neutrophil activation: platelet-expressed fibrinogen induces the oxidative burst in neutrophils by an interaction with CD11C/CD18. Br. J. Haematol. 1995, 90 (4), 791–6. 10.1111/j.1365-2141.1995.tb05197.x. [DOI] [PubMed] [Google Scholar]
- Hochreiter-Hufford A.; Ravichandran K. S. Clearing the dead: apoptotic cell sensing, recognition, engulfment, and digestion. Cold Spring Harbor Perspect. Biol. 2013, 5 (1), a008748. 10.1101/cshperspect.a008748. [DOI] [PMC free article] [PubMed] [Google Scholar]
- Calafat J.; Janssen H.; Knol E. F.; Malm J.; Egesten A. The bactericidal/permeability-increasing protein (BPI) is membrane-associated in azurophil granules of human neutrophils, and relocation occurs upon cellular activation. APMIS: acta pathologica, microbiologica, et immunologica Scandinavica 2000, 108 (3), 201–8. 10.1034/j.1600-0463.2000.d01-45.x. [DOI] [PubMed] [Google Scholar]
- Nassa G.; Tarallo R.; Giurato G.; De Filippo M. R.; Ravo M.; Rizzo F.; Stellato C.; Ambrosino C.; Baumann M.; Lietzen N.; Nyman T. A.; Weisz A. Post-transcriptional regulation of human breast cancer cell proteome by unliganded estrogen receptor beta via microRNAs. Mol. Cell. Proteomics 2014, 13 (4), 1076–90. 10.1074/mcp.M113.030403. [DOI] [PMC free article] [PubMed] [Google Scholar]
- Olivares-Hernandez R.; Bordel S.; Nielsen J. Codon usage variability determines the correlation between proteome and transcriptome fold changes. BMC Syst. Biol. 2011, 5, 33. 10.1186/1752-0509-5-33. [DOI] [PMC free article] [PubMed] [Google Scholar]
- Joshi A.; Beck Y.; Michoel T. Post-transcriptional regulatory networks play a key role in noise reduction that is conserved from micro-organisms to mammals. FEBS J. 2012, 279 (18), 3501–12. 10.1111/j.1742-4658.2012.08571.x. [DOI] [PubMed] [Google Scholar]
- Halbeisen R. E.; Gerber A. P. Stress-dependent coordination of transcriptome and translatome in yeast. PLoS Biol. 2009, 7 (5), e1000105. 10.1371/journal.pbio.1000105. [DOI] [PMC free article] [PubMed] [Google Scholar]
- Sarver A. L.; French A. J.; Borralho P. M.; Thayanithy V.; Oberg A. L.; Silverstein K. A.; Morlan B. W.; Riska S. M.; Boardman L. A.; Cunningham J. M.; Subramanian S.; Wang L.; Smyrk T. C.; Rodrigues C. M.; Thibodeau S. N.; Steer C. J. Human colon cancer profiles show differential microRNA expression depending on mismatch repair status and are characteristic of undifferentiated proliferative states. BMC Cancer 2009, 9, 401. 10.1186/1471-2407-9-401. [DOI] [PMC free article] [PubMed] [Google Scholar]
- Li Q. J.; Chau J.; Ebert P. J.; Sylvester G.; Min H.; Liu G.; Braich R.; Manoharan M.; Soutschek J.; Skare P.; Klein L. O.; Davis M. M.; Chen C. Z. miR-181a is an intrinsic modulator of T cell sensitivity and selection. Cell 2007, 129 (1), 147–61. 10.1016/j.cell.2007.03.008. [DOI] [PubMed] [Google Scholar]
- Xue Q.; Guo Z. Y.; Li W.; Wen W. H.; Meng Y. L.; Jia L. T.; Wang J.; Yao L. B.; Jin B. Q.; Wang T.; Yang A. G. Human activated CD4(+) T lymphocytes increase IL-2 expression by downregulating microRNA-181c. Mol. Immunol. 2011, 48 (4), 592–9. 10.1016/j.molimm.2010.10.021. [DOI] [PubMed] [Google Scholar]
- Williams A.; Henao-Mejia J.; Harman C. C.; Flavell R. A. miR-181 and metabolic regulation in the immune system. Cold Spring Harbor Symp. Quant. Biol. 2013, 78, 223–30. 10.1101/sqb.2013.78.020024. [DOI] [PubMed] [Google Scholar]
Associated Data
This section collects any data citations, data availability statements, or supplementary materials included in this article.