Abstract
Background
Equivalence of laboratory tests over time is important for longitudinal studies. Even a small systematic difference (bias) can result in substantial misclassification.
Methods
We selected 200 Atherosclerosis Risk in Communities Study participants attending all 5 study visits over 25 years. Eight analytes were re-measured in 2011–13 from stored blood samples from multiple visits: creatinine, uric acid, glucose, total cholesterol, HDL-cholesterol, LDL-cholesterol, triglycerides, and high-sensitivity C-reactive protein. Original values were recalibrated to re-measured values using Deming regression. Differences >10% were considered to reflect substantial bias, and correction equations were applied to affected analytes in the total study population. We examined trends in chronic kidney disease (CKD) pre- and post-recalibration.
Results
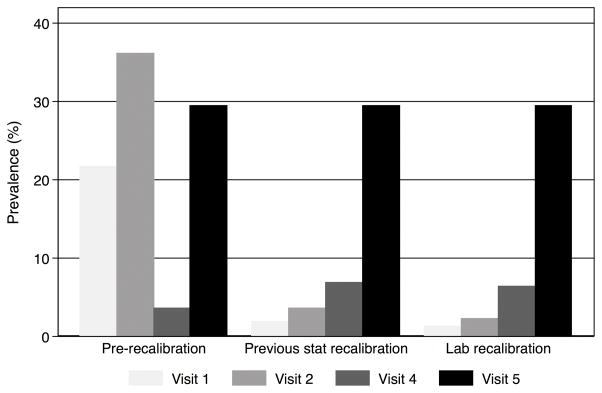
Repeat measures were highly correlated with original values (Pearson’s r>0.85 after removing outliers [median 4.5% of paired measurements]), but 2 of 8 analytes (creatinine and uric acid) had differences >10%. Original values of creatinine and uric acid were recalibrated to current values using correction equations. CKD prevalence differed substantially after recalibration of creatinine (visits 1, 2, 4 and 5 pre-recalibration: 21.7%, 36.1%, 3.5%, 29.4%; post-recalibration: 1.3%, 2.2%, 6.4%, 29.4%). For HDL-cholesterol, the current direct enzymatic method differed substantially from magnesium dextran precipitation used during visits 1–4.
Conclusions
Analytes re-measured in samples stored for ~25 years were highly correlated with original values, but two of the 8 analytes showed substantial bias at multiple visits. Laboratory recalibration improved reproducibility of test results across visits and resulted in substantial differences in CKD prevalence. We demonstrate the importance of consistent recalibration of laboratory assays in a cohort study.
INTRODUCTION
Equivalence of laboratory measurements over time is of central importance for studies of trends in disease prevalence, incidence, and progression. Assay recalibration is especially crucial when a disease is defined categorically using biomarker levels above or below a certain cut-point. Even a small amount of systematic difference can lead to substantial misclassification of disease (1–7). Small differences (e.g. <10%) may have little impact on clinical decision-making or classification of individuals with values far from a clinical cutoff. However, at the population level, small, systematic differences shift the entire distribution of a biomarker, resulting in biased estimates of prevalence and incidence. Large epidemiologic studies must carefully assess the recalibration and reproducibility of their biomarker measurements to ensure equivalence across study visits to ensure accurate comparisons over time.
Leveraging previous experience in the laboratory recalibration of biomarkers in large epidemiologic studies (1,2,5,8–10), we undertook recalibration of 8 key laboratory tests in the Atherosclerosis Risk in Communities (ARIC) Study. The ARIC Study is a prospective cohort with over 25 years of follow-up and five study visits during which blood samples were collected. Our objectives were: 1) to assess the equivalence of different biomarker measurements across the five ARIC visits, focusing on those where there were changes in research laboratories, sample types, and/or measurement procedure; 2) to determine recalibration corrections for those analytes lacking equivalence; and 3) to assess trends in each analyte before and after recalibration. To illustrate the potential impact of laboratory measurement change on prevalence and incidence of an important chronic disease, we examined trends in estimated chronic kidney disease (CKD) prevalence as defined from creatinine concentrations before and after recalibration in this study population.
METHODS
Study population
The ARIC Study is an ongoing community-based cohort of 15,792 adults who were enrolled between 1987 and 1989 from four communities in the United States (11). Participants have been invited to four follow-up examinations (visits 2 through 5 which took place during 1990–92, 1993–95, 1996–98 and 2011–13, respectively). An institutional review board at each site approved all procedures, and all study participants provided written informed consent.
We selected a subsample of participants for re-measurement of biomarkers in stored blood samples. Among participants who had plasma samples available at all five visits, 200 were selected using stratified random sampling within 16 strata based on 5-year baseline age categories (45–49 years, 50–54 years, 55–59 years, and 60–65 years), gender, and race/ethnicity (white or black). The purpose of stratified random sampling was to have the distribution of these characteristics in the recalibration subsample broadly reflect that in the full ARIC cohort.
Laboratory Measurement Procedures
A total of 8 analytes were included in the main recalibration study: creatinine, uric acid, glucose, total cholesterol, high density lipoprotein cholesterol (HDL-c), low density lipoprotein cholesterol (LDL-c), triglycerides, and high-sensitivity C-reactive protein (hs-CRP). Analytes were originally measured in the entire cohort at each of the five visits, except for creatinine and uric acid, which were not measured at visit 3, and hs-CRP, which was not measured at visits 1 or 3. Seven additional analytes that were not remeasured at all 5 study visits were also included in a secondary recalibration study: alanine aminotransferase (ALT), aspartate aminotransferase (AST), gamma-glutamyl transpeptidase (GGT), N-terminal pro-brain natriuretic peptide (NT-proBNP), high-sensitivity cardiac troponin T (hs-cTnT), β2-microglobulin (B2M) and beta-trace protein (BTP) (see Online Supplement for details).
Analytes were re-assayed at Baylor College of Medicine during 2011–13 (Figure 1). For each of the 200 participants in the recalibration subsample, measurements were obtained from stored samples from all 5 visits. Samples had been stored at −70 degrees Celsius since original collection, which took place during visits from 1987 to 2013. LDL-c was calculated from the concentrations of total cholesterol, HDL-c, and triglycerides by the Friedewald formula. See eTable 1 (all eTables are in the Online Supplement) for a detailed description of assay methodologies and approaches. When available, commutable certified reference materials (CRMs) were included with some of the assays to verify the traceability of measurement results to certified values of current high quality reference materials (eTable 5).
Figure 1. Study design for original measurements in the entire ARIC cohort and re-assay of analytes in the recalibration subsample.
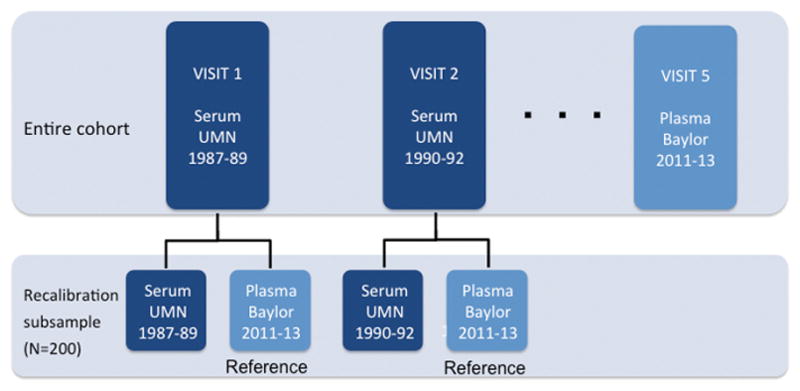
Note that this schematic is an example, and details may vary by analyte. See eTable 1 for methods and assays used for each analyte.
Statistical analysis
Recalibration
For each analyte re-assayed in the recalibration subsample, we calculated descriptive statistics for the original value, the re-assayed value (in 2011–2013), and the difference of the two values. We calculated the percent bias for each analyte as:
We recalibrated all previous measurement values to the most recent results of measurement procedures performed in 2011–2013. Scatterplots were used to visually compare measurement values. To remove outliers that were extraneous to the recalibration process, we used an iterative outlier removal process. This approach is based on the assumption that outliers (defined as differences >3 standard deviations from the mean difference) are likely due to a non-analytic error-related process, such as isolated sample degradation or data entry error, which would not be relevant to the recalibration. Briefly, observations greater than 3 standard deviations from the mean difference were defined as outliers and removed. We then calculated the new standard deviation and mean in the new dataset and values >3 standard deviations away from the mean difference were excluded. This procedure was repeated until no outliers remained. After exclusion of outliers, we conducted Deming regression of the original versus re-assayed measurement values (12,13). For analytes with differences >10%, recalibration equations were derived from the Deming regression coefficients.
Impact of Recalibration
We assessed trends in original values and recalibrated measurement values over time in the total study population, both unadjusted and adjusted for the following covariates: gender, race-center, body mass index, diabetes (self-reported physician diagnosis or medication use), current smoking status (current versus former/never), and hypertension (diastolic blood pressure ≥90 mmHg, systolic blood pressure ≥140 mmHg or antihypertensive use). We plotted the mean analyte value pre- and post-recalibration by age at each visit (unadjusted graphs); as well as the predicted residual from the regression of the analyte value on the aforementioned covariates against age at each visit (adjusted graphs). We obtained the intercept (centered at the mean age at visit 1 [54 years]) and slope for the regression lines plotted for each analyte at each visit to enable quantitative comparison of trends over time across visits before and after recalibration.
We calculated estimated glomerular filtration rate (eGFR) (using both original values for and recalibrated creatinine) using the 2009 CKD Epidemiology Collaboration (CKD-EPI) creatinine equation, which requires use of isotope dilution mass spectrometry IDMS-traceable creatinine measurements (14). We defined prevalent CKD (stage 3+) as eGFR<60 mL/min/1.73 m2; and incident CKD (stage 3+) at visits 2, 4 and 5 as eGFR<60 mL/min/1.73 m2 with an eGFR decline of ≥25% since visit 1. We compared the prevalence of CKD at visits 1, 2, 4 and 5 pre- and post-recalibration by estimating the proportion of participants with eGFR<60 mL/min/1.73 m2 at each visit. For comparison, we also calculated the prevalence of CKD at each visit using creatinine values that were recalibrated without having identified and excluded outliers. We calculated the incidence rate of CKD among persons with no CKD at visit 1 who attended visit 2, again comparing results before and after recalibration. We also compared the results to recalibration in previous studies, which largely relied on statistical, rather than laboratory recalibration. We will consider statistical recalibration to be recalibration based on statistics, in a setting in which analytes were not re-measured; and laboratory recalibration to be recalibration based on re-measurement of analytes.
All statistical analyses were conducted using Stata version 13.0 (StataCorp, College Station, Texas).
RESULTS
Baseline Characteristics of the Recalibration Subsample
The distribution of age and gender in the 200-participant recalibration subsample was similar to that of the total ARIC cohort (Table 1). The recalibration subsample consisted of fewer white participants than the entire ARIC cohort (63% and 73%, respectively). Since inclusion in the recalibration subsample required attendance at all study visits during the 25 years of follow-up, subsample participants tended to be healthier compared to the entire cohort. For example, at visit 1, participants in the subsample had a lower mean BMI (26.9 versus 27.7 kg/m2 in the entire cohort) and a lower prevalence of current smoking (19% versus 26%), hypertension (24% versus 35%), and coronary heart disease (2% versus 5%).
Table 1.
Clinical and sociodemographic characteristics of recalibration subsample and entire ARIC cohort at baseline (1987–89)
| Baseline Characteristics | Recalibration Subsample (N=200) | Entire ARIC cohort (N=15,792) |
|---|---|---|
|
|
||
| Mean (SD) or N (%) | Mean (SD) or N (%) | |
|
|
||
| Age, years | 53.0 (5.4) | 54.2 (5.8) |
| Male | 96 (48%) | 7,082 (45%) |
| Race/ethnicity | ||
| White | 126 (63%) | 11,478 (73%) |
| Black | 74 (37%) | 4,266 (27%) |
| Other | 0 (0%) | 48 (0%) |
| Education | ||
| Less than high school | 30 (15%) | 3,767 (24%) |
| High school or college | 76 (38%) | 6,412 (41%) |
| More than college | 92 (47%) | 5,586 (35%) |
| Study site | ||
| Forsyth, NC | 54 (27%) | 4,035 (26%) |
| Jackson, MS | 61 (30.5%) | 3,728 (24%) |
| Minneapolis, MN | 45 (22.5%) | 4,009 (25%) |
| Washington County, MD | 40 (20%) | 4,020 (25%) |
| Body mass index, kg/m2 | 26.9 (4.5) | 27.7 (5.4) |
| Current smoking | 38 (19%) | 4,132 (26%) |
| Hypertension | 47 (24%) | 5,504 (35%) |
| Prevalent coronary heart disease | 4 (2%) | 766 (5%) |
3 participants missing hypertension status; 1 participant missing prevalent CHD status; 2 participants missing education level
Hypertension defined as diastolic blood pressure>90 mmHg or systolic blood pressure>140 or anti-hypertensive medication use
Prevalent coronary heart disease defined as history of MI, MI from ECG, history of heart/arterial surgery, coronary bypass or angioplasty
In the entire ARIC cohort, 16 missing smoking status; 80 missing hypertension status; 344 missing prevalent CHD status; 27 participants missing education level
Estimates of Bias in Original Values
Overall, there were 4.5% of paired measurement values that were considered outliers and removed using iterative outlier removal (described above). After removal of these outliers, re-assayed measurement values were highly correlated with original values (of 28 comparisons of the 8 analytes across multiple visits, 43% had Pearson’s r>0.95 and 18% had r>0.99). Bias was <10% for all analytes except creatinine and uric acid (Table 2). Lipids, glucose and hs-CRP measurement values showed the lowest overall percent bias. Creatinine had particularly high bias: 49%, 47% and 13% at visits 1, 2 and 4, respectively. Comparisons of original and re-assay methods for HDL-c revealed substantial differences. However, we do not recommend recalibration of HDL-c across visits in the ARIC Study, since the method used to conduct assays at the most recent visit in 2011–13 (visit 5) and within the recalibration subsample was a direct enzymatic method, which differs substantially from magnesium dextran precipitation methodology used during visits 1–4 (eTable 1).
Table 2.
Recalibration recommendations to maximize reproducibility across visits 1 through 5
| Original Specimen Type, Lab$ | Re-assayed Specimen Type, Lab | % of observations excluded as outliers | Mean* of Original Measure | Mean* of Newly Assayed Measure | % Bias† | Recommendation to be applied to entire ARIC cohort | |
|---|---|---|---|---|---|---|---|
|
|
|||||||
| Creatinine, mg/dL | |||||||
| Visit 1 | Serum, UMN | Plasma, BCM | 7.5% | 1.12 | 0.75 | 49% | Recalibrated creatinine = Old creatinine −0.37 |
| Visit 2 | Serum, UMN | Plasma, BCM | 4.0% | 1.16 | 0.79 | 47% | Recalibrated creatinine =Old creatinine−0.37 |
| Visit 4 | Plasma, BCM | Plasma, BCM | 0% | 0.75 | 0.86 | 13% | Recalibrated creatinine = Old creatinine +0.11 |
| Visit 5 | Serum, UMN | Plasma, BCM | N/A‡ | 1.03 | 1.08 | N/A‡ | Reference |
| Uric Acid, mg/dL | |||||||
| Visit 1 | Serum, UMN | Plasma, BCM | 4.5% | 5.99 | 5.19 | 15% | Recalibrated uric acid= Old uric acid − 0.80 |
| Visit 2 | Serum, UMN | Plasma, BCM | 4.5% | 6.36 | 5.12 | 24% | Recalibrated uric acid = −0.47 + 0.88* Old uric acid |
| Visit 4 | Plasma, BCM | Plasma, BCM | 2.5% | 5.56 | 5.38 | 3% | Recalibrated uric acid = −0.04 + 0.97* Old uric acid |
| Visit 5 | Serum, UMN | Plasma, BCM | N/A‡ | 6.04 | 6.06 | N/A‡ | Reference |
| Glucose, mg/dL | |||||||
| Visit 1 | Serum, UMN | Plasma, BCM | 0.0% | 101.7 | 99.5 | 2% | No recalibration |
| Visit 2 | Serum, UMN | Plasma, BCM | 2.5% | 105.2 | 101.3 | 4% | No recalibration |
| Visit 3 | Plasma BCM | Plasma, BCM | 1.5% | 100.8 | 101.4 | 1% | No recalibration |
| Visit 4 | Plasma, BCM | Plasma, BCM | 6.0% | 104.8 | 102.6 | 2% | No recalibration |
| Visit 5 | Plasma, BCM | Plasma, BCM | N/A‡ | 109.4 | 107.2 | N/A‡ | Reference |
| Total cholesterol, mg/dL | |||||||
| Visit 1 | Plasma, BCM | Plasma, BCM | 5.5% | 207.5 | 196.4 | 6% | No recalibration |
| Visit 2 | Plasma, BCM | Plasma, BCM | 7.0% | 202.5 | 199.3 | 2% | No recalibration |
| Visit 3 | Plasma, BCM | Plasma, BCM | 1.5% | 201.7 | 202.8 | 1% | No recalibration |
| Visit 4 | Plasma, BCM | Plasma, BCM | 1.0% | 195.9 | 199.5 | 2% | No recalibration |
| Visit 5 | Plasma, BCM | Plasma, BCM | N/A‡ | 194.0 | N/A§ | N/A‡ | Reference |
| HDL-c, mg/dL | |||||||
| Visit 1 | Plasma, BCM | Plasma, BCM | 1.0% | 52.7 | 48.8|| | 8% | Recalibrated HDL = 0.67* Old HDL + 13.36 |
| Visit 2 | Plasma, BCM | Plasma, BCM | 5.5% | 48.4 | 47.4|| | 2% | Recalibrated HDL = 0.73* Old HDL + 12.09 |
| Visit 3 | Plasma, BCM | Plasma, BCM | 2.0% | 50.1 | 46.6|| | 8% | Recalibrated HDL = 0.68* Old HDL + 12.52 |
| Visit 4 | Plasma, BCM | Plasma, BCM | 3.0% | 48.1 | 46.4|| | 4% | Recalibrated HDL = 0.74* Old HDL + 10.97 |
| Visit 5 | Plasma, BCM | Plasma, BCM | N/A‡ | 57.3|| | N/A§ | N/A‡ | Reference [Different method than previous visits – Do not recommend recalibrating] |
| LDL-c, mg/dL | |||||||
| Visit 1 | Plasma, BCM | Plasma, BCM | 5.1% | 132.2 | 126.1 | 5% | No recalibration |
| Visit 2 | Plasma, BCM | Plasma, BCM | 7.1% | 128.1 | 126.4 | 1% | No recalibration |
| Visit 3 | Plasma, BCM | Plasma, BCM | 3.1% | 125.2 | 128.8 | 3% | No recalibration |
| Visit 4 | Plasma, BCM | Plasma, BCM | 2.0% | 120.3 | 125.5 | 4% | No recalibration |
| Visit 5 | Plasma, BCM | Plasma, BCM | N/A‡ | 108.8 | N/A§ | N/A‡ | Reference |
| Triglycerides, mg/dL | |||||||
| Visit 1 | Plasma, BCM | Plasma, BCM | 9.0% | 106.6 | 104.9 | 2% | No recalibration |
| Visit 2 | Plasma, BCM | Plasma, BCM | 5.0% | 124.2 | 128.3 | 3% | No recalibration |
| Visit 3 | Plasma, BCM | Plasma, BCM | 5.5% | 128.6 | 134.4 | 4% | No recalibration |
| Visit 4 | Plasma, BCM | Plasma, BCM | 6.5% | 133.1 | 136.3 | 2% | No recalibration |
| Visit 5 | Plasma, BCM | Plasma, BCM | N/A‡ | 128.5 | N/A§ | N/A‡ | Reference |
| hs-CRP, mg/L | |||||||
| Visit 2 | Serum, UMN | Plasma, BCM | 7.0% | 2.38 | 2.51 | 5% | No recalibration |
| Visit 4 | Plasma, BCM | Plasma, BCM | 11.0% | 2.76 | 3.02 | 9% | No recalibration |
| Visit 5 | Plasma, BCM | Plasma, BCM | N/A‡ | 2.36 | 2.37 | N/A‡ | Reference |
Means are after exclusion of outliers
Percent bias calculated as: Percent bias = |Mean of original value − Mean of re-assayed value|/Mean of re-assayed value. The re-assayed value was considered the gold standard value.
N/A – not applicable, since the original and new assays were considered and assumed to be equivalent
Re-assays were not conducted for all samples
Note that these measurements were obtained using an enzymatic method, whereas original measurements for visits 1–4 were obtained using a precipitation method
UMN -- University of Minnesota; BCM -- Baylor College of Medicine
Development and Application of Recalibration Equations
Based on descriptive statistics of original and new measurement values and Deming regression results (Table 2 and eTable 4), we developed recalibration equations for creatinine and uric acid at visits 1, 2, and 4. Recalibration equations were applied to the values in the entire cohort (Table 2).
Recalibration Effects on eGFR Trajectories
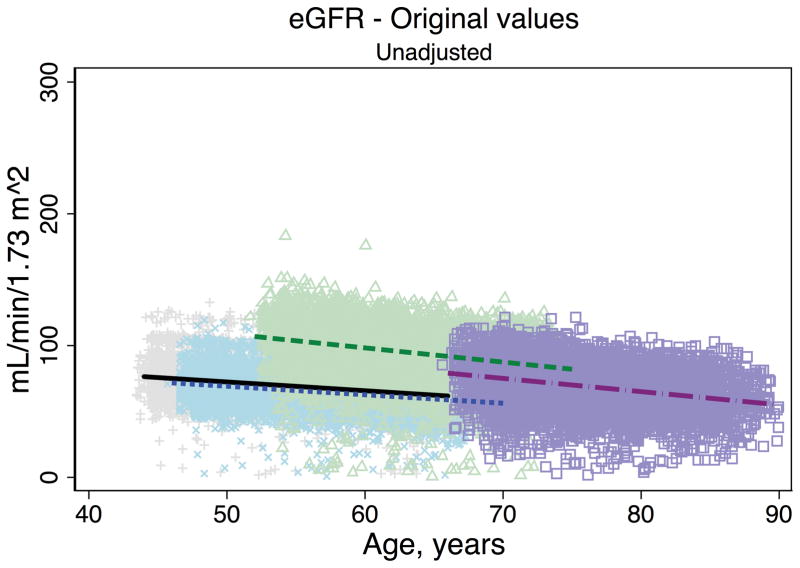
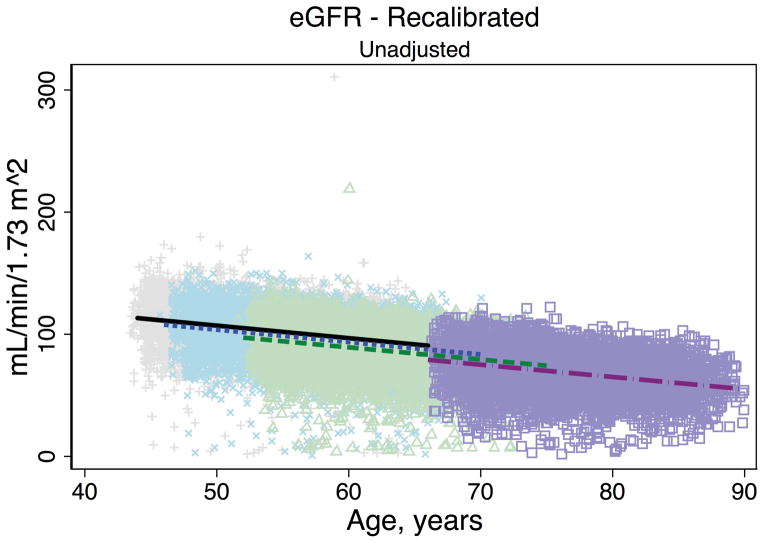
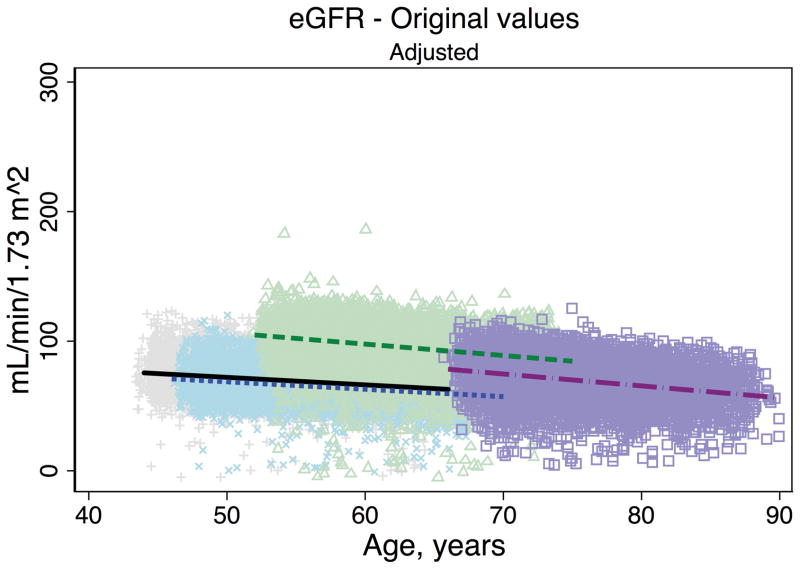
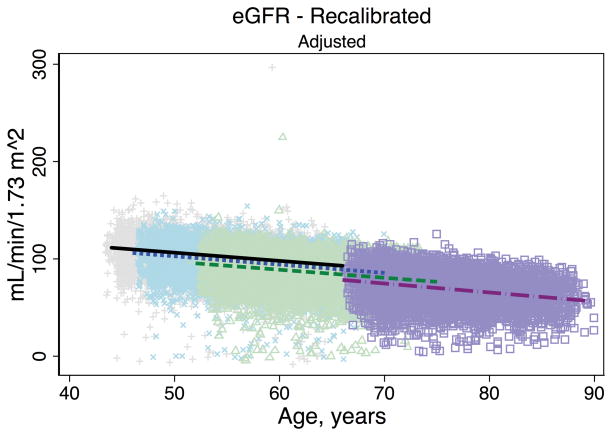
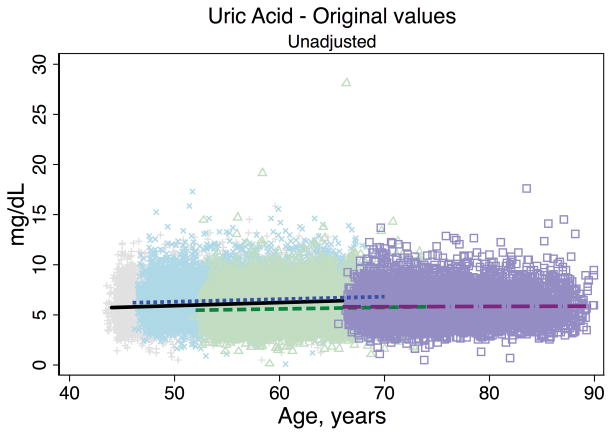
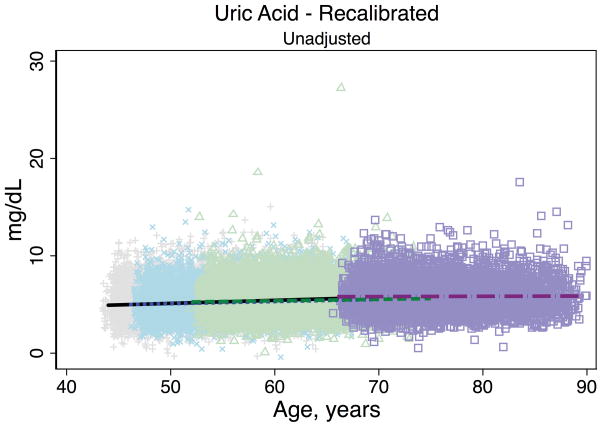
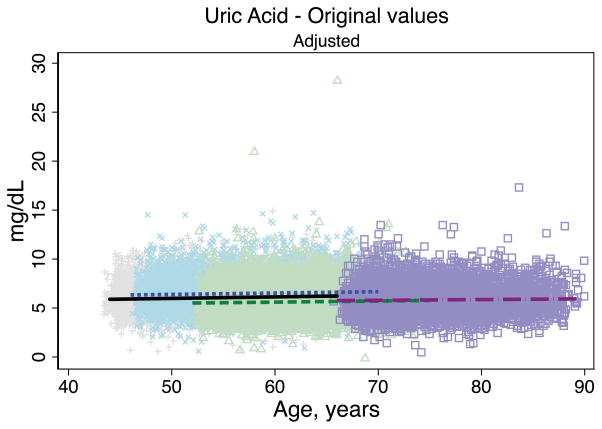
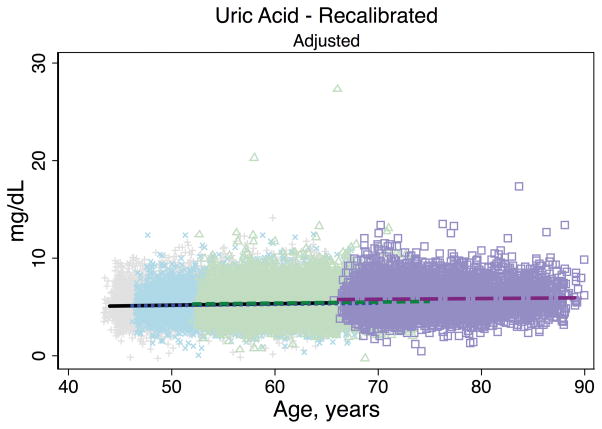
Trends in eGFR over time were substantially better aligned after recalibration equations were applied to the entire cohort (Figure 2, Panel A). The intercepts and slopes from the regression of mean eGFR on age by visit (centered at the mean age at visit 1 [54 years]) were more similar after recalibration. Intercepts ranged from 101.4 to 163.0 mL/min/1.73 m2 before recalibration and 144.2 to 158.4 mL/min/1.73 m2 after recalibration; slopes ranged from −0.6 to −1.1 mL/min/1.73 m2 per year of age before recalibration and were nearly identical across visits at −1.0 mL/min/1.73 m2 per year of age after recalibration (Table 3). Similarly, trends in uric acid were improved after the recalibration equations were applied to the entire cohort (Figure 2, Panel B; Table 3).
Figure 2. Regression of estimated GFR and uric acid versus age across five ARIC visits before and after applying the laboratory recalibration.
To examine trends versus age across visit, the lines plotted are creatinine-based eGFR (Panel A1: original values, unadjusted; Panel A2: recalibrated, unadjusted; Panel A3: original values, adjusted; Panel A4: recalibrated, adjusted) and uric acid (Panel B1: original values, unadjusted; Panel B2: recalibrated, unadjusted; Panel B3: original values, adjusted; Panel B4: recalibrated, adjusted) regressed on age (separately for each visit). Adjusted analyses included adjustment for gender, race-center, body mass index, diabetes (self-reported physician diagnosis or medication use), current smoking status (current versus former/never) and hypertension (diastolic blood pressure ≥90 mmHg, systolic blood pressure ≥140 mmHg or antihypertensive use). Recalibration allows us to remove differences in methodologic issues to the best of our ability and differences that remain are largely due to changes over time.
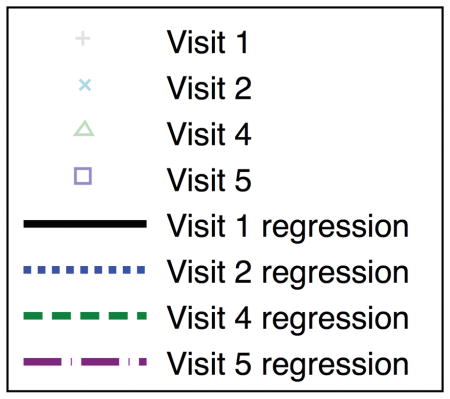
Table 3.
Comparisons of intercepts* and slopes of regression lines of mean analytes versus age
| Intercept* | Slope | |||||||||
|---|---|---|---|---|---|---|---|---|---|---|
|
|
|
|||||||||
| Visit 1 (1987–89) | Visit 2 (1990–92) | Visit 3 (1993–95) | Visit 4 (1996–98) | Visit 5 (2011–13) | Visit 1 (1987–89) | Visit 2 (1990–92) | Visit 3 (1993–95) | Visit 4 (1996–98) | Visit 5 (2011–13) | |
|
| ||||||||||
| Intercept (SD) | Intercept (SD) | Intercept (SD) | Intercept (SD) | Intercept (SD) | Slope (SD) | Slope (SD) | Slope (SD) | Slope (SD) | Slope (SD) | |
|
|
||||||||||
| eGFR, mL/min/1.73 m2 | ||||||||||
| Before recalibration | 69.74 (0.10) | 66.55 (0.11) | NA | 104.73 (0.26) | 90.90 (0.94) | −0.67 (0.02) | −0.64 (0.02) | NA | −1.08 (0.02) | −0.99 (0.04) |
| After recalibration | 102.99 (0.12) | 99.68 (0.14) | NA | 95.27 (0.27) | 90.90 (0.94) | −1.03 (0.02) | −1.02 (0.02) | NA | −1.00 (0.03) | −0.99 (0.04) |
| Creatinine, mg/dL | ||||||||||
| Before recalibration | 1.11 (0.003) | 1.14 (0.004) | NA | 0.71 (0.01) | 0.80 (0.02) | 0.0045 (0.0006) | 0.0042 (0.0006) | NA | 0.0051 (0.0007) | 0.0090 (0.0011) |
| After recalibration | 0.74 (0.003) | 0.77 (0.004) | NA | 0.82 (0.01) | 0.80 (0.02) | 0.0045 (0.0006) | 0.0042 (0.0006) | NA | 0.0051 (0.0007) | 0.0090 (0.0011) |
| Uric acid, mg/dL | ||||||||||
| Before recalibration | 6.04 (0.01) | 6.41 (0.02) | NA | 5.50 (0.03) | 5.77 (0.09) | 0.0312 (0.0022) | 0.0252 (0.0024) | NA | 0.0155 (0.0025) | 0.0021 (0.0039) |
| After recalibration | 5.24 (0.01) | 5.17 (0.01) | NA | 5.29 (0.03) | 5.77 (0.09) | 0.0312 (0.0022) | 0.0221 (0.0021) | NA | 0.0150 (0.0024) | 0.0021 (0.0039) |
Regression lines are centered at age 54 years, the mean age at visit 1.
The bolded values indicate those that were recalibrated
Results are from linear regression of mean analyte (or mean eGFR) on age at each visit.
Recalibration Effects on CKD Prevalence and Incidence
Compared with the prevalence of CKD determined by eGFR from original values for creatinine at visits 1, 2, 4 and 5 (21.7%, 36.1%, 3.5%, and 29.4%, respectively), the prevalence of CKD from recalibrated creatinine at these same visits was 1.3%, 2.2%, 6.4%, and 29.4%. In comparison, statistical recalibration in previous papers yielded prevalences of 1.9%, 3.6%, and 6.8% for visits 1, 2 and 4 (Figure 3). If we had recalibrated creatinine without removing any outliers, the prevalence estimates for CKD at each visit would have been higher than obtained using either the current recalibration or the previous statistical recalibration: 8.5%, 3.4%, and 6.5% for visits 1, 2 and 4, respectively. Among the 12,228 participants with no CKD at baseline defined by eGFR calculated using either original or recalibrated creatinine values, 1,157 and 1,480 participants developed CKD using original values for creatinine and recalibrated creatinine, respectively. Among persons who had no CKD at baseline and attended visit 2, the incidence rate of CKD was 7.1 per 1,000 person-years and 8.9 per 1,000 person-years, as defined by eGFR using original values for creatinine and recalibrated creatinine, respectively.
Figure 3. Comparison of prevalence estimates of chronic kidney disease before and after recalibration of creatinine.
Chronic kidney disease was defined as eGFR<60 mL/min/1.73 m2
Creatinine recalibration equations from a previous statistical recalibration were: (Original-0.24)*0.95 for visits 1 and 2; and (Original+0.18)*0.95 for visit 4
DISCUSSION
This rigorously performed laboratory recalibration study of blood analytes measured at 5 study visits spanning approximately 25 years of data collection in the ARIC Study demonstrated that many measurements were equivalent over time and did not require recalibration. Correlations over time in values of re-measured analytes ranged from high to very high. We found substantial bias in 2 analytes (creatinine and uric acid), which we addressed by developing recalibration equations in a subsample and applying these recalibrations to the entire cohort. Using CKD as an example, we demonstrated that assuming equivalence of measurement values across time without confirmation by a rigorous recalibration study can result in substantial under- or overestimates of prevalence and incidence of disease. Additionally, the assay method for HDL-c was different during visit 5, suggesting comparison of HDL-c measurement values across visits in ARIC or other studies that include both a direct enzymatic and precipitation method has serious limitations. Although the direct HDL-c method did show good agreement with commutable CRMs in our study, the accuracy of direct measurement of HDL-c for risk classification has been called into question, especially in the setting of hypertriglyceridemia (15). Alternatively, it is possible that HDL-c measurement values using the direct enzymatic method during the recalibration study were affected by long-term sample storage (up to 25 years), since all original lipid analyses were performed on either fresh (visits 1–4) or short-term (<1 week) frozen samples (visit 5). There is a paucity of data on the effects of long-term sample storage on HDL-c measurement values by direct methods. For those analytes that did require recalibration, alignment of values across visits was achieved and will strengthen future longitudinal analyses in this cohort.
CKD was chosen as an important example since classification is based on laboratory assessment of an eGFR threshold, and accurate characterization of trajectories of eGFR is of direct clinical interest (16–20). The dramatic impact of creatinine recalibration on CKD estimates has been reported in previous studies (2,4,21). CKD prevalence and incidence estimates before and after recalibration of creatinine can differ substantially. In our study, a naïve calculation of eGFR using original values for creatinine resulted in a substantial overestimate of the baseline CKD prevalence and underestimate of the CKD incidence rate. Baseline eGFR values were higher at visit 1 after recalibrating creatinine. Since the definition of incident CKD required a 25% or greater decline in eGFR since visit 1, a greater number of participants fulfilled these criteria after recalibration of creatinine. We noticed greater percent bias in creatinine at visits 1 and 2 when measurements were conducted in an era prior to the purposeful change in creatinine assay result traceability using isotope dilution reference measurement procedures (22). Whereas the evaluation of creatinine equivalence over time should be routine in studies of CKD trends, it is particularly important in studies such as ours, which span a long time period. Creatinine assay recalibration is known to have changed and inter-laboratory reproducibility has improved dramatically over the past decade (23).
Indirect statistical correction (as opposed to direct laboratory recalibration) may be implemented where re-assay of analytes is not feasible. This method may be achieved by selecting a “healthy subset” of the study population, in which the mean value of the analyte of interest, adjusted for any potential confounders, would be expected to be constant over time. Any significant deviation in mean analyte level over time would then be considered artifactual, and recalibration based on statistics achieved by normalizing to a particular reference year/time period. This technique has been successfully implemented in previous studies (5,6). Previous recalibration studies in ARIC were statistical in nature, rather than laboratory-based (24,25). Indeed, a previous statistical correction was used by ARIC investigators to recalibrate serum creatinine, by adjusting the serum creatinine values from the ARIC study population to have the same age, sex and race adjusted means as recalibrated NHANES data (24). The magnitude and direction of this statistical correction was reasonably similar to our direct recalibration (CKD prevalence of 1.9%, 3.6% and 6.8% at visits 1, 2 and 4 from previous statistical recalibration; compared to 21.7%, 36.1%, and 3.5% using original values; and 1.3%, 2.2%, and 6.4% with laboratory recalibration). In settings where laboratory recalibration may not be feasible, statistical recalibration can provide insight into the magnitude of bias and provide an approach to minimizing it.
There were several key strengths of this study. First, ARIC enrolled nearly 16,000 participants, which enabled calculation of precise estimates of CKD prevalence and incidence before and after application of recalibration equations to the full cohort. Second, ARIC is an ongoing prospective cohort study, which currently has approximately 25 years of follow-up. To date, there have been five visits, which allowed for comparison of trends over time before and after recalibration. Finally, our design was efficient and is potentially generalizable to other cohort studies, for which there may be interest in conducting laboratory recalibration studies in a practical and cost-effective manner.
Our study had several limitations. We assumed that the recalibration equations derived from the subset of 200 participants included in the recalibration subsample applied to the entire ARIC study population. These 200 samples may not have covered the entire range of values for each analyte, and there may be instances, especially at very low or very high values, in which the recalibration is an under- or overcorrection. Nonetheless, we were able to demonstrate improved similarity of creatinine and uric acid measurement values across ARIC visits using this approach. Our approach also assumes that the biomarkers being measured were in fact stable at −70° C in the stored samples and that changes in measurement procedure results were not simply due to changes in the biomarker concentrations in the samples over time.
Recalibration of laboratory measures is a key concern for large epidemiologic studies, particularly when trends in disease prevalence and risk factors over long periods of time are of interest. Reasons for poor reproducibility of measurement values over time may include changes in laboratory measurement procedures, more subtle differences in pre-analytical specimen processing or laboratory technique, sample degradation during storage, sample evaporation due to poorly sealed vials, and/or use of different specimen types. However, laboratory recalibration over time assumes the analyte is stable at the storage conditions. High correlations and improvement after recalibration supports this assumption for all the analytes examined in the current study, but it is difficult to test for long storage periods. Although availability of follow-up data for many years can be a major strength of large cohort studies, ensuring equivalence of measurement values over a long duration of time is instrumental in achieving accurate analytic results. Periodic recalibration studies are required to determine if measurement values lack equivalence and to recommend appropriate corrections, if necessary. Traceability of values to stable references would be ideal. Whereas external high quality reference measurement procedures or commutable reference materials are not available for all analytes, they can at least be recalibrated to an internal reference for within-study comparisons over time. The techniques we used were standard laboratory and statistical analytic methods, and we encourage their use in large epidemiologic studies.
Supplementary Material
Acknowledgments
FUNDING AND ACKNOWLEDGMENTS
The Atherosclerosis Risk in Communities Study is carried out as a collaborative study supported by National Heart, Lung, and Blood Institute contracts (HHSN268201100005C, HHSN268201100006C, HHSN268201100007C, HHSN268201100008C, HHSN268201100009C, HHSN268201100010C, HHSN268201100011C, and HHSN268201100012C). The ARIC Neurocognitive Study is supported by NIH/NHLBI grants U01 HL096902, U01 HL096812, U01 HL096899, U01 HL096814 and U01 HL096917. This research was supported by NIH/NIDDK grant R01 DK089174 to E. Selvin. M. Grams is supported by NIH/NIDDK grant K08 DK092287. C.M. Parrinello is supported by NIH/NHLBI Cardiovascular Epidemiology training grant T32HL007024. Roche Diagnostics Corporation donated the assays for the visit 2 hs-CRP, NT-proBNP, AST, ALT, GGT and B2M and also the hs-cTnT and NT-proBNP testing kits at visits 4 and 5. The authors thank the staff and participants of the ARIC study for their important contributions.
Footnotes
This work was presented at the American Heart Association Epidemiology and Prevention and Nutrition, Physical Activity and Metabolism 2014 Scientific Sessions, to be held in San Francisco, CA March 18–21, 2014.
Disclosures: R.C. Hoogeveen and C.M. Ballantyne have received grant support from Roche Diagnostics Corporation and are co-investigators on a provisional patent filed by Roche for use of biomarkers in heart failure prediction. Drs. Selvin and Ballantyne have served on an advisory board for Roche Diagnostics.
References
- 1.Selvin E, Manzi J, Stevens LA, Van Lente F, Lacher DA, Levey AS, et al. Calibration of serum creatinine in the National Health and Nutrition Examination Surveys (NHANES) 1988–1994, 1999–2004. Am J Kidney Dis. 2007;50:918–26. doi: 10.1053/j.ajkd.2007.08.020. [DOI] [PubMed] [Google Scholar]
- 2.Coresh J, Astor BC, McQuillan G, Kusek J, Greene T, Van Lente F, et al. Calibration and random variation of the serum creatinine assay as critical elements of using equations to estimate glomerular filtration rate. Am J Kidney Dis. 2002;39:920–9. doi: 10.1053/ajkd.2002.32765. [DOI] [PubMed] [Google Scholar]
- 3.Coresh J, Astor BC, Greene T, Eknoyan G, Levey AS. Prevalence of chronic kidney disease and decreased kidney function in the adult US population: Third National Health and Nutrition Examination Survey. Am J Kidney Dis. 2003;41:1–12. doi: 10.1053/ajkd.2003.50007. [DOI] [PubMed] [Google Scholar]
- 4.Grams ME, Juraschek SP, Selvin E, Foster MC, Inker LA, Eckfeldt JH, et al. Trends in the prevalence of reduced GFR in the United States: a comparison of creatinine- and cystatin C-based estimates. Am J Kidney Dis. 2013;62:253–60. doi: 10.1053/j.ajkd.2013.03.013. [DOI] [PMC free article] [PubMed] [Google Scholar]
- 5.Coresh J, Selvin E, Stevens LA, Manzi J, Kusek JW, Eggers P, et al. Prevalence of chronic kidney disease in the United States. JAMA American Medical Association. 2007;298:2038–47. doi: 10.1001/jama.298.17.2038. [DOI] [PubMed] [Google Scholar]
- 6.Selvin E, Parrinello CM, Sacks DB, Coresh J. Trends in Prevalence and Control of Diabetes in the United States, 1988–1994 and 1999–2010. Ann Intern Med American College of Physicians. 2014;160:517. doi: 10.7326/M13-2411. [DOI] [PMC free article] [PubMed] [Google Scholar]
- 7.Coresh J, Eknoyan G, Levey AS. Estimating the prevalence of low glomerular filtration rate requires attention to the creatinine assay calibration. J Am Soc Nephrol. 2002;13:2811–2. doi: 10.1097/01.asn.0000037420.89149.c9. author reply 2812–6. [DOI] [PubMed] [Google Scholar]
- 8.Selvin E, Juraschek SP, Eckfeldt J, Levey AS, Inker LA, Coresh J. Am J Kidney Dis. Vol. 61. Elsevier Inc; 2013. Within-person variability in kidney measures; pp. 716–22. [DOI] [PMC free article] [PubMed] [Google Scholar]
- 9.Levey AS, Coresh J, Greene T, Marsh J, Stevens LA, Kusek JW, et al. Expressing the Modification of Diet in Renal Disease Study equation for estimating glomerular filtration rate with standardized serum creatinine values. Clin Chem. 2007;53:766–72. doi: 10.1373/clinchem.2006.077180. [DOI] [PubMed] [Google Scholar]
- 10.Selvin E, Juraschek SP, Eckfeldt J, Levey AS, Inker LA, Coresh J. Calibration of cystatin C in the National Health and Nutrition Examination Surveys (NHANES) Am J Kidney Dis. 2013;61:353–4. doi: 10.1053/j.ajkd.2012.09.013. [DOI] [PMC free article] [PubMed] [Google Scholar]
- 11.The Atherosclerosis Risk in Communities (ARIC) Study: design and objectives. The ARIC investigators. Am J Epidemiol. 1989;129:687–702. [PubMed] [Google Scholar]
- 12.Cornbleet PJ, Gochman N. Incorrect least-squares regression coefficients in method-comparison analysis. Clin Chem. 1979;25:432–8. [PubMed] [Google Scholar]
- 13.Linnet K. Evaluation of regression procedures for methods comparison studies. Clin Chem. 1993;39:424–32. [PubMed] [Google Scholar]
- 14.Levey AS, Stevens LA, Schmid CH, Zhang YL, Castro AF, Feldman HI, et al. A new equation to estimate glomerular filtration rate. Ann Intern Med. 2009;150:604–12. doi: 10.7326/0003-4819-150-9-200905050-00006. [DOI] [PMC free article] [PubMed] [Google Scholar]
- 15.Langlois MR, Descamps OS, van der Laarse A, Weykamp C, Baum H, Pulkki K, et al. Atherosclerosis. Vol. 233. Elsevier Ltd; 2014. Clinical impact of direct HDLc and LDLc method bias in hypertriglyceridemia. A simulation study of the EAS-EFLM Collaborative Project Group; pp. 83–90. [DOI] [PubMed] [Google Scholar]
- 16.Rosansky SJ. Renal function trajectory is more important than chronic kidney disease stage for managing patients with chronic kidney disease. Am J Nephrol. 2012;36:1–10. doi: 10.1159/000339327. [DOI] [PubMed] [Google Scholar]
- 17.Robinson-Cohen C, Littman AJ, Duncan GE, Weiss NS, Sachs MC, Ruzinski J, et al. Physical activity and change in estimated GFR among persons with CKD. J Am Soc Nephrol. 2014;25:399–406. doi: 10.1681/ASN.2013040392. [DOI] [PMC free article] [PubMed] [Google Scholar]
- 18.O’Hare AM, Batten A, Burrows NR, Pavkov ME, Taylor L, Gupta I, et al. Trajectories of kidney function decline in the 2 years before initiation of long-term dialysis. Am J Kidney Dis. 2012;59:513–22. doi: 10.1053/j.ajkd.2011.11.044. [DOI] [PMC free article] [PubMed] [Google Scholar]
- 19.Li L, Astor BC, Lewis J, Hu B, Appel LJ, Lipkowitz MS, et al. Longitudinal progression trajectory of GFR among patients with CKD. Am J Kidney Dis. 2012;59:504–12. doi: 10.1053/j.ajkd.2011.12.009. [DOI] [PMC free article] [PubMed] [Google Scholar]
- 20.Coresh J, Turin TC, Matsushita K, Sang Y, Ballew SH, Appel LJ, et al. Decline in Estimated Glomerular Filtration Rate and Subsequent Risk of End-Stage Renal Disease and Mortality. JAMA. 2014 doi: 10.1001/jama.2014.6634. [DOI] [PMC free article] [PubMed] [Google Scholar]
- 21.Stevens LA, Manzi J, Levey AS, Chen J, Deysher AE, Greene T, et al. Impact of creatinine calibration on performance of GFR estimating equations in a pooled individual patient database. Am J Kidney Dis. 2007;50:21–35. doi: 10.1053/j.ajkd.2007.04.004. [DOI] [PubMed] [Google Scholar]
- 22.Myers GL, Miller WG, Coresh J, Fleming J, Greenberg N, Greene T, et al. Recommendations for improving serum creatinine measurement: a report from the Laboratory Working Group of the National Kidney Disease Education Program. Clin Chem. 2006;52:5–18. doi: 10.1373/clinchem.2005.0525144. [DOI] [PubMed] [Google Scholar]
- 23.Killeen AA, Ashwood ER, Ventura CB, Styer P. Recent trends in performance and current state of creatinine assays. Arch Pathol Lab Med. 2013;137:496–502. doi: 10.5858/arpa.2012-0134-CP. [DOI] [PubMed] [Google Scholar]
- 24.Astor BC, Arnett DK, Brown A, Coresh J. Am J Kidney Dis. Vol. 43. National Kidney Foundation, Inc; 2004. Association of kidney function and hemoglobin with left ventricular morphology among African Americans: the Atherosclerosis Risk in Communities (ARIC) study; pp. 836–45. [DOI] [PubMed] [Google Scholar]
- 25.Maynard JW, McAdams-DeMarco Ma, Law A, Kao L, Gelber AC, Coresh J, et al. Racial differences in gout incidence in a population-based cohort: Atherosclerosis Risk in Communities Study. Am J Epidemiol. 2014;179:576–83. doi: 10.1093/aje/kwt299. [DOI] [PMC free article] [PubMed] [Google Scholar]
Associated Data
This section collects any data citations, data availability statements, or supplementary materials included in this article.


