

Abstract
This study evaluated the conventional imaging performance of a research whole-body photon-counting CT system and investigated its feasibility for imaging using clinically realistic levels of x-ray photon flux. This research system was built on the platform of a 2nd generation dual-source CT system: one source coupled to an energy integrating detector (EID) and the other coupled to a photon-counting detector (PCD). Phantom studies were conducted to measure CT number accuracy and uniformity for water, CT number energy dependency for high-Z materials, spatial resolution, noise, and contrast-to-noise ratio. The results from the EID and PCD subsystems were compared. The impact of high photon flux, such as pulse pile-up, was assessed by studying the noise-to-tube-current relationship using a neonate water phantom and high x-ray photon flux. Finally, clinical feasibility of the PCD subsystem was investigated using anthropomorphic phantoms, a cadaveric head, and a whole-body cadaver, which were scanned at dose levels equivalent to or higher than those used clinically. Phantom measurements demonstrated that the PCD subsystem provided comparable image quality to the EID subsystem, except that the PCD subsystem provided slightly better longitudinal spatial resolution and about 25% improvement in contrast-to-noise ratio for iodine. The impact of high photon flux was found to be negligible for the PCD subsystem: only subtle high-flux effects were noticed for tube currents higher than 300 mA in images of the neonate water phantom. Results of the anthropomorphic phantom and cadaver scans demonstrated comparable image quality between the EID and PCD subsystems. There were no noticeable ring, streaking, or cupping/capping artifacts in the PCD images. In addition, the PCD subsystem provided spectral information. Our experiments demonstrated that the research whole-body photon-counting CT system is capable of providing clinical image quality at clinically realistic levels of x-ray photon flux.
Keywords: spectral CT, photon counting, performance evaluation, high photon flux
1. Introduction
Spectral computed tomography (CT) was proposed soon after the first commercial medical CT scanner (Hounsfield 1973, Alvarez and Macovski 1976). Compared with conventional CT, this technique exploits the energy dependence of x-ray attenuation for different materials and provides energy-selective information that may be beneficial for clinical practice (McCollough et al 2015). Over the past 40 years, different realizations of spectral CT have been proposed and commercialized, including fast kV-switching (Hsieh 2009), dual-layer detector (Altman and Carmi 2009), and dual-source (Flohr et al 2006) dual-energy methods. However, these techniques only use two energy ranges, and each is limited in certain aspects (Johnson 2012), such as poor energy separation or data discrepancy due to patient motion.
Another approach to spectral CT is to use a photon-counting detector (PCD) that is capable of resolving energy information for an incident x-ray photon. Compared to an energy-integrating detector (EID), a PCD is able to exclude most of the electronic noise and provide count-weighted projection data, which results in reduced noise and improved contrast-to-noise ratio (CNR), thus improved dose efficiency (Tümer et al 2000, Schlomka et al 2008, Shikhaliev 2008a, 2008b, Shikhaliev et al 2009, Iwanczyk et al 2009, Kappler et al 2010, Shikhaliev and Fritz 2011, Shikhaliev 2012, Silkwood et al 2013, Taguchi and Iwanczyk 2013, Bennett et al 2014, Persson et al 2014, Shikhaliev 2015). This technique has been widely used in single-photon emission computed tomography and positron emission tomography, but is currently not available in commercial CT systems, mainly because the x-ray flux used in clinical practice is much higher. With recent advancements in detector technology, especially the development of fast application specific integrated circuits (ASICs), the counting rate of a PCD is approaching the level needed to measure clinical x-ray flux (Taguchi and Iwanczyk 2013). Over the past decade, much research has been performed toward the development of a photon-counting CT (PCCT) scanner. To date, various PCCT prototypes have been developed or are under development. Some silicon-strip-based PCDs (Xu et al 2012, Xu et al 2013a, 2013b) allow high photon flux, but most CdTe- and CZT-based PCDs are based on low tube current (mA) x-ray flux (Schlomka et al 2008, Shikhaliev 2008b, Iwanczyk et al 2009, Bennett et al 2014).
Recently, a whole-body, high count-rate PCCT research system was installed in our laboratory (Kappler et al 2014, Yu et al 2015). This system was developed using a dual-source CT system platform (SOMATOM Definition Flash, Siemens Healthcare, Forchheim, Germany), with one x-ray source coupled to an EID and the other to a PCD. To date, studies performed using this system have been reported only at conferences (Kappler et al 2010, Kappler et al 2012, Kappler et al 2013, 2014, Yu et al 2015). In this work, we provide a more thorough evaluation of the conventional imaging performance of the research PCCT system. First, we used quality control phantoms for system characterization, including CT number accuracy, energy dependency, and uniformity, spatial resolution, noise, and CNR. The results were compared between the EID and PCD subsystems. We further assessed the impact of high photon flux by studying the noise-to-tube-current relationship using a neonate water phantom (lateral width 77 mm) and high x-ray flux (up to 550 mA at 140 kV with 1 second rotation). Finally, we used anthropomorphic phantoms and human cadavers to investigate the clinical feasibility of the research PCCT system. In addition to the conventional imaging performance, the spectral imaging performance of the research PCCT system is of particular interest to us. Such studies are currently work in progress and will be reported in the near feature.
2. Materials and methods
2.1. Research PCCT system
The research PCCT system has two x-ray tubes that are about 90° apart from each other, with one coupled to an EID and the other to a PCD. We call the former the EID subsystem and the latter the PCD subsystem (figure 1(A)). The EID subsystem is equivalent to the A system of a commercial 2nd generation dual-source CT scanner (SOMATOM Definition FLASH, Siemens Healthcare). The fields-of-view (FOV) of the EID and PCD subsystems at the iso-center are 500 mm and 275 mm in diameter, respectively. The limited PCD FOV is sufficient for investigation of key properties of the PCD subsystem; it is not a fundamental limitation for a PCD CT in general. The dual-source-dual-detector setup provides a convenient platform for system comparison between EID-CT and PCD-CT. Note that though the research PCCT system is built on the platform of the 2nd generation dual-source CT scanner, substantial modifications have been applied. For example, the EID and PCD subsystems are not simultaneously energized, thus cross-scatter does not exist between the two subsystems. Another important feature of the PCD subsystem is that it allows for up to 550 mA tube current at 140 kV, which produces a very high photon flux that is sufficient for most whole-body scans.
Figure 1.
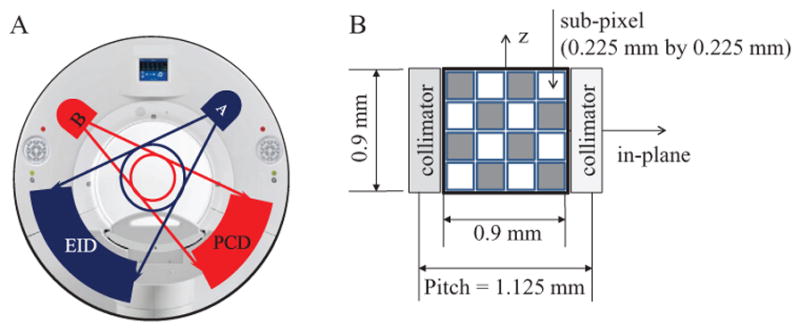
(A): Illustration of the research PCCT system. (B): Diagram of a macro pixel of the PCD.
The x-ray tubes used on the EID and PCD subsystems are equivalent (Straton, Siemens Healthcare, (Schardt et al 2004)). Both subsystems offer two scan protocols: (1) a head protocol using a carbon bowtie filter, and (2) an abdominal protocol using both the carbon bowtie filter and an aluminum bowtie filter. The shape of the bowtie filters is fixed and covers the entire scanning FOV. For the same scan protocol, the EID and PCD subsystems used equivalent and flat bowtie filters.
To measure x-ray beam quality, we measured the half-value-layer (HVL) for both the head and body scan protocols on both the EID and PCD subsystems using a method that is similar to the ring technique described in (Kruger et al 2000). For each scan protocol, the EID and PCD subsystems used the almost identical scan techniques, i.e. 140 kV, 300 mA, and 1 s rotation, except that the axial beam widths at the iso-center were slightly different, 14.4 mm for the EID subsystem and 16 mm for the PCD subsystem, which was the best match between the two subsystems. For the head scan protocol, the HVL values were 11.3 mm and 11.2 mm for the EID and PCD subsystems, respectively. For the body scan protocol, the HVL values were 11.3 mm and 11.2 mm for the EID and PCD subsystems, respectively. These HVL values are almost identical.
The EID sensor material is Gd2O2S (Stellar, Siemens Healthcare). It is composed of 64 detector rows, each containing 736 pixels, and corresponds to a slice thickness of 0.6 mm at the iso-center. More details of the EID can be found in (Siemens 2012, Ulzheimer and Freund 2012).
The PCD is CdTe based (Kappler et al 2010, 2012, 2013, 2014). The CdTe sensors are 1.6 mm thick, and are connected to a front-end chip using a flip-chip bump bonding process. The front-end chip is an ASIC with photon-counting sub-pixels of size 0.225 mm by 0.225 mm. The bias voltage between the cathode and the anode sub-pixels is 1 kV. Each sub-pixel contains two photon-counting circuits and allows two different energy thresholds: one is restricted to between 20 keV and 50 keV, and the other restricted to between 50 keV and 90 keV, which are referred to as threshold low and threshold high, respectively. In the current configuration, 4-by-4 sub-pixels are grouped into a 2D square array. Such a 2D array is called a macro pixel, and it is of size 0.9 mm by 0.9 mm, which corresponds to 0.5 mm by 0.5 mm at the iso-center; see figure 1(B). Though sub-pixels are the smallest counting unit, macro pixels are currently the smallest readout unit. Hence, the spatial resolution of the PCD subsystem is currently limited by the size of the macro pixel. Note that, the binning process of the macro pixel is performed after analog signal processing of the front-end chip, and it does not compensate for K-escape or charge sharing effects occurring between sub-pixels. The binning process of the macro pixel is not related to the previously described charge summing approach (Koenig et al 2014).
The PCD is composed of 32 detector rows, each containing 480 macro pixels. The PCD is collimated along the longitudinal direction for in-plane scatter suppression: adjacent macro pixels in the transverse direction are separated by an anti-scatter collimator, yielding a macro pixel pitch of 1.125 mm. The material, thickness and linear sizes of the collimator are identical to the EID detector installed on the second generation dual-source CT system (SOMATOM Definition Flash, Siemens Healthcare).
As each sub-pixel allows two energy thresholds, the ASIC records the number of photons that are of energy greater than each threshold and generates two sets of projection data, which, for convenience, are referred to as threshold data. We also refer to the projection data corresponding to the photons that are of energies between two energy thresholds as bin data, which are obtained by subtraction of two threshold data sets.
Depending on the threshold configuration of the sub-pixels in each macro pixel, the research PCCT system provides two data acquisition modes, namely the macro mode and the chess mode. In the macro mode, all 16 sub-pixels in each macro pixel are set to the same thresholds. Let these two thresholds be EL and EH, and let EM be the maximum energy of the x-ray spectrum. In the macro mode, the scanner generates four sets of projection data: (1) threshold low data between EL and EM, (2) threshold high data between EH and EM, (3) bin 1 data between EL and EH, and (4) bin 2 data between EH and EM (figure 2(A)). In the chess mode, the 16 sub-pixels in each macro pixel are interlaced, as shown in figure 1(B). The thresholds of the 8 black sub-pixels are set to EL1 and EH1, whereas those of the 8 white sub-pixels are set to EL2 and EH2, with 0 < EL1 < EL2 < EH1 < EH2 < EM. In the chess mode, the scanner generates 8 sets of projection data, including 4 sets of threshold data and 4 sets of bin data (figure 2(B)). Note that, in both modes, the last bin data set and the last threshold data set are equivalent, i.e. the macro mode generates three unique data sets, whereas the chess mode generates seven unique data sets. For example, in the macro mode, data associated with threshold high are equivalent to those with bin 2. Also note that dose efficiency of the chess mode is not as good as that of the macro mode, as each 8-sub-pixel grouping of detector pixels only uses half of the x-ray photons incident on a macro pixel. The chess mode does allow, however, investigation of the potential for multi-energy (i.e. >2 energies) material decomposition algorithms. There is no fundamental limit of PCD technology that requires this chess pattern mode. Rather, it offers a convenient method of obtaining 4 threshold data sets using ASICS that offer only 2 energy thresholds.
Figure 2.
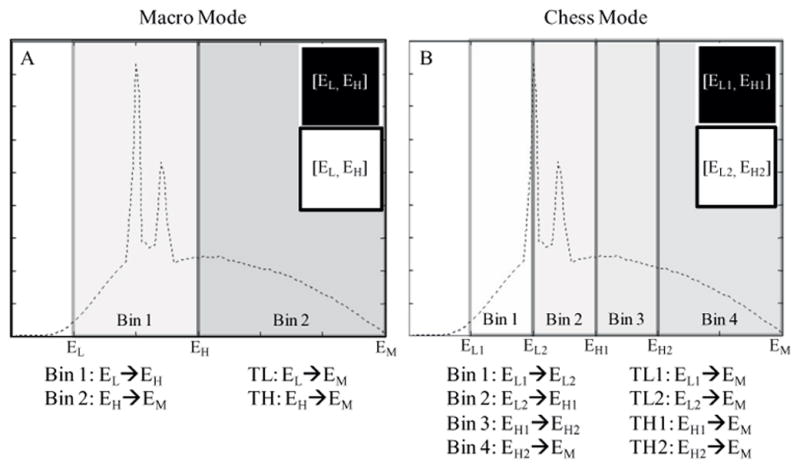
Illustration of the macro mode (A) and the chess mode (B). The dashed curves represent typical CT x-ray spectra. TL and TH stand for ‘threshold low’ and ‘threshold high’, respectively.
Ideally, the data in separate energy bins (whether in the macro or chess mode) do not overlap. In practice, various physical effects cause non-ideal detector responses and overlap occurs (Taguchi and Iwanczyk 2013). These effects include pulse pile-up (Roessl et al 2011, Wang et al 2011, Kappler et al 2014), charge sharing (Kuvvetli and Budtz-Jørgensen 2007, Kim et al 2011, Xu et al 2011), K-escape (Pellegrini et al 2004, Kuvvetli and Budtz-Jørgensen 2007, Shikhaliev et al 2009), Compton scattering, and charge trapping. As a result of all of these physical effects, an energy bin created on the measured pulse spectrum corresponds to an incident x-ray spectrum that extends beyond the bin boundaries, which degrades the energy resolution of the PCD subsystem.
Currently, the PCD subsystem uses an analytical image reconstruction algorithm, which is based on the weighted-filtered-back-projection (WFBP) algorithm (Stierstorfer et al 2004). The WFBP algorithm first rebins cone-beam projections into pseudo-parallel multi-slice sinograms, which are further filtered with a reconstruction kernel. Finally, the filtered sinograms are back projected, and images are reconstructed. Note that the reconstruction kernel is a ramp filter apodized by a customized window. The reconstruction kernels on the PCD subsystem are designed such that images obtained from the EID and PCD subsystems have the same inplane spatial resolution, provided that the same kernel name is used and the projection data are acquired with the same scan configurations for both subsystems. The reconstruction kernels are not tailored for different energy thresholds or bins.
When part of the imaged object lies outside the PCD FOV, PCD projection data are truncated, which would cause truncation artifacts to appear. To suppress the data truncation artifacts, a low-dose data-completion scan (DCS) is acquired using the EID subsystem in a separate acquisition. The DCS is used to estimate unknown PCD projection data outside the 275 mm FOV. Such estimated information is only needed in the ramp filtering step of the WFBP reconstruction algorithm. A rough estimation is sufficient to suppress the truncation artifacts. A DCS is not needed for the head protocol, but is required for the abdominal protocol because part of the patient table is outside the PCD FOV. Note that with the DCS, the research PCCT system is capable of whole-body imaging, even though the FOV of the PCD subsystem is limited.
2.2. System characterization
CT number, spatial resolution, noise, and CNR were assessed using the same quality control phantoms for both the EID and PCD subsystems. Projection data used for these assessments were acquired by spiral scans with a pitch of 0.5 and a rotation time of 0.5 s. The collimations used in the EID and PCD scans were 32 × 0.6 mm and 32 × 0.5 mm, respectively. In addition, for all PCD scans using the abdominal protocol, DCSs were performed for truncation correction.
2.2.1. CT number accuracy, energy dependence, and uniformity
For measurement of CT number, three phantoms were used: a cylindrical water phantom of 200 mm diameter, the ACR CT accreditation phantom (model 464, Gammex-RMI, Middleton, WI), and an iodine vial (32 mgI ml−1) placed at the center of a torso-shaped water phantom (with lateral width of 200 mm and anterior-posterior height of 149 mm). The three phantoms were scanned at effective 210 mAs and 140 kV. The PCD scans were performed in both the macro and chess modes using thresholds [25, 65] keV and [25, 50, 65, 84] keV, respectively. The cylindrical water phantom was scanned using both the head and abdominal protocols, whereas the other two phantoms were scanned only using the abdominal protocol. All reconstructions were performed using a medium smooth kernel (D30), 1 mm slice thickness and 1 mm slice increment.
Cylindrical volumes-of-interest (VOIs) of diameter 19 mm and longitudinal length 21 mm were drawn for CT number measurements. These VOIs were placed such that their longitudinal axes were parallel to the patient table. The VOIs used for CT number measurements of water, bone, and iodine were placed at the center of the cylindrical water phantom, the center of the bone-mimicking material of the ACR phantom, and the center of the iodine vial within the torso shaped water tank, respectively.
For CT number accuracy, the mean CT number within the central VOI of the 200 mm water phantom was measured for each threshold/bin image, which was compared to the standard quality-control criterion (Cody et al 2012): a CT number of water between −5 HU and 5 HU was considered to be clinically satisfactory. For energy dependence, CT numbers of the iodine and bone-mimicking material were studied in different threshold/bin images, and their relative changes with energy were compared.
For measurement of CT number uniformity, the method proposed by the American College of Radiology (McCollough et al 2004) was adopted, except that the previously mentioned 200 mm water phantom was used in place of module 3 of the ACR phantom. Five VOIs, the same as mentioned in the previous two paragraphs, were drawn, with one at the center, and the other four at 3, 6, 9, and 12 o’clock locations (figure 3). For each scan, the difference in CT number between the central VOI and the peripheral VOIs was calculated, which was then compared to the standard quality-control criterion (Cody et al 2012): differences between −5 HU and 5 HU were considered to be clinically satisfactory.
Figure 3.
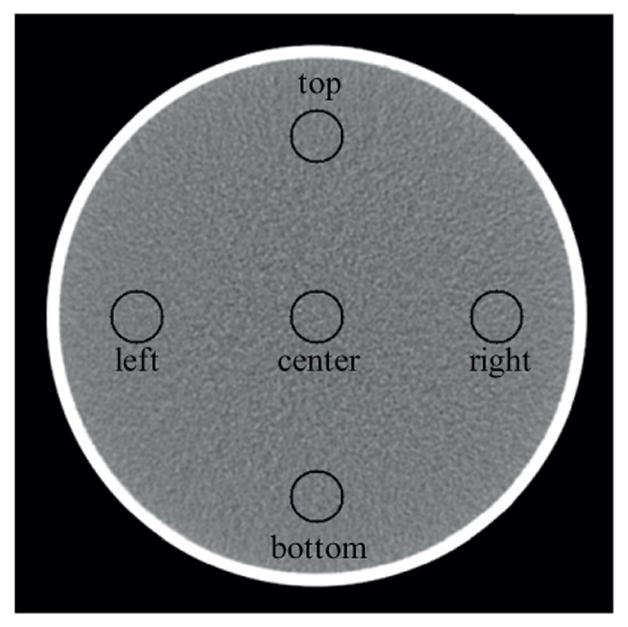
Illustration of VOIs used for uniformity measurement.
2.2.2. Spatial resolution
The in-plane and longitudinal spatial resolution were measured in terms of the modulation transfer function (MTF) and the slice sensitivity profile (SSP), respectively. The PCD scans used for these measurements were performed in the macro mode using thresholds [25, 65] keV. Both head and abdominal protocols were used for MTF and SSP measurements.
For MTF measurement, a 0.125 mm diameter tantalum wire inside an empty vial (filled with air), which was placed parallel to the long axis of the patient table and 11 mm below the iso-center, was scanned using 40 mAs and 140 kV. Images within the smallest FOV available on the scanner, i.e. 50 mm by 50 mm, were reconstructed using a medium smooth kernel (D30), 1 mm slice thickness, and 1 mm slice increment. In each image, the pixel with the maximum CT number was identified, and the background was subtracted. A 2D point spread function (PSF) centered at this pixel was then generated, which was radially averaged to generate a 1D line profile. Finally, the line profile was Fourier transformed and normalized to its DC component to generate the MTF curve.
The SSPs were measured using the same method as presented in section II.C of (Flohr et al 2005). A 0.05 mm thick gold foil embedded in a Lucite cylinder (ORM, GmbH, Moehrendorf, Germany), which was placed perpendicular to the long axis of the patient table and 23 mm above the iso-center, was scanned using 70 mAs, 140 kV, and spiral pitch of 0.5. Images were reconstructed using the smallest possible FOV (50 mm by 50 mm), the smallest slice increment (0.1 mm), and the thinnest possible slice thickness, which was 0.6 mm for the EID subsystem and 0.5 mm for the PCD subsystem. For the images from each scan, the profile along the line that was parallel to the long axis of the patient table and went through the center of the gold foil was calculated. The obtained line spread function was then normalized to its peak value, and served as the SSP. The full width at half maximum (FWHM) of the SSP was calculated as an indicator of longitudinal resolution. SSPs were calculated for both the head and abdominal protocols, and the results were compared between the EID and PCD subsystems.
2.2.3. Noise
For noise measurement, all experiments were performed twice and the difference images between the two experiments, which were further normalized by , were used for noise calculation. The difference was taken to exclude structured noise, whereas the normalization of was to adjust the noise level to that of a single image. First, noise (standard deviation) was calculated using central cuboid VOIs of size 80 mm by 80 mm by 60 mm. The noise measurements of the PCD images were normalized such that they corresponded to the same spatial resolution as the EID images, as detailed in the following paragraph. Finally, for both head and abdominal protocols, the noise values obtained from the EID subsystem, the threshold low data of the macro mode, and the threshold low 1 data of the chess mode were compared.
The above mentioned noise normalization for the PCD images was achieved as follows. As was mentioned in section 2.1 and will be confirmed in section 3.1, the in-plane resolution was inherently matched between the EID and PCD subsystems when the same reconstruction kernel was used. Therefore, with the same reconstruction kernel, noise was already normalized in terms of in-plane resolution, thus only the longitudinal resolution needed to be matched. To achieve this goal, it was assumed that the noise was proportional to the inverse square root of the slice thickness. Let σ and σ̄ be the measured noise and normalized noise, respectively. Based upon the assumption, each PCD noise measurement can be normalized using equation (1), such that the number of photons involved in the noise calculation is equivalent between the EID and PCD subsystems.
| (1) |
where HPCD and HEID are the SSP FWHM values of the PCD and EID subsystems respectively. Note that both the noise and SSP were measured using images of the same slice thickness.
Next, noise power spectra (NPS) were calculated using the method presented in (Siewerdsen et al 2002). For each scan, 60 difference images from the same reconstruction were obtained, and a radially averaged 1D power spectrum was calculated for each difference image using a central square region of size 80 mm by 80 mm. These 60 power spectra were further averaged, and the result used as the final power spectrum of the scan. Note that the noise in the 60 PCD difference images were normalized using equation (1).
2.2.4. Contrast-to-noise ratio (CNR)
CNR was measured for the iodine test object (32 mgI ml−1) described in section 2.2.1, which was scanned using the body scan protocol on both the EID and PCD subsystems. According to section 2.1, beam quality involved for the CNR measurement was almost identical between the EID and PCD scans. For CNR measurements, VOIs of diameter 12 mm and length 21 mm were drawn in both the background (water) and foreground (iodine), and mean CT number and noise (standard deviation) were measured therein. The noise was normalized according to equation (1). Let σb (σf) be the normalized noise of the background (foreground), and let μb (μf) be the mean CT number of the background (foreground). The CNR was calculated using equation (2). CNRs for reconstruction results obtained from the EID subsystem, the macro mode threshold low, and the chess mode threshold low 1 were calculated and compared.
| (2) |
2.3. Impact of high photon flux
To assess the impact of high photon flux, the relationship between CT numbers and tube current, as well as image noise and tube current, were studied. Ideally, when tube current increases, CT numbers should remain the same and image noise (standard deviation of CT numbers in a VOI) should be roughly inversely proportional to the square root of the tube current. At high photon flux, physical effects such as pulse pile-up can cause substantial deviations from these expected results. Therefore, the changes of CT numbers, noise, and noise ratios were used as indicators of the impact of high photon flux.
The experiments for assessment of the impact of high photon flux were designed as follows. A torso-shaped neonate water phantom of lateral width 77 mm and anterior-posterior height 57 mm, which was the smallest water phantom in our lab, was scanned on both the EID and PCD subsystems using a rotation time of 1 s, tube voltage of 140 kV and tube current from 20 mA to 548 mA at intervals of 12 mA, with the other scan and reconstruction parameters fixed (table 1). The water phantom was placed 30 mm above the iso-center with its axis parallel to the long axis of the patient table. These scan parameters were selected to maximize the photon flux received by the PCD at each tube current. The PCD scans were performed in the macro mode with thresholds [25, 65] keV. At each mA setting, the scan was repeated so that two sets of images were reconstructed. These images were subtracted to form a set of difference images. Cylindrical VOIs with diameter 15.6 mm and length 10 mm were drawn for CT number and noise measurements. In addition, the ratio of the noise in bin 1 (25 → 65 keV) to the noise in bin 2 (65 → 140 keV) was also calculated. The impact of increases in tube current on CT number, noise, and noise ratios was then assessed for both the EID and PCD subsystems. In particular, the noise versus mA curve was fitted by an inverse square root function expressed as
Table 1.
Data acquisition and image reconstruction configurations used for assessment of the impact of high photon flux.
| Detector collimation | Rotation time | Scan protocol | Recon kernel. | Slice thickness | Slice increment | |
|---|---|---|---|---|---|---|
| EID | 32 × 1.2 mm | 1 s | Head sequential | D30 | 2.0 mm | 2.0 mm |
| PCD | 32 × 0.5 mm | 1 s | Head sequential | D30 | 2.0 mm | 2.0 mm |
| (3) |
The constant c in equation (3) was obtained by a regression process using data corresponding to the range of [100, 200] mA, in which it was assumed that the high-flux impact was negligible and the photon statistics sufficient.
2.4. Clinical feasibility
For investigation of clinical feasibility, we first scanned two anthropomorphic thorax phantoms: one representative of a 15 year old (model 007TE-15, CIRS, Norfolk, Virginia) and the other representative of a large adult (model 007TE-18, CIRS). The smaller and larger phantoms were 18.4 cm and 31.0 cm thick in the anterior-posterior direction and 23.9 cm and 38.9 cm wide in the lateral direction, respectively. Note that the 15-year-old phantom was able to fit fully within the PCD FOV, whereas the large-adult phantom was not. Both phantoms required use of DCS scans to avoid transverse data truncation artifacts; DCS scans were needed for the scans of the 15-year-old phantom due to data truncation of the patient table. Two vials containing bone-mimicking material (200 mgCa ml−1) and iodine (20 mgI ml−1) were inserted into each phantom. The phantoms were scanned using the abdominal spiral protocol with the same voltage (140 kV), rotation time (1 s) and pitch (0.5), as well as the closest collimation settings, i.e. 32 × 0.6 mm for the EID subsystem and 32 × 0.5 mm for the PCD subsystem. The PCD scans were performed using the macro mode at thresholds [25, 65] keV. The tube current was adjusted such that the CTDIvol matched our clinical protocol for the corresponding patient size. In particular, we used 46 mAs (CTDIvol 5.10 mGy) for the 15-year-old CIRS phantom, and 194 mAs (CTDIvol 21.49 mGy) for the large-adult CIRS phantom. Images of both phantoms were reconstructed using a 2 mm slice thickness and a medium smooth kernel (D30). VOIs of diameter 15 mm and length 10 mm were drawn in the bone, iodine, and soft tissue (background) areas. Noise and CT numbers were measured in these VOIs, and CNRs were calculated for both the EID and PCD images. The noise in the PCD images were normalized to that of the EID images using equation (1).
With bio-specimen committee approval, we also scanned a cadaveric head and a wholebody cadaver, both of which were fresh-frozen. Both cadavers were scanned on the PCD subsystem using data acquisition and image reconstruction parameters listed in table 2. These scanning techniques and dose levels (in terms of CTDIvol) were similar to those used in clinical CT exams.
Table 2.
Data acquisition and image reconstruction configurations used for the cadaver scans.
| Body part | mAs | kV | Detector collimation | CTDIvol (32 cm) | Pitch | Scan protocol | Recon.kernel | Slice thickness |
|---|---|---|---|---|---|---|---|---|
| Head | 220 | 140 | 32 × 0.5 mm | 24.4 mGy | 0.6 | Head | D40 | 1.0 mm |
| 550 | 60.9 mGy | |||||||
| Thorax | 180 | 19.9 mGy | Spiral | D30 |
The cadaveric head was scanned in both the macro and chess modes with thresholds [20, 63] keV and [20, 50, 63, 83] keV, respectively. Two tube current values were used: 220 mAs for routine dose and 550 mAs for maximum dose. Images were reconstructed using 1 mm slice thickness using a medium sharp kernel (D40). The second order bone beam hardening correction that is typically applied clinically in head images was not applied for the EID images as it was not available for the PCD images. This also allowed assessment of the beam hardening qualities of the data prior to corrections. The shoulder of the whole-body cadaver was scanned at 180 mAs and 140 kV in the macro mode with thresholds [25, 65] keV, and was reconstructed using a medium smooth kernel (D30) with 1.0 mm slice thickness and 1.0 mm slice increment. The head spiral protocol was chosen for the PCD scans of the shoulder because it was the only protocol available at the time of data acquisition.
3. Results
3.1. System characterization
The CT number accuracy of water was clinically acceptable for all scan protocols and data acquisition modes of the PCD subsystem (Cody et al 2012): the CT numbers in the central VOI were within the range [−5, 5] HU (figure 4(A)). The CT numbers of bone and iodine were consistent with expectations (figure 4(B)). The CT numbers in the PCD threshold low images ([25, 140] keV) were greater than those in the EID images. Furthermore, the PCD images in different energy ranges presented different CT numbers for both bone and iodine. For example, from chess mode bin 1 to chess mode bin 4, the CT numbers of both bone and iodine decreased, which is evidence that the PCD subsystem provided energy-selective information. The CT number uniformity was also clinically acceptable for all scan protocols and data acquisition modes of the PCD subsystem (Cody et al 2012): the difference in CT number of water between the central VOI and each peripheral VOI was within the range [−5, 5] HU (figure 5).
Figure 4.

(A): CT number accuracy of water from both the head and abdominal protocols. The CT numbers of water met regulatory requirements in all configurations. (B): CT numbers of bone and iodine from the abdominal protocol. The CT numbers of iodine and bone depended on the energy threshold or bin.
Figure 5.
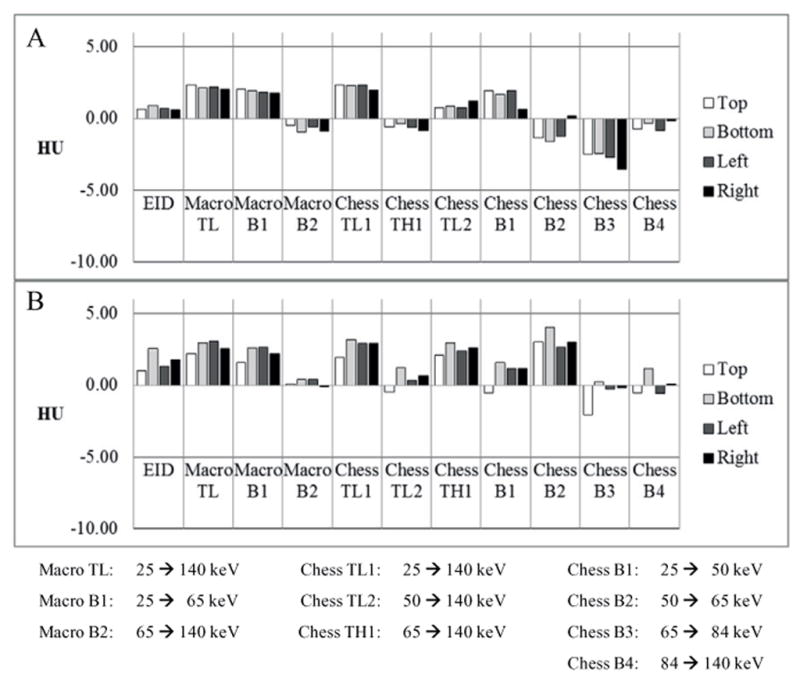
CT number uniformity measured using both the head protocol (A) and the abdominal protocol (B). All data met regulatory requirements.
In the macro mode, the PCD subsystem had almost identical MTF and SSP curves for all threshold and bin images when the same medium smooth kernel (D30) was used. The EID and PCD subsystems had identical MTF curves (figure 6(A)) for both the head and abdominal protocols, which is consistent with the fact that the vendor purposely matched the inplane resolution between the two systems for the same reconstruction kernel. With the same reconstruction kernel, the best achievable SSP was better on the PCD subsystem than on the EID subsystem: the FWHMs of the SSPs for the head protocol were 0.850 mm (nominal slice thickness 0.6 mm) and 0.625 mm (nominal slice thickness 0.5 mm) for the EID and PCD subsystems, respectively; see figure 6(B). The same results were observed for the abdominal protocol. In addition, the FWHMs of the SSPs were measured also for nominal slice thickness of 1 mm and 2 mm; see figures 6(C) and (D). There the ratios of the FWHMs of the EID subsystem to those of the PCD subsystem were 1.21 and 1.03, respectively. These ratios were used for noise normalization.
Figure 6.

Measurements of the spatial resolution of the research PCCT system using the macro mode with pitch 0.5 and reconstruction kernel D30. (A): In-plane spatial resolution. (B): Longitudinal spatial resolution corresponding to the smallest slice thicknesses, i.e. 0.6 mm for the EID subsystem and 0.5 mm for the PCD subsystem. (C): Longitudinal spatial resolution corresponding to slice thickness of 1 mm. (D): Longitudinal spatial resolution corresponding to slice thickness of 2 mm. MTF: modulation transfer function. SSP: slice sensitivity profile.
Normalized noise measurements of the 200 mm cylindrical water phantom are listed in table 3. Normalized noise in the PCD images was slightly (about 3%) smaller than in the EID macro mode threshold low images. Noise in PCD chess mode threshold low 1 images was substantially higher than that in the EID images. These results are further verified by the NPS results: for both the head and abdominal protocols, the NPS curves for the EID subsystem were very similar to those for the macro mode threshold low data of the PCD subsystem, but were well below those for the chess mode threshold low 1 data of the PCD subsystem; see the NPS results in figure 7 as an example. The NPS curves of the EID and PCD subsystems had similar shapes and all stopped at a frequency around 0.8 lp mm−1, which is consistent with the MTF results in figure 6(A).
Table 3.
Comparison of normalized noise with matched spatial resolution.
| Normalized noise (HU) | Head protocol | Abdominal protocol |
|---|---|---|
| EID | 7.44 | 8.39 |
| Macro 25 → 140 keV | 7.20 | 8.09 |
| Chess 25 → 140 keV | 9.28 | 10.48 |
Figure 7.

In-plane noise power spectra.
The contrast, normalized noise, and CNR of the iodine vial for the EID scan, the PCD macro mode threshold low scan, and the PCD chess mode threshold low 1 scan are listed in table 4. The iodine CT numbers in macro mode threshold low images and chess mode threshold low 1 images were almost identical, but were larger than those in the EID images, which is consistent with the results presented in figure 4. The noise measurements in the EID images were slightly higher than those (normalized) in the macro mode threshold low images, but clearly lower than those in the chess mode threshold low 1 images, which is consistent with the results presented in table 3. Consequently, the macro mode threshold low images had the best iodine CNR, which was about 25.5% higher than for the EID images, whereas the chess mode threshold low 1 images had 4.4% worse iodine CNR relative to the EID images due to increased noise.
Table 4.
Contrast-to-noise ratio (CNR).
| Macro | Chess | ||
|---|---|---|---|
| EID | 25 → 140 keV | 25 → 140 keV | |
| Contrast (HU) | 603.76 | 721.79 | 721.50 |
| Normalized noise (HU) | 11.36 | 10.82 | 14.19 |
| CNR | 53.15 | 66.68 | 50.84 |
3.2. Impact of high photon flux
For the EID subsystem, as expected, the CT numbers were almost constant when the tube current increased, whereas the noise was inversely proportional to the square root of tube current; see figure 8.
Figure 8.

Assessment of the impact of high photon flux for the EID subsystem. (A): Relationship between CT number of water and tube current. (B): Relationship between noise and tube current.
For the PCD images, when the tube current increased above 300 mA, we observed that (1) the CT numbers of water of both bin 1 and bin 2 images started to increase (figure 9(A)), and (2) the noise values of both bin 1 and bin 2 started to deviate, albeit only slightly, from the fitted curves, with the amount of deviation in bin 1 being larger than in bin 2 (figure 9(B)). The above phenomena were likely caused by high-flux effects like pulse pile-up. For example, when pulse pile-up occurs, two or more lower energy photons are detected as one higher-energy photon. Consequently, the total number of counts decreases and the imaged object appears to be more attenuating, resulting in increased CT numbers and noise. Pulse pile-up also shifts the spectrum from lower energy to higher energy. A direct consequence of such a spectrum shift is the increased noise ratio of bin 1 to bin 2 (figure 9(C)).
Figure 9.

Assessment of the impact of high photon flux for the macro mode of the PCD subsystem. (A): Relationship between CT number of water and tube current. (B): Relationship between noise and tube current. (C): Relationship between the ratio of the noise in bin 1 to that in bin 2 and tube current.
3.3. Clinical feasibility
Images of the 15-year-old phantom are shown in figure 10, and the CNR values of the bone-mimicking material and iodine vials are depicted therein. A wide display window was used for better comparison of the iodine contrast. Compared to the EID images, the PCD macro mode threshold low images presented higher CNR values in both the bone-mimicking vial (21.6% enhancement) and the iodine vial (26.1% enhancement). It was also observed that the PCD macro mode bin 1 images had the highest contrast in both vials. Consequently, though the PCD macro mode bin 1 images used only part of the x-ray photons and had higher quantum noise, the resultant CNRs in both vials were better than those in the EID images. Although the PCD macro bin 2 images presented worse CNRs than the other images, they were free of beam hardening artifacts. Reduction of beam hardening artifacts in bin 2 is better visualized using a narrower display window (figure 11). Using such a narrow display window, comparable image quality was observed between the EID images and the PCD threshold low images, except that the beam hardening artifacts in the latter were slightly more obvious due to the use of lower energy photons, where beam hardening is more substantial. Furthermore, no cupping artifacts were observed in the PCD images although the PCD projection data were transversely truncated, demonstrating that the DCS worked effectively.
Figure 10.
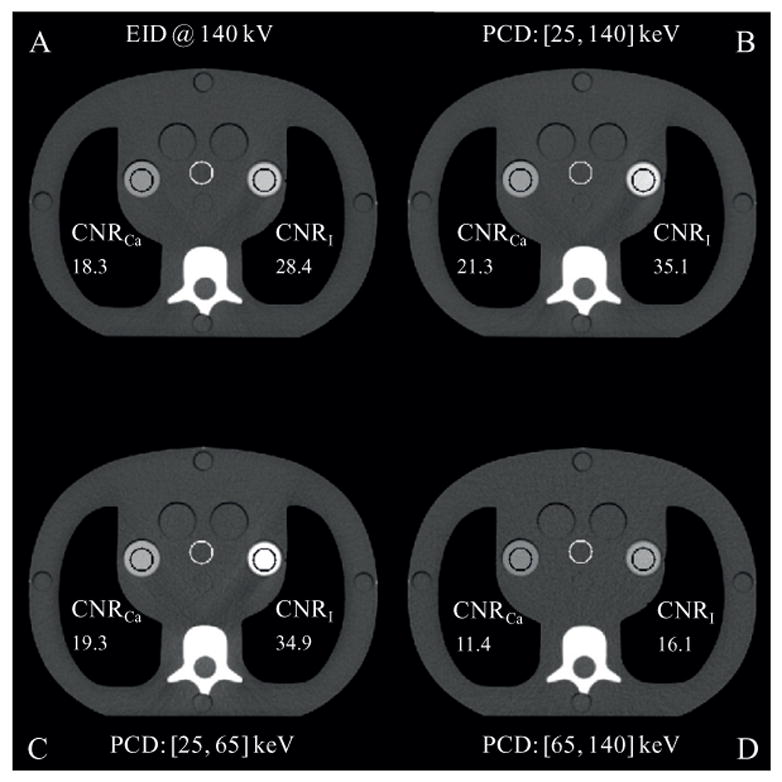
Reconstructions of the CIRS phantom (mimicking a 15 year old human being) with a bone-mimicking vial (left) and an iodine vial (right). Display window: W/L = 700/100 HU. Slice thickness: 2 mm.
Figure 11.
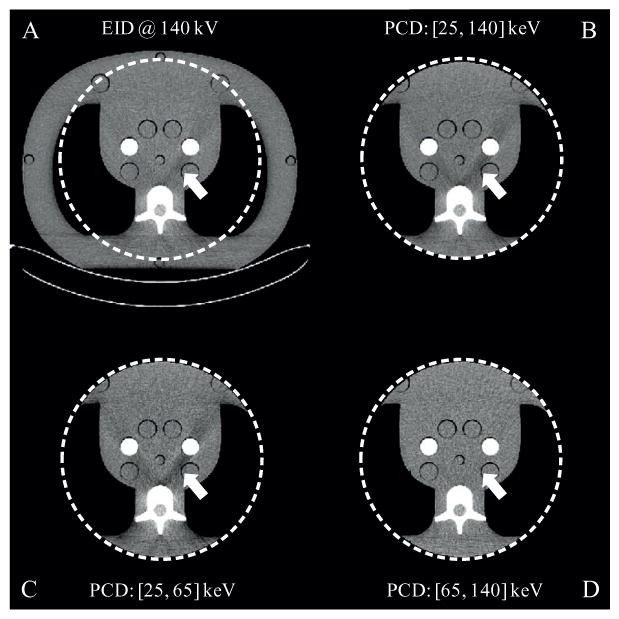
Reconstructions of the CIRS phantom (mimicking a large adult) with a bone-mimicking vial (left) and an iodine vial (right). Display window: W/L = 200/0 HU. Slice thickness: 2 mm.
Images of the cadaveric head and the shoulder of the whole-body cadaver were generated by the EID subsystem and the macro and chess modes of the PCD subsystems. Using routine radiation doses, neither ring artifacts nor streaking artifacts were observed in any of the reconstructed images (figures 12 and 13). Using high x-ray flux (up to 550 mAs at 140 kV), no cupping artifacts were observed in the cadaver head images (figure 12), which supports the statement that the impact of high photon flux was negligible. Furthermore, similar to the images of the large adult CIRS phantom, no cupping artifacts were observed in shoulder images of the whole-body cadaver whose projection data were truncated in the transverse direction, again demonstrating that the DCS worked effectively.
Figure 12.
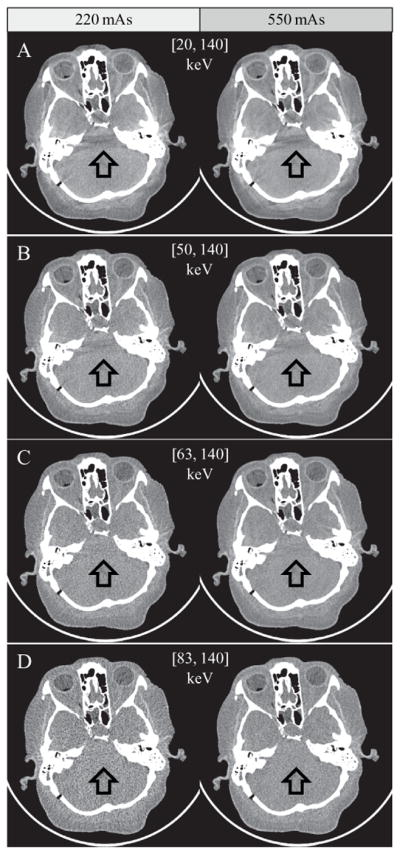
Images of the cadaver head from the PCD chess mode. Left: 220 mAs; right: 550 mAs. Rotation time: 1 s. Arrows demonstrate beam-hardening artifacts from adjacent dense bone, which are decreased in those images using predominantly higher energy photons. Display window: W/L = 300/− 20 HU.
Figure 13.
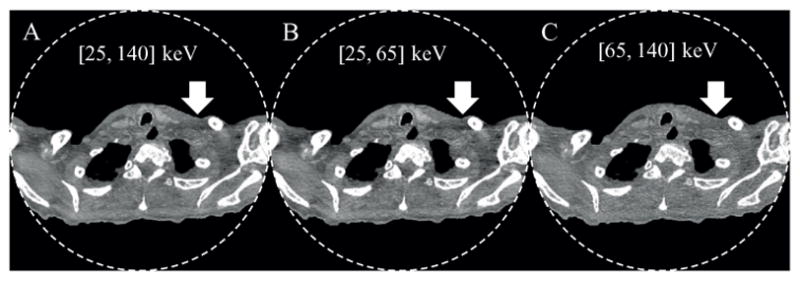
Images of the whole-body cadaver obtained from the PCD macro mode. From A to C: threshold low, bin 1, and bin 2. Arrows demonstrate beam-hardening artifacts from adjacent dense bone, which are decreased in the bin 2 (high energy) images. Display window: W/L = 300/− 20 HU.
The PCD subsystem generated energy selective images that may be beneficial for clinical practice. For example, substantial reduction of calcium blooming and beam hardening artifacts was achieved in high energy bin images, as demonstrated by the chess mode bin 4 images of the cadaveric head in figure 12(D) and the macro mode bin 2 image of the shoulder in figure 13(C). The price paid is increased noise, since high energy bin images only used a portion of the total detected photons.
Overall, both the CIRS phantom and the cadaver images showed excellent performance of the PCD subsystem: it is capable of robustly providing energy-resolved images of clinically acceptable quality using both routine doses as well as high doses (up to 550 mAs and 140 kV).
4. Discussion
The CT numbers of iodine in the full spectrum PCD images, i.e. threshold low images for the macro mode and threshold low 1 images for the chess mode, were larger than those in the EID images. This is because the projection data from a PCD subsystem are in terms of photon counts, whereas those from the EID subsystem are energy-weighted photon counts. Consequently, the full PCD x-ray spectrum is weighted more heavily toward the low energies than the EID x-ray spectrum, resulting in greater CT numbers for high-Z materials. This count-weighted spectrum feature of the PCD subsystem has the potential to reduce either radiation dose or contrast agent dose while maintaining the same CNR as the EID subsystem.
Compared to the EID images, the PCD macro mode threshold low images showed increased CNR, whereas the PCD chess mode threshold low 1 images presented decreased CNR. These results were expected. For the macro mode, the PCD has similar absorption efficiency and an almost identical effective pixel area as the EID. Consequently, the main cause of the increased CNR was the increased CT numbers of iodine. For the chess mode, as mentioned in section 2.1, the dose efficiency was reduced due to the detector configuration, which resulted in increased noise and reduced CNR. This chess mode detector configuration also brings complexity in CNR analysis for chess mode bin images: with a low energy bin, the contrast of high-Z materials are increased markedly, but the noise will also be increased due to the utilization of fewer x-ray photons, and is further amplified due to the decreased dose efficiency of the chess mode. An experimental assessment of this issue has been reported in (Schmidt et al 2015), although a theoretical approach for finding the optimal threshold configuration for best CNR performance is yet to be developed.
In the macro mode, identical spatial resolution was observed between the threshold-low, bin-1 and bin-2 images, indicating that the spatial resolution of the PCD subsystem was not energy dependent. This result is different from what is reported in (Koenig et al 2014). According to (Koenig et al 2014), when charge sharing and K-escape occur, a charge cloud dedicated to one pixel may be detected by neighboring pixels, which results in loss of spatial resolution. However, this was not the case for the PCD subsystem, because the smallest readout unit was one macro pixel, which consisted of 4-by-4 sub-pixels. Note that the size of a macro pixel is 900 μm by 900 μm, which is much larger than the 55 μm-by-55 μm pixel size used in (Koenig et al 2014). Although a charge cloud dedicated to one sub-pixel within a macro pixel may still be detected by neighboring sub-pixels, loss of spatial resolution would not occur as long as the measured charge cloud did not exceed the corresponding macro pixel size.
The PCD used a slightly smaller detector pixel size along the z axis (0.5 mm) than the EID (0.6 mm), which was reflected in the longitudinal spatial resolution. However, the in-plane resolution was matched between the EID and PCD subsystems, which was achieved by carefully designed but different reconstruction kernels, though the same kernel name was used. The current detector configuration uses the macro pixel as the smallest readout unit, but it is possible to read out from a sub-pixel or a group of sub-pixels. For example, the smallest readout unit can be configured as 2-by-2 sub-pixels, resulting in a readout pixel size of 0.45 mm by 0.45 mm. Indeed, such a PCD configuration was reported by the manufacturer (Kappler et al 2015), who showed images with improved spatial resolution. This special configuration is, however, work in progress and is not available on our system.
For the assessment of the impact of high photon flux, we observed that when the tube current increased above 300 mA, both the relationships between the tube current and the CT numbers of water, and between the tube current and the noise in the PCD images differed from those of the EID subsystem. For the latter relationship, the differences in bin 1 were more obvious than in bin 2. These results are strong evidence that the impact of high photon flux became perceptible for tube current larger than 300 mA. For example, when pulse pile-up occurs, multiple x-ray photons are counted as one, such that the detector records fewer photons than it should, causing an increase in both the CT number and quantum noise. Pulse pile-up is most likely a major cause of the increase of the CT numbers and noise, because other physical effects such as charge sharing and K-escape would have a totally opposite impact. Furthermore, the more noticeable noise deviation in bin 1 than in bin 2 is likely because the piled-up photons of the low energy bin contributed to the high energy bin. Other highflux effects such as baseline shift at the input of the readout circuit might also play a role. Regarding the negative fluctuation observed in CT number of water in bin 2 at low tube current, we believe it was caused by an imperfection in the water calibration. However, this is not a general limitation for a photon-counting technology.
Despite that the high-flux effects became perceptible when the tube current was larger than 300 mA, this effect was negligible because the results were obtained using a clinically unrealistic scenario: the experiment used the smallest (neonate) water phantom at our lab and an extremely high photon flux (up to 550 mA at 140 kV with 1 s rotation). Given these extreme conditions, the deviation of the noise from the fitted inverse square root curve remained quite small, demonstrating that the high-flux effects in the PCD had a negligible impact. This statement is further supported by the artifact-free images of the anthropomorphic phantoms and the cadavers.
Overall, the research PCCT system is able to perform most diagnostic imaging tasks, including those of the head, chest, body, and extremities, e.g. the images in figures 12 and 13. Although the research PCCT is based on the platform of SOMATOM Definition Flash (Siemens Healthcare), not all of the same features and specifications are available for the PCD subsystem. For example, the fastest rotation time for a 3600 scan using the PCD subsystem is 0.5 s for the current design, which is slower than the fastest rotation time (0.28 s) available on SOMATOM Definition Flash. Again, these were design decisions made in the development of this particular research scanner and do not reflect an inherent limitation of PCD technology.
There are several limitations of this work. First, high-flux effects could have been further characterized using an isotope source to map out the measured counts relative to the input counts. However, such a task would be challenging on the research PCCT system, because (1) there is anti-scatter grid installed on the PCD and (2) it requires access to raw data before the logarithm operation, which the non-vendor authors do not have. However, pulse pile-up effects already have been assessed and reported by the vendor (Kappler et al 2014).
Second, one advantage of a PCD is its ability to exclude electronic noise. Consequently, a PCD CT system is expected to have better performance in low-dose situations where electronic noise plays a major role for an EID. This advantage was not demonstrated in this work, as it is currently work in progress.
Third, this work does not include an evaluation of the spectral performance of the research PCCT system. This is especially important because a reduced pixel size is used to enable high-flux imaging capability, but also may result in increased susceptibility to effects such as charge sharing and K-escape, which will degrade the energy-resolving capabilities of the system. Some indication of this effect was reflected in our CT number measurements: the CT numbers of iodine in chess mode bin 1 and bin 2 were very close, even though substantially different energy ranges were applied. This demonstrates that there is substantial overlap in the energy spectrum captured by the two bins. To thoroughly demonstrate the spectral imaging performance of the research PCCT system, a study of material decomposition capabilities is warranted. Indeed, comparing material-decomposition performance between a state-of-the-art photon-counting technique and a commercially-available dual-energy technique is a topic of interest. For example, a computer-simulation-based comparison of virtual-non-contrast imaging and iodine quantification between the subsequent-scanning, fast-kV-switching, dual-layer-detector, dual-source-dual-energy, and photon-counting techniques has been recently reported in (Faby et al 2015). The simulation of the photon-counting technique was based on the model reported in (Schlomka et al 2008). The comparison shows that the dual-source-dual-energy technique with pre-filtration outperforms the others, including the realistically modeled photon-counting technique. Ongoing work in our lab is using measured data to assess this same question.
Because it was beyond the scope of this paper, which sought to examine conventional measures of image quality for a PCCT system capable of operating at high photon flux values, we did not assess material decomposition performance in this study. Of note, image-based material-decomposition results for a research PCCT system similar to the one used in this work have been reported by the vendor (Kappler et al 2013, Kappler et al 2014). Similar to the predictions of (Faby et al 2015), (Kappler et al 2013) showed that the commercially available dual-source-dual-energy approach with pre-filtration outperformed both the macro-mode and chess-mode approaches of the PCD subsystem. However, as is also reported in (Kappler et al 2013), the chess mode simultaneously produces fully registered multi-energy projection data, which provides more flexibility for multi-material decomposition approaches than the available dual-energy CT techniques.
5. Conclusion
In this study, we have presented a thorough evaluation of the conventional imaging performance of a whole-body research PCCT system. For water, all scan protocols of the PCD subsystem in both the macro and chess modes provided CT number accuracy (±5 HU) and uniformity (±5 HU) that met clinical requirements. For high-Z materials, the PCD subsystem delivered energy selective information and presented increased contrast when compared to the EID subsystem. In terms of spatial resolution, the PCD subsystem and the EID subsystem had matched in-plane resolution, in terms of both MTF and NPS, but the PCD subsystem, with its more narrow detector, had the best-achievable SSP in the longitudinal direction for the same reconstruction kernel. With matched spatial resolution (in terms of both MTF and SSP), the noise performance of the PCD macro mode was comparable to that of the EID subsystem. For high-Z materials, with enhanced contrast and comparable noise performance, the PCD macro mode offered better CNR compared to the EID subsystem: 25.5% CNR improvement was achieved for iodine of concentration 32 mgI ml−1 at 140 kV.
We also have shown that the PCD subsystem suffered from negligible high-flux effects in extreme cases: the noise-to-tube current curves only slightly deviated from the fitted inverse square root function for a 77 mm wide neonate water phantom at high x-ray flux (up to 550 mA at 140 kV with 1 s rotation). Furthermore, both the CIRS phantom and the cadaver images showed no artifacts indicative of high-flux effects.
In summary, the PCD subsystem demonstrated comparable image quality using clinically relevant doses, dose rates, and protocols, relative to a traditional EID subsystem. It further delivered energy-selective information. For example, the high energy bin data demonstrated a reduction of beam hardening artifacts and calcium blooming. Overall, the results presented in this paper show that the evaluated whole-body research PCCT system can provide clinical image quality at clinically realistic x-ray photon flux.
Acknowledgments
The authors would like to thank Drs Andre Henning, Björn Kreisler, Dirk Röscher for their on-site support, and Thomas Vrieze for his assistance in HVL measurements. The project described was supported by Grant numbers R01 EB016966 and C06 RR018898 from the National Institute of Health, in collaboration with Siemens Healthcare. The content is solely the responsibility of the authors and does not necessarily represent the official views of the National Institute of Health. The equipment and concepts described in this work are based on a research device and are not commercially available.
References
- Altman A, Carmi R. TU-E-210A-03: a double-layer detector, dual-energy CT—principles, advantages and applications. Med Phys. 2009;36:2750. [Google Scholar]
- Alvarez RE, Macovski A. Energy-selective reconstructions in x-ray computerised tomography. Phys Med Biol. 1976;21:733. doi: 10.1088/0031-9155/21/5/002. [DOI] [PubMed] [Google Scholar]
- Bennett JR, Opie AM, Xu Q, Yu H, Walsh M, Butler A, Butler P, Cao G, Mohs A, Wang G. Hybrid spectral micro-CT: system design, implementation, and preliminary results. IEEE Trans Biomed Eng. 2014;61:246–53. doi: 10.1109/TBME.2013.2279673. [DOI] [PubMed] [Google Scholar]
- Cody DD, Pfeiffer D, McNitt-Gray MF, Ruckdeschel T, Strauss KJ. CT Quality Control Manual. Reston, VA: American College of Radiology; 2012. [Google Scholar]
- Faby S, Kuchenbecker S, Sawall S, Simons D, Schlemmer H-P, Lell M, Kachelrieß M. Performance of today’s dual energy CT and future multi energy CT in virtual non-contrast imaging and in iodine quantification: a simulation study. Med Phys. 2015;42:4349–66. doi: 10.1118/1.4922654. [DOI] [PubMed] [Google Scholar]
- Flohr TG, McCollough CH, Bruder H, Petersilka M, Gruber K, Süβ C, Grasruck M, Stierstorfer K, Krauss B, Raupach R. First performance evaluation of a dual-source CT (DSCT) system. Eur Radiol. 2006;16:256–68. doi: 10.1007/s00330-005-2919-2. [DOI] [PubMed] [Google Scholar]
- Flohr T, Stierstorfer K, Ulzheimer S, Bruder H, Primak A, McCollough C. Image reconstruction and image quality evaluation for a 64-slice CT scanner with z-flying focal spot. Med Phys. 2005;32:2536–47. doi: 10.1118/1.1949787. [DOI] [PubMed] [Google Scholar]
- Hounsfield GN. Computerized transverse axial scanning (tomography): part 1. Description of system. Br J Radiol. 1973;46:1016–22. doi: 10.1259/0007-1285-46-552-1016. [DOI] [PubMed] [Google Scholar]
- Hsieh J. TU-E-210A-01: dual-energy CT with fast-KVp switch. Med Phys. 2009;36:2749. [Google Scholar]
- Iwanczyk JS, Nygard E, Meirav O, Arenson J, Barber WC, Hartsough NE, Malakhov N, Wessel JC. Photon counting energy dispersive detector arrays for x-ray imaging. IEEE Trans Nucl Sci. 2009;56:535–42. doi: 10.1109/TNS.2009.2013709. [DOI] [PMC free article] [PubMed] [Google Scholar]
- Johnson TR. Dual-energy CT: general principles. Am J Roentgenol. 2012;199:S3–8. doi: 10.2214/AJR.12.9116. [DOI] [PubMed] [Google Scholar]
- Kappler S, Glasser F, Janssen S, Kraft E, Reinwand M. Medical Imaging 2010: Physics of Medical Imaging. San Diego, CA: International Society for Optics and Photonics; 2010. A research prototype system for quantum-counting clinical CT; p. 76221Z. [Google Scholar]
- Kappler S, Hahn K, Henning A, Goederer E, Kreisler B, Stadlthanner K, Sievers P, Ulzheimer S. Towards high-resolution multi-energy CT: recent results from our whole-body prototype scanner with high-flux capable photon counting detector. 3rd Workshop on Medical Applications of Spectroscopic X-Ray Detectors; Geneva, Switzerland: CERN; 2015. [Google Scholar]
- Kappler S, Hannemann T, Kraft E, Kreisler B, Niederloehner D, Stierstorfer K, Flohr T. Medical Imaging 2012: Physics of Medical Imaging. San Diego, CA: International Society for Optics and Photonics; 2012. First results from a hybrid prototype CT scanner for exploring benefits of quantum-counting in clinical CT; p. 83130X. [Google Scholar]
- Kappler S, Henning A, Krauss B, Schoeck F, Stierstorfer K, Weidinger T, Flohr T. Medical Imaging 2013: Physics of Medical Imaging. Lake Buena Vista, FL: International Society for Optics and Photonics; 2013. Multi-energy performance of a research prototype CT scanner with small-pixel counting detector; p. 86680O. [Google Scholar]
- Kappler S, Henning A, Kreisler B, Schöeck F, Stierstorfer K, Flohr T. 2014: Physics of Medical Imaging Medical Imaging. San Diego, CA: International Society for Optics and Photonics; 2014. Photon counting CT at elevated x-ray tube currents: contrast stability, image noise and multi-energy performance; p. 90331C. [Google Scholar]
- Kim JC, Anderson SE, Kaye W, Zhang F, Zhu Y, Kaye SJ, He Z. Charge sharing in common-grid pixelated CdZnTe detectors. Nucl Instrum Methods Phys Res A. 2011;654:233–43. [Google Scholar]
- Koenig T, Zuber M, Hamann E, Cecilia A, Ballabriga R, Campbell M, Ruat M, Tlustos L, Fauler A, Fiederle M. How spectroscopic x-ray imaging benefits from inter-pixel communication. Phys Med Biol. 2014;59:6195. doi: 10.1088/0031-9155/59/20/6195. [DOI] [PubMed] [Google Scholar]
- Kruger RL, McCollough CH, Zink FE. Measurement of half-value layer in x-ray CT: a comparison of two noninvasive techniques. Med Phys. 2000;27:1915–9. doi: 10.1118/1.1287440. [DOI] [PubMed] [Google Scholar]
- Kuvvetli I, Budtz-Jørgensen C. Measurements of charge sharing effects in pixilated CZT/CdTe detectors. IEEE Nuclear Science Symp. Conf. Record; 2007. pp. 2252–7. [Google Scholar]
- McCollough CH, Bruesewitz MR, McNitt-Gray MF, Bush K, Ruckdeschel T, Payne JT, Brink JA, Zeman RK. The phantom portion of the American College of Radiology (ACR) computed tomography (CT) accreditation program: practical tips, artifact examples, and pitfalls to avoid. Med Phys. 2004;31:2423–42. doi: 10.1118/1.1769632. [DOI] [PubMed] [Google Scholar]
- McCollough C, Leng S, Yu L, Fletcher JG. Dual-and multi-energy computed tomography: principles, technical approaches, and clinical applications. Radiology. 2015;276:637. doi: 10.1148/radiol.2015142631. [DOI] [PMC free article] [PubMed] [Google Scholar]
- Pellegrini G, Chmeissani M, Maiorino M, Blanchot G, Garcia J, Lozano M, Martinez R, Puigdengoles C, Ullan M, Casado P. Performance limits of a 55 μm pixel CdTe detector. IEEE Nuclear Science Symp. Conf. Record; 2004. pp. 2104–9. [Google Scholar]
- Persson M, Huber B, Karlsson S, Liu X, Chen H, Xu C, Yveborg M, Bornefalk H, Danielsson M. Energy-resolved CT imaging with a photon-counting silicon-strip detector. Phys Med Biol. 2014;59:6709. doi: 10.1088/0022-3727/59/22/6709. [DOI] [PubMed] [Google Scholar]
- Roessl E, Daerr H, Engel KJ, Thran A, Schirra C, Proksa R. Combined effects of pulse pile-up and energy response in energy-resolved, photon-counting computed tomography. IEEE Nuclear Science Symp. and Medical Imaging Conf; 2011. pp. 2309–13. [Google Scholar]
- Schardt P, Deuringer J, Freudenberger J, Hell E, Knüpfer W, Mattern D, Schild M. New x-ray tube performance in computed tomography by introducing the rotating envelope tube technology. Med Phys. 2004;31:2699–706. doi: 10.1118/1.1783552. [DOI] [PubMed] [Google Scholar]
- Schlomka J, Roessl E, Dorscheid R, Dill S, Martens G, Istel T, Bäumer C, Herrmann C, Steadman R, Zeitler G. Experimental feasibility of multi-energy photon-counting K-edge imaging in pre-clinical computed tomography. Phys Med Biol. 2008;53:4031. doi: 10.1088/0031-9155/53/15/002. [DOI] [PubMed] [Google Scholar]
- Schmidt TG, Zimmerman KC, Sidky EY. The effects of extending the spectral information acquired by a photon-counting detector for spectral CT. Phys Med Biol. 2015;60:1583. doi: 10.1088/0031-9155/60/4/1583. [DOI] [PMC free article] [PubMed] [Google Scholar]
- Shikhaliev PM. Computed tomography with energy-resolved detection: a feasibility study. Phys Med Biol. 2008a;53:1475. doi: 10.1088/0031-9155/53/5/020. [DOI] [PubMed] [Google Scholar]
- Shikhaliev PM. Energy-resolved computed tomography: first experimental results. Phys Med Biol. 2008b;53:5595. doi: 10.1088/0031-9155/53/20/002. [DOI] [PubMed] [Google Scholar]
- Shikhaliev PM. Photon counting spectral CT: improved material decomposition with K-edge-filtered x-rays. Phys Med Biol. 2012;57:1595. doi: 10.1088/0031-9155/57/6/1595. [DOI] [PubMed] [Google Scholar]
- Shikhaliev PM. Soft tissue imaging with photon counting spectroscopic CT. Phys Med Biol. 2015;60:2453. doi: 10.1088/0031-9155/60/6/2453. [DOI] [PubMed] [Google Scholar]
- Shikhaliev PM, Fritz SG. Photon counting spectral CT versus conventional CT: comparative evaluation for breast imaging application. Phys Med Biol. 2011;56:1905. doi: 10.1088/0031-9155/56/7/001. [DOI] [PubMed] [Google Scholar]
- Shikhaliev PM, Fritz SG, Chapman JW. Photon counting multienergy x-ray imaging: effect of the characteristic x rays on detector performance. Med Phys. 2009;36:5107–19. doi: 10.1118/1.3245875. [DOI] [PubMed] [Google Scholar]
- Siemens AG. SOMATOM Definition Flash: System Owner Manual. Forchheim; Germany: 2012. p. G. 23/46. [Google Scholar]
- Siewerdsen J, Cunningham I, Jaffray D. A framework for noise-power spectrum analysis of multidimensional images. Med Phys. 2002;29:2655–71. doi: 10.1118/1.1513158. [DOI] [PubMed] [Google Scholar]
- Silkwood JD, Matthews KL, Shikhaliev PM. Photon counting spectral breast CT: effect of adaptive filtration on CT numbers, noise, and contrast to noise ratio. Med Phys. 2013;40:051905. doi: 10.1118/1.4800504. [DOI] [PubMed] [Google Scholar]
- Stierstorfer K, Rauscher A, Boese J, Bruder H, Schaller S, Flohr T. Weighted FBP—a simple approximate 3D FBP algorithm for multislice spiral CT with good dose usage for arbitrary pitch. Phys Med Biol. 2004;49:2209. doi: 10.1088/0031-9155/49/11/007. [DOI] [PubMed] [Google Scholar]
- Taguchi K, Iwanczyk JS. Vision 20/20: single photon counting x-ray detectors in medical imaging. Med Phys. 2013;40:100901. doi: 10.1118/1.4820371. [DOI] [PMC free article] [PubMed] [Google Scholar]
- Tümer T, Clajus M, Visser G, Yin S, Willson P, D’Aries L, Parnham K, Glick B, Perry J, Gamble T. Preliminary results obtained from a novel CdZnTe pad detector and readout ASIC developed for an automatic baggage inspection system. IEEE Nuclear Science Symp. Conf. Record; 2000. pp. 4/36–41. [Google Scholar]
- Ulzheimer S, Freund J. White Paper: The Stellar Detector. Forchheim: Siemens AG Medical Solutions; 2012. [Google Scholar]
- Wang AS, Harrison D, Lobastov V, Tkaczyk JE. Pulse pileup statistics for energy discriminating photon counting x-ray detectors. Med Phys. 2011;38:4265–75. doi: 10.1118/1.3592932. [DOI] [PubMed] [Google Scholar]
- Xu C, Chen H, Persson M, Karlsson S, Danielsson M, Svensson C, Bornefalk H. Energy resolution of a segmented silicon strip detector for photon-counting spectral CT. Nucl Instrum Methods Phys Res A. 2013a;715:11–7. [Google Scholar]
- Xu C, Danielsson M, Bornefalk H. Evaluation of energy loss and charge sharing in cadmium telluride detectors for photon-counting computed tomography. IEEE Trans Nucl Sci. 2011;58:614–25. [Google Scholar]
- Xu C, Danielsson M, Karlsson S, Svensson C, Bornefalk H. Preliminary evaluation of a silicon strip detector for photon-counting spectral CT. Nucl Instrum Methods Phys Res A. 2012;677:45–51. [Google Scholar]
- Xu C, Persson M, Chen H, Karlsson S, Danielsson M, Svensson C, Bornefalk H. Evaluation of a second-generation ultra-fast energy-resolved ASIC for photon-counting spectral CT. IEEE Trans Nucl Sci. 2013b;60:437–45. [Google Scholar]
- Yu Z, Leng S, Jorgensen S, Li Z, Gutjahr R, Chen B, Duan X, Halaweish A, Yu L, Ritman E. Medical Imaging 2015: Physics of Medical Imaging. Orlando, FL: International Society for Optics and Photonics; 2015. Initial results from a prototype whole-body photon-counting computed tomography system; p. 94120W. [DOI] [PMC free article] [PubMed] [Google Scholar]