

Abstract
Polycyclic aromatic hydrocarbons (PAH) are common components of many materials, such as petroleum and various types of tars. They are generally present in mixtures, occurring both naturally and as byproducts of fuel processing operations. It is important to understand the thermodynamic properties of such mixtures in order to understand better and predict their behavior (i.e., fate and transport) in the environment and in industrial operations. To characterize better the thermodynamic behavior of PAH mixtures, the phase behavior of a binary (anthracene + phenanthrene) system was studied by differential scanning calorimetry, X-ray diffraction, and the Knudsen effusion technique. Mixtures of (anthracene + phenanthrene) exhibit non-ideal mixture behavior. They form a lower-melting, phenanthrene-rich phase with an initial melting temperature of 372 K (identical to the melting temperature of pure phenanthrene) and a vapor pressure of roughly lnP/Pa = −2.38. The phenanthrene-rich phase coexists with an anthracene-rich phase when the mole fraction of phenanthrene (xP) in the mixture is less than or equal to 0.80. Mixtures initially at xP = 0.90 consist entirely of the phenanthrene-rich phase and sublime at nearly constant vapor pressure and composition, consistent with azeotrope-like behavior. Quasi-azeotropy was also observed for very high-content anthracene mixtures (2.5 < xP < 5) indicating that anthracene may accommodate very low levels of phenanthrene in its crystal structure.
Keywords: Polycyclic aromatic hydrocarbons, Anthracene, Phenanthrene, Binary mixtures, Phase equilibria, Vapor pressure
1. Introduction
Mixtures of polycyclic aromatic hydrocarbons (PAH) are quite common in many materials. They occur naturally in fossil fuels and as byproducts of combustion or gasification (e.g., in coal tar) that have both environmental and commercial significance. Therefore, understanding thermodynamic behavior that might affect the transport of PAHs in industrial and environmental settings is important. This laboratory has been engaged in studying the phase behavior of binary and multi component PAH mixtures for some time [1–4]. The emerging picture is that the thermodynamics of binary PAH mixtures are generally non-ideal and often unpredictable. The goal of the present research is to enhance the understanding of PAH mixture thermodynamics by studying the phase behavior of a binary (anthracene + phenanthrene) system whose behavior is somewhat unique from previously investigated PAH mixtures [1,2]. Anthracene and phenanthrene are isomers and both are common components of PAH mixtures.
This work is part of a broad study on binary PAH mixtures. Similar studies have been conducted on binary, organic component mixtures and these principally report the temperatures and enthalpies of solid to liquid phase transitions, often involving one or two eutectic points [5–19]. In addition to the analyses of melting temperature, enthalpies of fusion, and microstructure, many of the results presented here address sublimation behavior, i.e., vapor pressure, of the (anthracene + phenanthrene) system given that the (solid + vapor) equilibrium of PAH mixtures is not yet fully characterized or reported on in the literature. The experimental procedures are analogous to those previously reported for mixtures of (anthracene + pyrene), (anthracene + benzo[a]pyrene), and (pyrene + 9, 10-dibromoanthracene) [1–3].
2. Experimental
2.1. Materials
Anthracene (CAS Reg. No. 120-12-7) and phenanthrene (CAS Reg. No. 85-01-8) were obtained from Acros Organics. Purity (reported in table 1) was verified by (gas chromatography + mass spectrometry) (GC + MS) analysis, which revealed no other polycyclic aromatics or hydrocarbons near the molar mass range of the two components of interest. Thus, samples were used with no further purification.
TABLE 1.
Chemical sample table.
| Chemical name | Source | Initial mass fraction purity | Purification method | Analysis method |
|---|---|---|---|---|
| Anthracene | Acros Organics | 0.99 | None | (GC + MS)a |
| Phenanthrene | Acros Organics | 0.97 | None | (GC + MS)a |
(Gas chromatography + mass spectrometry).
2.2. Mixture preparation
Mixtures of anthracene and phenanthrene were prepared using a melt and quench-cool technique. The desired quantities of anthracene and phenanthrene were measured to ±0.01 mg and roughly 30 mg were sealed within a stainless steel vessel. The vessel was then heated to T = (510 ± 5) K and agitated, ensuring that both components melted and were well mixed in a liquid state. After a period of 5 min, the vessel was removed from the heat source and immediately immersed in liquid nitrogen, which provided cooling at an estimated (70 to 80) K·s−1 for the first 4 s. While this preparation technique was originally intended to preserve the disorder of the well-mixed liquid during crystallization, it has been shown that the observed results are largely unaffected by the liquid nitrogen cooling technique [2]. This heating and quench-cool procedure was repeated three additional times before the solid mixture was removed from the preparation vessel and placed in a glass storage vial. Uniformity of the samples was confirmed by visual examination.
2.3. Melting temperature and enthalpy of fusion
Melting temperatures and enthalpies of fusion (ΔfusH) of mixtures and pure samples were measured using a Thermo Scientific melting temperature analyzer and a Mettler Toledo differential scanning calorimeter (DSC). In the latter case, hermetically sealed DSC pans were filled with (2 to 3) mg of sample and scanned in both heating and cooling modes. A melting temperature analyzer was used to visually observe and obtain melting temperature measurements to 1 K resolution. Those reported from the DSC represent events occurring over several degrees and were not as high resolution. Melting behavior was tracked from thaw to liquidus temperatures using the melting temperature analyzer by placing (2 to 3) mg of each sample (powder) inside a glass capillary tube and heating them at (1 ± 0.5) K·min−1. The thaw temperature is the temperature at which the first droplet of liquid appears in the capillary tube. The liquidus temperature is reached when the last crystal in the tube melts. Visual observation of thaw temperature is generally more straightforward when powders are used because liquid droplets are visible on the numerous particle surfaces.
2.4. Vapor pressure
The Knudsen effusion technique was used to measure the vapor pressures (P) of solid (anthracene + phenanthrene) mixtures and the pure components. This technique allows for vapor pressure measurement of low volatility compounds while not requiring unacceptably high experimental temperatures that could result in degradation of these compounds. The Knudsen effusion technique permits measurement of sample mass loss from a confining cell into a high vacuum through a small orifice and relates the loss to vapor pressure by
| (1) |
where is the mass loss rate, A is the orifice area, R is the universal gas constant, T is the sample temperature, M is the molar mass, and W is the Clausing correction factor. The Clausing correction factor is very nearly unity [1]. A detailed explanation of the Knudsen effusion theory and its implementation in this laboratory can be found elsewhere [20,21].
Samples of (anthracene + phenanthrene) were placed inside effusion cells prepared from steel shim stock. The cells were sealed except for a single, circular orifice of diameter (0.60 ± 0.01) mm cut into the cell. Each cell was placed on the arm of a continually recording microbalance contained in a high vacuum chamber maintained at (0.001 ± 0.0003) Pa to achieve the required condition of negligible backpressure outside the orifice. A calibrated, type-K thermocouple was used to measure cell temperature to ±0.1 K. At equilibrium, the pressure inside the cell is the vapor pressure of the mixture and the subliming components leak from the cell in proportions representative of the vapor phase. The leak rate is measured as mass loss and related to vapor pressure by equation (1). The relative standard instrument uncertainty within the experimental temperature range is ur = 0.045. In the case of a mixture, there is obviously a question of what molar mass must be used for M. In this study the mixture components are isomers of identical molar mass (178.23 g·mol−1), so naturally that value was used.
What is being examined here is a solid sublimation system. The temperatures are always kept so low that there is no formation of a liquid phase. Assuming the fundamental condition of thermodynamic equilibrium in the sample cell is fulfilled (as must be considered reasonable), then equilibrium must be satisfied for all phases that might be present. This means that if a molecular component of a particular solid mixture were to have a sublimation pressure greater than the sublimation pressure of that pure component, a new pure component phase would be formed, even if it were not present in the original mixture. In other words, the vapor pressure of the system can never exceed the sum of pure component vapor pressures.
2.5. Mixture X-ray diffraction and gas chromatography
The crystal structures of anthracene, phenanthrene and their mixtures were qualitatively investigated using powder X-ray diffraction (XRD). Samples were reduced to a fine powder and dusted onto glass slides that were coated with a thin petroleum film. A Siemens X-ray diffractometer (model D5000) was used to measure the diffraction patterns of each sample between 10° and 60°.
A gas chromatograph equipped with a flame ionization detector (GC-FID) was used to determine the composition of mixtures before, during, and after vapor pressure experiments. Samples were dissolved in dichloromethane to an approximate concentration of 5 μg · ml−1 and analyzed using a calibrated Shimadzu GC-FID (model GC2010). The EPA Method 8270C procedure was followed [22].
3. Results and discussion
3.1. Phase diagram and enthalpy of fusion
Melting temperatures and enthalpies of fusion for all pure components and mixtures were measured by temperature-controlled differential scanning calorimetry and are given with respect to the anthracene mole fraction (xA) in table 2. The melting temperatures measured with a visual melting temperature analyzer were consistent with those obtained by DSC (table 2). Pure phenanthrene melts at T = 372 K with ΔfusH = (85 ± 6.0) J · g−1 and pure anthracene melts at T = 490 K with ΔfusH = (153.7 ± 10.8) J·g−1. These results are in general agreement with Domalski and Hearing [23], Roux et al. [24], and with previous studies conducted in this laboratory [1–4].
TABLE 2.
Thaw (Tfus,thaw), liquidus (Tfus,liquidus) and crystallization (Tcryst) temperatures and total enthalpies of fusion of (anthracene + phenanthrene) mixtures and pure components.a The mixtures form a lower-melting, phenanthrene-rich (PR) phase that coexists with a higher-melting, anthracene-rich (AR) phase when xA ≥0.20.
| xAb | Tfus,thaw/Kc (DSC/visual) | Tfus,liquidus/Kc | Tcryst/Kc | (Peak integration)d | Solid phase(s) |
|---|---|---|---|---|---|
| 1.00 | 490/490 | 490 | 472 | 153.7 | Anthracene |
| 0.90 | 373/− | 486 | 461 | 142.7 | PR & AR |
| 0.80 | 373/− | 481 | 453 | 128.9 | PR & AR |
| 0.70 | 373/373 | 473 | 446 | 113.2 | PR & AR |
| 0.60 | 373/373 | 467 | 436 | 102.7 | PR & AR |
| 0.50 | 372/373 | 460 | 426 | 101.0 | PR & AR |
| 0.40 | 373/373 | 448 | 409 | 100.9 | PR & AR |
| 0.30 | 372/372 | 435 | 403 | 95.7 | PR & AR |
| 0.20 | 372/372 | 416 | 381 | 85.1 | PR & AR |
| 0.10 | 372/372 | 388 | 363 | 84.9 | PR |
| 0 | 372/372 | 372 | 360 | 85.0 | Phenanthrene |
Experimental pressure was not controlled beyond the typical range of atmospheric pressure, (100,576 to 102,269) Pa.
Anthracene mole fraction with standard uncertainty, u = 0.01.
Standard uncertainty, u = 1 K.
Relative standard uncertainty, ur = 0.07.
Figure 1 represents a phase diagram for the (anthracene + phenanthrene) system in which only solid phases exist below the thaw curve and only a liquid phase exists above the liquidus curve. The area between these curves shows the equilibrium coexistence of both solid and liquid phases. The binary mixtures form at least one phase that melts at near T = 372 K, the melting temperature of pure phenanthrene. However, it is only a portion of the mixture that melts at this temperature, and both solid and liquid coexist until the liquidus temperature is reached. In contrast with the low temperature melting phase that determines the thaw temperature, the phase that determines the liquidus curve appears to change continuously with mixture composition. The thaw points at xA = (0.80 and 0.90) were determined from DSC results, which detected melting of a very small portion of the mixture that was not visible in the melting temperature analyzer.
FIGURE 1.

(Solid + liquid) phase diagram and total enthalpies of fusion for the (anthracene + phenanthrene) system, based upon heating curves. __◆__, thaw curve; –■–, liquidus curve; –●–, with error bars representing uncertainty. xA and T represent mole fraction of anthracene and temperature, respectively.
The region between thaw and liquidus curves is not heating rate dependent in the range from (1 to 20) K · min−1 and is observed in both the DSC and melting temperature analyzer for all binary compositions of (anthracene + phenanthrene), suggesting that the binary system can form at least two phases; one higher melting temperature phase that has only limited solubility in a second lower melting phase.
Figure 2 displays the DSC heating and cooling scans of pure phenanthrene and four (anthracene + phenanthrene) mixtures at xP = (0.90, 0.80, 0.70, and 0.50), where xP represents the mole fraction of phenanthrene in each mixture. Peaks in these DSC scans represent phase transitions and can be integrated to determine the enthalpy of fusion (or solidification) of each sample to a relative standard uncertainty of ur = 0.07 (see table 2 and figure 1). These and all other DSC scans were conducted between T = (298 and 523) K at 10 K · min−1 heating and cooling rates. Values of enthalpy and transition temperatures were generally insensitive to changes in DSC heating and cooling rate in the range of (5 to 20) K · min−1. Table 2 and figure 2 show the typical result during cooling in a DSC experiment; the sample sub-cools by about T = 20 K before undergoing re-solidification.
FIGURE 2.

Differential scanning calorimetry of pure phenanthrene (a) and four (anthracene + phenanthrene) mixtures at (from bottom to top) xP = 0.90 (b), 0.80 (c), 0.70 (d), and 0.50 (e), where xP is the mole fraction of phenanthrene in each mixture, Φ is DSC heat input, and T is temperature.
The DSC heating scans in figure 2 show a distinct low temperature fusion peak for the high phenanthrene content mixture (xP = 0.90) and a very broad fusion peak for mixtures at xP = (0.80, 0.70, and 0.50). The latter two mixtures appear to undergo at least two endothermic phase transitions upon heating. No matter the mixture composition, the beginning of the low temperature transition occurs at (372 ± 1) K, the melting temperature of pure phenanthrene. For mixtures at xP ≤0.80, this is then followed by a broad endotherm that likely reflects dissolution of at least some of the remaining solid into the melt phase and concluding at a temperature consistent with the liquidus temperature. Table 2 shows that this endotherm between thaw and liquidus temperature can stretch over 100 K as mixtures are enriched with anthracene. The consistency of the liquidus temperature increase with composition, combined with the fact that the liquidus temperature does not appear to be determined by heating rate, strongly suggests that what is being observed is a process of continuous equilibration of the remaining solid phase with the melt phase. Note that there is never observed a clear melting endotherm associated with the liquidus temperature, meaning that there is no remaining distinct phase whose melting defines the liquidus temperature.
Subsequent cooling at a rate of 10 K · min−1 induces a crystallization process at T = 381 K for the mixture at xP = 0.80, T = 403 K for the mixture at xP = 0.70, and T = 426 K for the mixture at xP = 0.50 (table 2). This is believed to reflect the precipitation of an anthracene-rich phase, which is then followed by a further gradual solidification process between T = (373 and 364) K for the mixture initially at xP = 0.80, T = (393 to 363) K for the mixture initially at xP = 0.70, and T = (423 to 363) K for the mixture initially at xP = 0.50. These secondary, gradual re-solidification processes are not characterized by any distinct crystallization exotherm, but rather, by a broad exotherm. In contrast to this seemingly multiphase behavior, the phenanthrene enriched mixture at xP = 0.90 undergoes only a single endothermic phase transition in which the entire mixture melts over the temperature range from (372 to 388) K. Upon subsequent cooling, this mixture re-solidifies at T = 363 K consistent with crystallization of a single phase. Note that when reheated, the phase transition enthalpies and associated temperatures match those of the initial heating sequence (not shown) so the processes are reversible, even given the apparent hysteresis in behavior.
An interesting feature of the mixture at xP = 0.80 is that while its melting peak and associated enthalpy of fusion are quite close to those seen for the mixture at xP = 0.90, the solidification process DSC signature is not consistent with crystallization of a pure phase. The solidification peak in the DSC significantly increased in its temperature up to quite near the melting peak and seemed to involve a sharp crystallization event, followed by a broader exotherm extending to temperatures characteristic of crystallization of pure phenanthrene. In other words, the tendency of the melt to recrystallize as a solid phase was enhanced. The temperature at which this happened was still much below the liquidus temperature observed during heating.
These DSC results suggest that mixtures of anthracene and phenanthrene form a lower melting, phenanthrene-rich phase (or phases), and that this phase coexists with a higher-melting, anthracene-rich phase when xP ≤0.80. With regard to the results of figure 2, all evidence of pure anthracene and phenanthrene solid phases disappears in the mixtures. Neither pure anthracene nor phenanthrene is a stable phase in such mixture systems because the mixture re-solidification peaks do not match those of either pure component (shown here only for pure phenanthrene). The broad endothermic peaks seen during heating of mixtures at xP ≤ 0.80 suggest that a high melting, anthracene-rich phase continually re-equilibrates with what was initially a low melting, phenanthrene-rich liquid phase as the system is further heated.
The gradual melting process is entirely consistent with figure 1 in that there is always an initiation of melting at a constant thaw temperature, and gradual completion of the process culminating at the liquidus temperature. On the other hand, the cooling process shows crystallization of what appears from the sharpness of the exotherm to be a single phase at a temperature some tens of degrees lower than the liquidus temperature. The crystallization of the low-melting phase is never observed as such (in the presence of a solidified anthracene-rich phase), but instead there is a broad exotherm associated with formation of that phase, and this exotherm typically extends to temperatures approaching those at which pure phenanthrene crystallizes upon cooling. The indication is again a gradual approach to equilibrium, involving coexistence of a melt and solid phase whose composition must change with temperature.
The (solid + liquid) phase diagram shown in figure 1 differs from others heretofore reported [17–19]. Bradley and Smith [17] approached the liquidus curve from the melt side, so any possible super-cooling would result in the curve being lower than what was observed here in the opposite (heating) direction. Comparison of the present data with that of Bradley and Marsh [18] shows reasonable agreement in liquidus temperature where there exists a relatively well defined melting peak in the DSC (when xA < 0.20). Some discrepancy arises where the phase behavior becomes more complex. This range of liquidus temperature discrepancy represents melting of only a small fraction of material and interpretation of a small fraction of a very broad DSC peak, which raises a question as to how precisely the endpoint of the melting process could be discerned if one were relying upon purely visual evidence. It is likely that the discrepancy in the results is attributable to the complexity of the phase behavior in this system and different interpretations of data around difficult-to-measure endpoints.
The main difference between the phase diagram shown in figure 1 and that of the previous studies is that the latter report formation of solid solutions and a thaw curve that changes with mixture composition [17,18]. The earlier studies tracked melting temperatures of a single piece of sample, flush against a glass capillary tube, which is a potentially less effective technique than the use of powder samples described in Section 2.3. Another explanation that immediately suggests itself is existence of a low-temperature melting phase present in the current study, which was not observed (or perhaps non-existent) in the earlier studies. Nucleation of a solid phase was observed in this DSC study at what might have been interpreted in the earlier studies as “not far below” the melting temperature [17]. But this was not the final, stable solid phase in this work. Instead, a further slow solid phase transformation was observed during cooling, that extended to around the very temperatures (358 K or higher) above which the earlier workers had characterized as necessary for “homogenization” of the solid [17]. It is likely that some process of a low temperature phase reorganization was prevented from occurring by use of the techniques employed in the earlier studies, and that the phase that formed during their cooling step was in fact metastable relative to the phase formed at the lower temperature conditions to which we took our samples during cooling.
In addition to the melting temperatures, the results from the DSC thermal analyses are given in table 2 and plotted on figure 1. The is a summation of all endothermic phase transition peaks observed in the DSC heating scan. is very similar to the enthalpy of fusion of pure phenanthrene (85 J · g−1) over a wide range of compositions. This means that when the mixture contains only a modest amount of anthracene, the energetics suggest a phenanthrene-like phase. It is not until xA ≥0.70 that begins to more drastically shift towards the enthalpy of fusion of pure anthracene. This indicates that the ability of anthracene to reach a lower energy crystalline configuration is significantly impeded by the presence of relatively small amounts of phenanthrene.
The DSC results and associated phase diagram suggest that there exists a phenanthrene-rich phase that can accommodate up to 20 mol% anthracene into its crystal structure without causing deviation from the pure phenanthrene melting temperature of 372 K and fusion enthalpy of 85 J · g−1. It is also important to recognize that where the terms “phenanthrene-rich” and “anthracene-rich” phase are used, they do not necessarily reflect constant composition phases. This is apparent when there exists what we call a “phenanthrene-rich” phase through up to 20 mol% anthracene.
Knowledge of the total solidification enthalpy allows for parametric exploration of what the enthalpic contribution of the anthracene-rich phase must be if the phenanthrene-rich phase enthalpy of fusion is assumed to be a constant, as implied by the constancy of the thaw-temperature and in the low temperature region of figure 1. In this case:
| (2) |
The total mixture fusion enthalpy must be determined by contributions of the phenanthrene-rich and anthracene-rich phases:
| (3) |
or
| (4) |
where m represents sample mass and subscripts T, PR, and AR represent the total mixture, phenanthrene-rich phase and anthracene-rich phase, respectively and is specific enthalpy of fusion given in units of J · g−1n. Again, we will use here an assumption that the values of are constant. Upon rearrangement,
| (5) |
In equations (2)–(5) above, the enthalpic contributions of the anthracene-rich and phenanthrene-rich phases are expressed with respect to the mass of each respective phase. Of course it was not possible to independently experimentally verify the composition of each phase. However, since integration of peaks from the DSC scans results in fusion enthalpies per total mass of each sample, it is useful to recognize that
| (6) |
where given in T is enthalpy of fusion per total sample mass. Upon rearrangement,
| (7) |
It is now possible to calculate xPR and for various mixtures using equations (5) and (7) if the assumption set forth in equation (2) is imposed. The consequence of this analysis is that is always significantly greater than even when the total anthracene content decreases towards 20 mol% and there is very little of the anthracene-rich phase present. Furthermore, as the system composition moves towards that of pure anthracene, approaches the fusion enthalpy of pure anthracene. These results point in the direction of anthracene-like behavior for the anthracene-rich phase.
3.2. X-ray diffraction
Powder X-ray diffraction studies were conducted to study the crystal structures of the (anthracene + phenanthrene) mixtures in comparison to those of the pure components. The results are somewhat qualitative in that peak intensity from one diffractogram to another cannot be compared, due to minor differences in sample distributions. Though equal quantities of samples were used in all cases, it is not possible to say that each was distributed perfectly homogenously. Hence, there can be moderate uncertainty when comparing peak amplitudes from sample to sample.
Peak positions from the mixture results can be compared to those of the pure component X-ray diffraction patterns. Figure 3 shows that mixtures of (anthracene + phenanthrene) lack the long range, organized crystal structure of the pure components because the few peaks that exist in the mixture X-ray patterns are not well defined and do not rise much above the baseline. This result is consistent with the DSC/melting point studies and implies that the mixtures form amorphous, glassy solid phases with no consistent stoichiometry, but with enthalpy similar to crystalline phases. The gradual approach to equilibrium discussed in Section 3.1 may lead to this non-crystalline character.
FIGURE 3.

XRD patterns of pure phenanthrene (a), pure anthracene (j) and (anthracene + phenanthrene) mixtures at (from bottom to top) xA = 0.10 (b), 0.20 (c), 0.30 (d), 0.40 (e), 0.50 (f), 0.60 (g), 0.70 (h), and 0.80 (i), where xA represents the mole fraction of anthracene in each mixture and θ is the XRD diffraction angle.
There are some similarities between the mixture scans and those of the pure components. The 22° peak of phenanthrene is retained in mixtures at xA = (0.10 to 0.80), but those peaks are not well defined and are at least 3 times smaller than that of pure phenanthrene. Similarly, all mixtures have a peak similar to that for pure anthracene at 19.5° while only anthracene-rich mixtures at xA = (0.70 and 0.80) retain the 21.5° and 25.4° peaks also observed in pure anthracene scans. Again, peaks from the mixture scans are poorly defined and considerably smaller than those of pure anthracene. This means that although the mixtures seem to exhibit some of the crystal structure of their parent compounds, the pure component characteristics are not well preserved in the mixture.
It is worth also noting that there is a peak at 26.5° in mixtures at xA = (0.10 to 0.60) that is present in neither pure anthracene nor phenanthrene scans, giving further indication that the phenanthrene-rich phase discussed above is distinctly different from pure phenanthrene despite its having similar enthalpies of fusion and melting temperatures.
3.3. Sublimation vapor pressure
The measured vapor pressure of pure anthracene, lnPA/Pa = 32.211-11683·T/K−1 at T = (300 to 373) K, and phenanthrene, lnPA/Pa = 31.83 – 10640·T/K−1 at T = (296 to 313) K, compare favorably to values previously reported by this laboratory [25,26] and shown to be in agreement with other literature sources [27–37]. Individual vapor pressure measurements are provided as supplementary information. Anthracene and phenanthrene are isomers with very similar molecular structures. Mixtures of these two compounds might well be expected to behave ideally, that is, sublime following Raoult’s law, a weighted summation of pure component vapor pressures based on the assumption that intermolecular forces in the mixture are the same as those in the pure components. However, previous studies in this laboratory have identified several binary PAH mixtures whose vapor pressure behavior is complicated and highly non-ideal [1–3]. In previous studies, the vapor pressure of binary mixtures of anthracene + pyrene and anthracene + benzo[a]pyrene showed solid azeotropy and azeotrope-like character [1,2].
The vapor pressure measurements in this (anthracene + phenanthrene) mixture study were continuously performed on samples of known initial composition and tracked over a period of time during which the composition was allowed to change. The experiments required that the composition of the mixtures be measured throughout each sequence. Thus, samples were occasionally removed from the effusion cells, dissolved in dichloromethane, and analyzed by GC-FID. Reported mole fractions are accurate within a standard uncertainty of u = 0.01.
Figure 4 shows the results of two experiments that examined vapor pressure as a function of mass loss of two mixtures, one initially at xP = 0.30 and another at xP = 0.70. Both experiments tracked vapor pressure at T = 313.2 K. It needs to be kept in mind that unless both components vaporize at exactly the same rate, composition, and with that, vapor pressure, will continuously decrease while the more volatile component is preferentially lost via sublimation. With reference to figure 4, it is confirmed that phenanthrene is the more volatile pure component, as its vapor pressure is nearly 20 times higher than that of anthracene at T = 313.2 K. Thus, it is expected that as mass is lost in the experiments of figure 4, the vapor pressure would drop, unless the two components behave as separate pure phases. The decreasing vapor pressure shown in figure 4 establishes that there is interaction between components in these solid mixtures, consistent with the phase behavior and X-ray data in Sections 3.1 and 3.2, neither of which indicates pure species behavior. The decreasing vapor pressure in figure 4 is path dependent, but the transient vapor pressure path exhibited in figure 4 is reproducible for mixtures of identical initial composition (not shown) and the same general trends are observed for all (anthracene + phenanthrene) mixture compositions.
FIGURE 4.
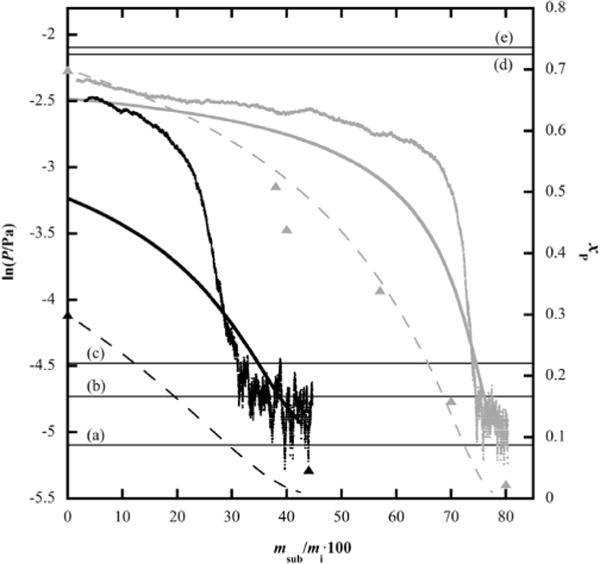
Vapor pressure (P) as a function of mass loss of two mixtures, one initially at phenanthrene mole fraction xP = 0.30 (in black) and another at xP = 0.70 (in grey), at T = 313.2 K. The thick solid and thin dashed lines represent Raoult’s law-calculated vapor pressure and composition evolution, respectively. Triangles are actual measured compositions of the mixtures initially at xP = 0.30 (black) and xP = 0.70 (grey); msub and mi represent mass lost via sublimation and initial sample mass, respectively. Horizontal lines represent pure anthracene (a), pure phenanthrene (d) and maximum possible system (e) vapor pressures. Raoult’s law reference curves for two anthracene-rich mixtures at xP = 0.024 (b) and 0.047 (c) are also given as horizontal lines.
The experimental vapor pressures of the mixtures shown in figure 4 are always lower than that of pure phenanthrene, confirming absence of a pure phenanthrene phase and existence of true mixture behavior. This behavior is distinctly different from that observed in some previous binary PAH mixture studies in which the vapor pressure initially behaved as a sum of the two pure species vapor pressures (the maximum possible pressure in the effusion cell) before decreasing to reveal complicated phase behavior [1,2].
Just as figure 4 indicates no phase separated pure phenanthrene in either of these two mixtures, the same held true for the initially equimolar and phenanthrene-rich (xP = 0.90) (anthracene + phenanthrene) mixtures of figure 5.
FIGURE 5.

Vapor pressure (P) as a function of mass loss of two mixtures, one initially at phenanthrene mole fraction xP = 0.50 (in black) and another at xP = 0.90 (in grey), at T = 313.2 K. The thick solid lines and thin dashed line represent Raoult’s law-calculated vapor pressure and composition evolution, respectively. Squares are actual measured compositions of the initially equimolar mixture; msub and mi represent mass lost via sublimation and initial sample mass, respectively. Horizontal lines represent pure anthracene (a), pure phenanthrene (c) and maximum possible system (d) vapor pressures. The Raoult’s law reference curve for an anthracene-rich mixture at xP = 0.028 (b) is also given as a horizontal reference line.
Vapor pressure evolutions for mixtures assumed to be ideal, and having initial compositions of xP = (0.30, 0.50, 0.70, and 0.90) were calculated using Raoult’s law and plotted in figures 4 and 5 with respect to percent mass loss. Comparison of these predictions to their respective experimental vapor pressure measurements shows obvious divergence from Raoult’s law behavior, indicating that the vapor pressure behavior of (anthracene + phenanthrene) mixtures is non-ideal, at least over certain ranges of composition.
One rather striking observation is that all mixtures examined in this study initially sublime in a narrow range of vapor pressures between lnP/Pa = −(2.25 and 2.5). In the case of the phenanthrene-rich mixtures initially between xP = (0.70 and 0.90), the initial experimental vapor pressures are relatively close to those calculated by Raoult’s law because the lnP/Pa = −2.25 to −2.5 range is bound by the Raoult’s law predictions for those initial (xP = 0.70 and 0.90) concentrations. In contrast, however, the initial vapor pressures of equimolar (figure 5) and xP = 0.30 (figure 4) (anthracene + phenanthrene) mixtures are significantly higher than what is predicted by Raoult’s law.
Based upon this and the DSC and XRD results of Sections 3.1 and 3.2, it again appears as though mixtures of anthracene and phenanthrene contain a phenanthrene-rich phase that has an equilibrium vapor pressure of roughly lnP/Pa = −(2.38 ± 0.13) and an initial melting temperature of 372 K, which is identical to the melting temperature of pure phenanthrene.
Despite the obvious divergence from the Raoult’s law predicted vapor pressure behavior, the composition evolution of mixtures initially at xP = (0.5 and 0.7) (shown as black squares and grey triangles) are relatively well predicted by the Raoult’s law calculations shown as dashed lines in figures 4 and 5. This behavior does not indicate ideality. Rather, it must be understood that the vapor pressure of anthracene is nearly 20 times lower than that of phenanthrene at T = 313.15 K. Thus, the vapor pressure, and with that, the mass loss of anthracene contributes very little to the overall predicted results. In other words, the Raoult’s law calculation is based almost entirely on phenanthrene loss. So then it is not surprising that the compositions of mixtures containing the phenanthrene-rich phase evolve in a way that matches that of pure phenanthrene and the Raoult’s law predictions.
In the case of the initially xP = 0.90 mixture, it appears (based on vapor pressure and DSC results) as though the mixture is completely comprised of the phenanthrene-rich phase. Figure 6 shows the vapor pressure of this mixture with respect to temperature on a traditional Clapeyron plot. The sublimation enthalpy of this mixture, ΔsubH = 89.6 kJ · mol−1, was obtained from the slope of the curve in figure 6 and is quite similar to that of pure phenanthrene (ΔsubH = 88.5 kJ · mol−1), but significantly different from that of pure anthracene (ΔsubH = 97.1 kJ · mol−1). The vapor pressure measurements shown in figure 6 are also tabulated as supplemental information.
FIGURE 6.

Vapor pressure of the phenanthrene-rich mixture at phenanthrene mole fraction xP = 0.90. The Raoult’s law (dotted) and maximum possible system (dashed) vapor pressure curves are shown for reference.
As the relatively high vapor pressure, phenanthrene-rich phase is exhausted from the sample cells in the experiments of figures 4 and 5, the vapor pressure gives way to another nearly stable vapor pressure approaching, but slightly higher than that of pure anthracene. These mixtures have a stable vapor pressure of lnP/Pa ≈−4.75 and typically contain between (2.5 and 5) mol% phenanthrene. Interestingly, the mixture composition changes only gradually until all sample material has sublimed from the effusion cells. The vapor pressure of phenanthrene is roughly two orders of magnitude greater than that of anthracene in this temperature range. Hence, if the system were behaving ideally, the composition of the mixture would change significantly trending towards pure anthracene and the vapor pressure would shift accordingly. Thus, these high concentration anthracene mixtures act similarly to solid azeotropes because they exhibit a constant vapor pressure slightly higher than that of pure anthracene. It must be kept in mind, however, that this does not represent true azeotropy because the mixture concentrations do, in fact, change slightly during sublimation. This behavior is similar to that observed in other PAH mixtures [2,4].
The mixture initially at xP = 0.90 is itself azeotrope-like since it is composed entirely of the phenanthrene-rich phase and sublimes at nearly constant vapor pressure and composition. This is in stark contrast to the mixtures between xP = (0.30 and 0.70), for which the composition changed significantly as phenanthrene was preferentially lost from the system. After the phenanthrene-rich mixtures initially at xP = 0.90 lose 76% of sample mass, their composition is still at xP = 0.86. This is much higher than that predicted by Raoult’s law, which predicts a composition of xP = 0.61 after 76% mass loss (not shown in figure 5). Thus, a mixture at xP = 0.90 contains essentially a single phase, behaving like a single component.
4. Conclusions
The (anthracene + phenanthrene) system is complicated and non-ideal. The melting and solidification behavior, microstructure, and vapor pressure of (anthracene + phenanthrene) mixtures indicate that the binary PAH system forms a lower-melting, phenanthrene-rich phase (or phases), and that this phase coexists with a higher-melting, anthracene-rich phase when xP ≤0.80. The phenanthrene-rich phase has an equilibrium vapor pressure of roughly lnP/Pa = −2.38 and an initial melting temperature of 372 K, which is identical to the melting temperature of pure phenanthrene. In stark contrast to other non-ideal binary PAH systems studied in this laboratory [1,2], mixtures of (anthracene + phenanthrene) do not form a eutectic phase. Rather, the mixtures all begin to melt at a thaw temperature equal to the melting temperature of pure phenanthrene. With respect to vapor pressure, (anthracene + phenanthrene) mixtures initially at xP = 0.90 are azeotrope-like because they consist entirely of the phenanthrenerich phase and sublime at nearly constant vapor pressure and composition. Quasi-azeotropy was also observed for very high-content anthracene mixtures (2.5 < xP < 5), indicating that anthracene may accommodate very low levels of phenanthrene in its crystal structure and not that the mixture is behaving as a true azeotrope.
Supplementary Material
Acknowledgments
This publication was made possible by grant number P42ES013660 from the National Institute of Environmental Health Sciences (NIEHS), NIH, and the contents are solely the responsibility of the authors and do not necessarily represent the official views of the NIEHS, NIH.
Appendix A. Supplementary data
Supplementary data associated with this article can be found, in the online version, at http://dx.doi.org/10.1016/j.jct.2015.06.021.
References
- 1.Rice JW, Fu J, Suuberg EM. J Chem Eng Data. 2010;55:3598–3605. doi: 10.1021/je100208e. [DOI] [PMC free article] [PubMed] [Google Scholar]
- 2.Rice JW, Suuberg EM. J Chem Thermodyn. 2010;42:1356–1360. doi: 10.1016/j.jct.2010.05.019. [DOI] [PMC free article] [PubMed] [Google Scholar]
- 3.Fu J, Rice JW, Suuberg EM. Fluid Phase Equilib. 2010;298:219–224. doi: 10.1016/j.fluid.2010.07.023. [DOI] [PMC free article] [PubMed] [Google Scholar]
- 4.Rice JW, Fu J, Suuberg EM. Ind Eng Chem Res. 2011;50:3613–3620. doi: 10.1021/ie102325d. [DOI] [PMC free article] [PubMed] [Google Scholar]
- 5.Das SS, Singh NP, Agrawal T, Gupta P, Tiwari SN, Singh NB. Mol Cryst Liq Cryst. 2009;501:107–124. [Google Scholar]
- 6.Gupta RK, Singh RA. J Cryst Growth. 2004;267:340–347. [Google Scholar]
- 7.Gupta RK, Singh SK, Singh RA. J Cryst Growth. 2007;300:415–420. [Google Scholar]
- 8.Rai RN, Varma KBR. Mater Lett. 2000;44:284–293. [Google Scholar]
- 9.Rastogi RP, Rama Varma KT. J Chem Soc. 1956:2097–2101. [Google Scholar]
- 10.Rastogi RP, Bassi PS. J Phys Chem. 1964;68:2398–2406. [Google Scholar]
- 11.Singh NB, Giri DP, Singh NP. J Chem Eng Data. 1999;44:605–607. [Google Scholar]
- 12.Singh NB, Srivastava MA, Singh NP. J Chem Eng Data. 2001;46:47–50. [Google Scholar]
- 13.Singh NB, Srivastava A, Singh NP, Gupta A. Mol Cryst Liq Cryst. 2007;474:43–54. [Google Scholar]
- 14.Singh NB, Das SS, Singh NP, Agrawal T. J Cryst Growth. 2008;310:2878–2884. [Google Scholar]
- 15.Szczepanik R. Chem Stosowana Ser A. 1963;7:621–660. [Google Scholar]
- 16.Szczepanik R, Skalmowski W. Bitumen Teere Asphalte Peche. 1963;14:506,508–512,514. [Google Scholar]
- 17.Brady MX, Smith NO. Can J Chem. 1967;45:1125–1134. [Google Scholar]
- 18.Bradley G, Marsh JK. J Chem Soc. 1933:650–652. [Google Scholar]
- 19.Kravchenko FM, Eremenko AP. J Appl Chem USSR English Trans. 1952;25:737. [Google Scholar]
- 20.Knudsen M. The Kinetic Theory of Gasses. Methuen & Co; London: 1934. [Google Scholar]
- 21.Oja V, Suuberg EM. Anal Chem. 1997;69:4619–4626. [Google Scholar]
- 22.Semivolatile Organic Compounds by Gas Chromatography/Mass Spectrometry (GC-MS), Environmental Applications Manual. Varian Inc; Palo Alto, CA: 2001–2004. pp. 1–29. [Google Scholar]
- 23.Domalski ES, Hearing ED. J Phys Chem Ref Data. 1996;25:1–525. [Google Scholar]
- 24.Roux MV, Temprado M, Chickos JS, Nagano Y. J Phys Chem Ref Data. 2008;37:1855–1996. [Google Scholar]
- 25.Goldfarb JL, Suuberg EM. J Chem Eng Data. 2008;53:670–676. [Google Scholar]
- 26.Oja V, Suuberg EM. J Chem Eng Data. 1998;43:486–496. [Google Scholar]
- 27.Bender R, Bieling V, Maurer G. J Chem Thermodyn. 1983;15:585–594. [Google Scholar]
- 28.Bidleman TF. Anal Chem. 1984;56:2490–2496. doi: 10.1021/ac00277a051. [DOI] [PubMed] [Google Scholar]
- 29.Bradley RS, Cleasby TG. J Chem Soc. 1953;2:1690–1692. [Google Scholar]
- 30.De Kruif CG. J Chem Thermodyn. 1980;12:243–248. [Google Scholar]
- 31.Hansen PC, Eckert CA. J Chem Eng Data. 1986;31:1–3. [Google Scholar]
- 32.Inokuchi H, Shiba S, Handa T, Akamatu H. Bull Chem Soc Jpn. 1952;25:299–302. [Google Scholar]
- 33.Kelley JD, Rice FO. J Phys Chem. 1964;68:3794–3796. [Google Scholar]
- 34.Macknick AB, Prausnitz JM. J Chem Eng Data. 1979;24:175–178. [Google Scholar]
- 35.Nass K, Lenoir D, Kettrup A. Angew Chem Int Ed Engl. 1995;34:1735–1736. [Google Scholar]
- 36.Sato N, Inomata H, Arai K, Saito S. J Chem Eng Jpn. 1986;19:145–147. [Google Scholar]
- 37.Sonnefeld WJ, Zoller WH, May WE. Anal Chem. 1983;55:275–280. [Google Scholar]
Associated Data
This section collects any data citations, data availability statements, or supplementary materials included in this article.