Abstract
Purpose
To compare measurements of corneal thickness (CT) and epithelial thickness (ET) in maps obtained by the RTVue spectral domain optical coherence tomography (SD-OCT) system with those obtained from the Artemis 2 immersion arc-scanning very high-frequency ultrasound system.
Setting
Department of Ophthalmology of the Columbia University Medical Center
Design
A method-comparison study design to examine the agreement between two systems for measurement and mapping of CT and ET.
Methods
Both eyes of 12 normal volunteers were scanned with RTVue followed by Artemis and then by repeated RTVue. For each map, the minimum CT and mean values of CT and ET in the 3 mm radius zone and in 0.5 mm-wide concentric annuli of up to 3 mm radius around the corneal vertex were determined.
Results
The CT values from both devices were highly correlated and in the 3-mm radius zone (R>0.96) they were not statistically significantly different. There was no statistically significant change in ET or CT in RTVue measurements made before versus after immersion ultrasound. While highly correlated (R>0.76), RTVue ET values were systematically thinner (1.7 ± 2.1 µm) than Artemis 2 measurements (p<0.01) in the 3 mm radius zone.
Conclusions
Artemis and RTVue CT measurements in the 3 mm radius zone are equivalent in normal eyes. While correlated, Artemis ET measurements were systemically thicker than RTVue values.
INTRODUCTION
The corneal epithelium serves as a barrier to the outside environment and, in concert with the tear film, plays an important role in the refractive power of the eye.1
In 1994, Reinstein et al.2 demonstrated that color maps representing the thickness of the cornea, epithelium and stroma could be generated from very high frequency ultrasound (VHFUS) scans. Reinstein et al.3 also showed that the epithelium remodels to smooth out underlying stromal surface irregularities following alteration in corneal refractive surgery, where the epithelial thickens to compensate for stromal ablation, and in keratoconus, where the epithelium compensates for stromal bulging by thinning over the apex and thickening in a surrounding annulus.4 We have shown that epithelial thickness (ET) maps allow distinction between normal and keratoconic corneas.5
VHF-US was the sole means to obtain ET maps until the recent development of high resolution anterior segment spectral domain optical coherence tomography (SD-OCT) systems.6,7 SD-OCT-based ET mapping has also demonstrated distinctly different patterns between normal and keratoconic corneas.8–10 Recent preliminary studies have shown ET maps to be a possible objective indicator in the assessment of Dry-Eye Syndrome.11
In this report, we compare measurements of corneal and epithelial thickness made with VHF-US and SD-OCT.
PATIENTS AND METHODS
Both eyes of 12 normal subjects were imaged using RTVue SD-OCT (Optovue, Inc., Fremont, CA) and Artemis 2 VHF-US system (ArcScan, Inc., Morrison, CO) after receiving local institutional review board approval and individual consent. None of the subjects had a diagnosis of corneal disease or any prior corneal surgery. The subjects were imaged with RTVue twice, once before and once after being imaged by the Artemis. All imaging was performed by two users (RU and RHS)
RTVue
RTVue’s pachymetry protocol was employed to obtain corneal scans. In this protocol the RTVue acquires 5 sets of 8 meridional scans at 22.5° intervals, each of 9-mm length to produce after interpolation 90×90 corneal thickness (CT) and ET maps with a lateral resolution of 100µm. Scans were obtained twice, two sets pre- and two post-Artemis 2 immersion ultrasound scanning to examine the effect, if any, of immersion. Scans were centered on the corneal vertex, the position of which was determined by the presence of a saturated, specular reflection.
Artemis 2
Artemis scans are obtained with the patient in a seated position. A disposable eyepiece allows normal saline fluid coupling between the transducer (center frequency of 38 MHz) and the eye. During scanning, a fixation light is provided and the eye surface is visualized by a video camera. Arc-scans approximately matched to the cornea’s radius of curvature are acquired along a series of meridians to form a scan set. Each scan consists of 256 vectors over a 70° arc with each vector consisting of 2048 8-bit axial samples acquired at 500 MSamples/second). Artemis scans were acquired in approximately 5 minutes per eye. Scans were centered on the corneal vertex, the position of which was determined by the presence of a maximized echo resulting from normal incidence of the ultrasound beam relative to the corneal surface.
In this study, we acquired two sets of 6 meridional scans at 30° intervals. Scans were processed with ArtPro software, which analyzes the phase-resolved radiofrequency echo data to automatically detect the spatial positions of the anterior and posterior corneal surfaces and Bowman layer, to produce after interpolation 120×120 CT and ET maps with a lateral resolution of 100µm.
Statistical Analysis
The thickness maps from RTVue and Artemis were exported for post-processing in MATLAB Version 8.2 (MathWorks Inc, Natick Massachusetts). The SD-OCT and VHF-US maps were co-registered by aligning them at the thinnest location of the cornea in the SD-OCT pachymetry map obtained before immersion scanning. For each CT map, the minimum CT, mean CT in the 3 mm radius zone and mean CT in 0.5 mm-wide annuli of up to 3 mm radius around the corneal vertex were determined. From the ET maps, the value of ET at the location of the minimum CT, mean ET in the 3 mm radius zone and mean ET in 0.5 mm-wide annuli around the corneal vertex were determined. Pearson correlation (R) and paired, two-tailed t-tests were conducted at every point on the map to compare Artemis 2 measurements to RTVue measurements. Mean R-values and p-values were determined in the 3 mm radius zone and in the 0.5 mm-wide annuli rings. Bland-Altman plots were generated for all thickness values. We also compared RTVue maps acquired before and immediately after immersion ultrasound.
RESULTS
RTVue measurements obtained before and after immersion scanning were found to be well correlated (R>0.82 for ET maps and R>0.99 for CT maps) in the 3mm radius zone and differences were statistically not significant. Consequently we present results comparing Artemis 2 to RTVue scans obtained before immersion scanning.
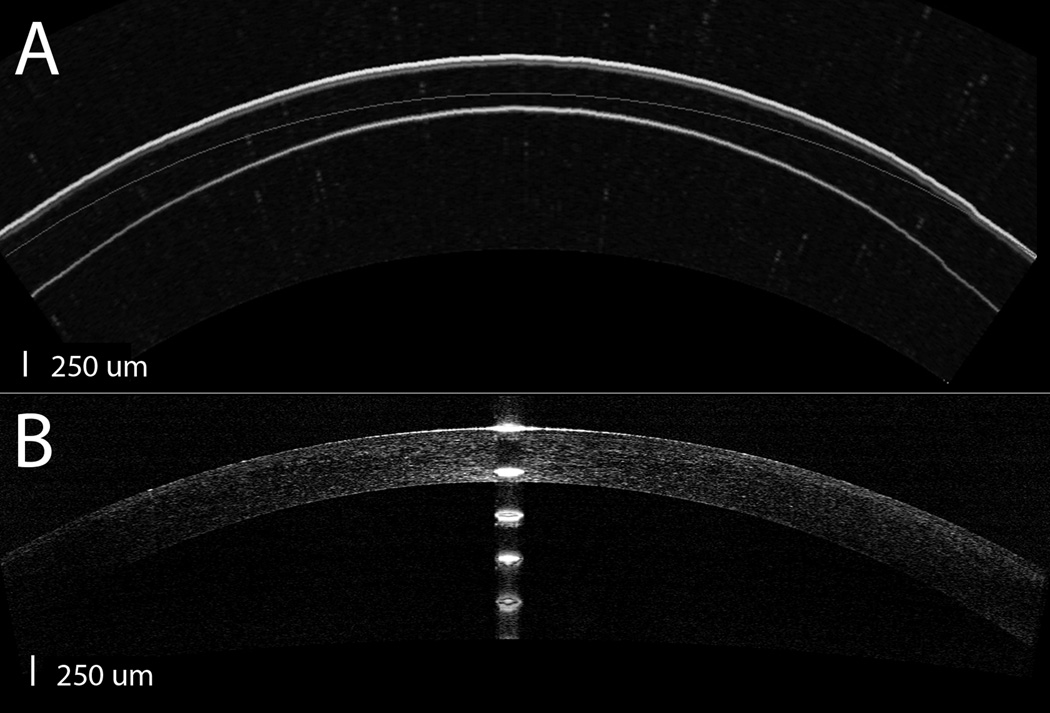
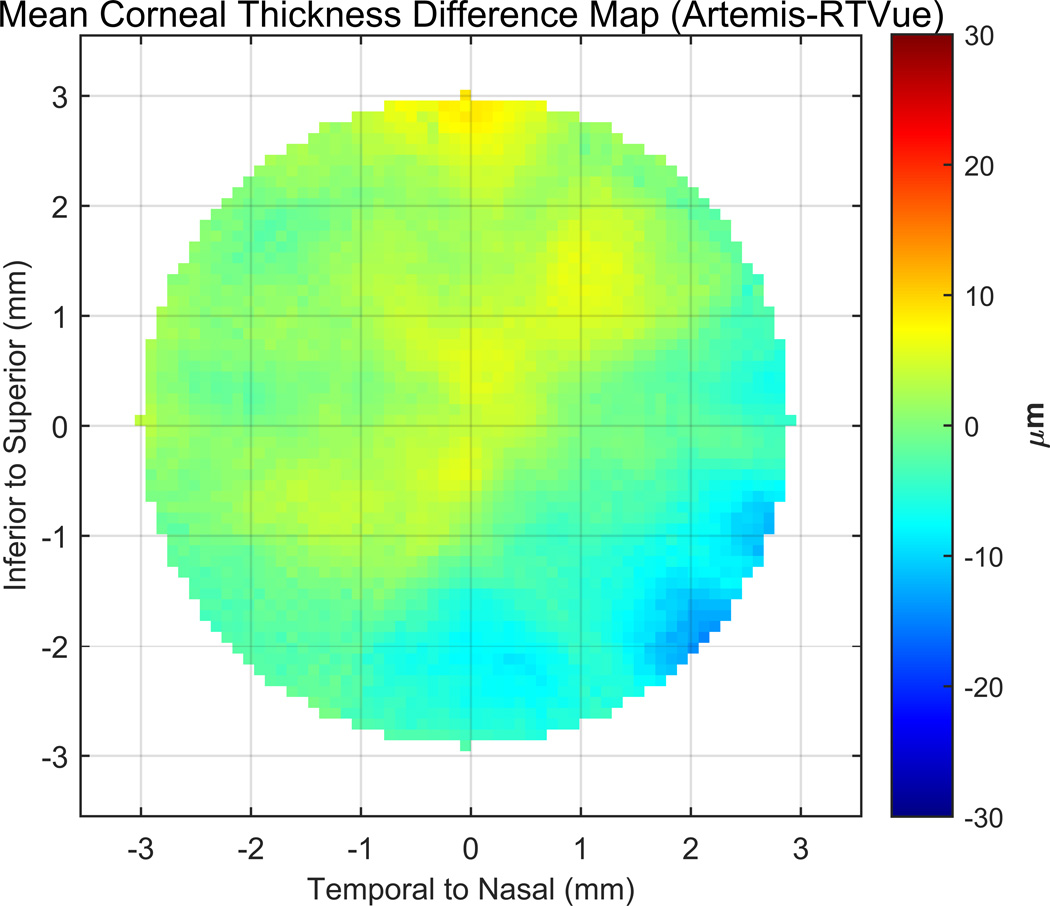
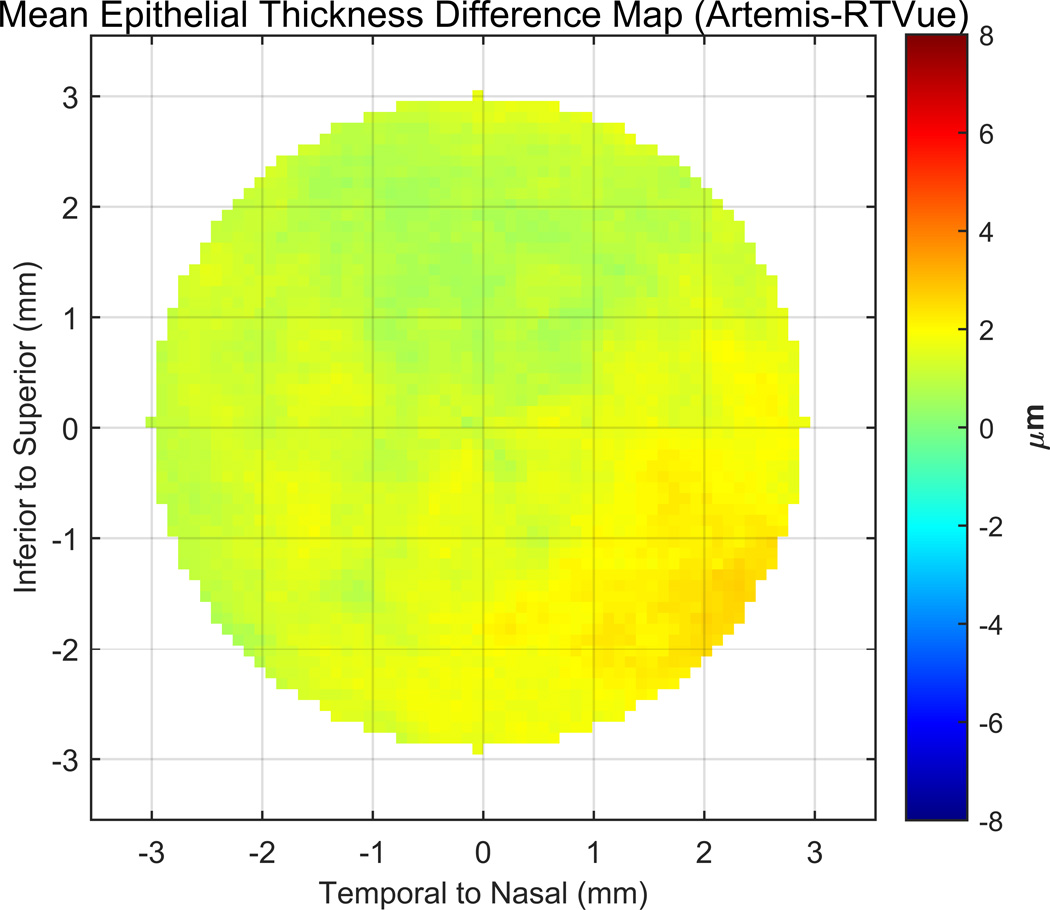
Figures 1a and 1b show representative pre-processed source images from Artemis and RTVue. Figures 2a and 2b show the mean difference between Artemis and RTVue CT and ET maps. Table 1 shows the mean values, their differences, R- and p-values for CT and ET measurements from the two instruments at the location of minimum corneal thickness (MinT), in the 3 mm radius zone (MM3) and in the six concentric 0.5 mm-wide annuli. The data are presented graphically in Figures 3a and 3b. Pearson correlation tests indicated that OCT and VHF-US measurements were highly correlated (R>0.76 for ET Maps and R>0.96 for CT Maps) in the 3mm radius zone. T-tests showed that there were no statistically significant differences in CT measurements between methods. However, the ET measurements were statistically significantly different (p<0.01).
Figure 1.
Representative pre-processed source images displayed by (a) Artemis and (b) RTVue. The Artemis scan is 10 mm wide and the RTVue scan is 9mm wide.
Figure 2.
Maps showing mean difference between Artemis and RTVue in (a) corneal thickness (CT) and (b) epithelial thickness (ET).
Figure 3.
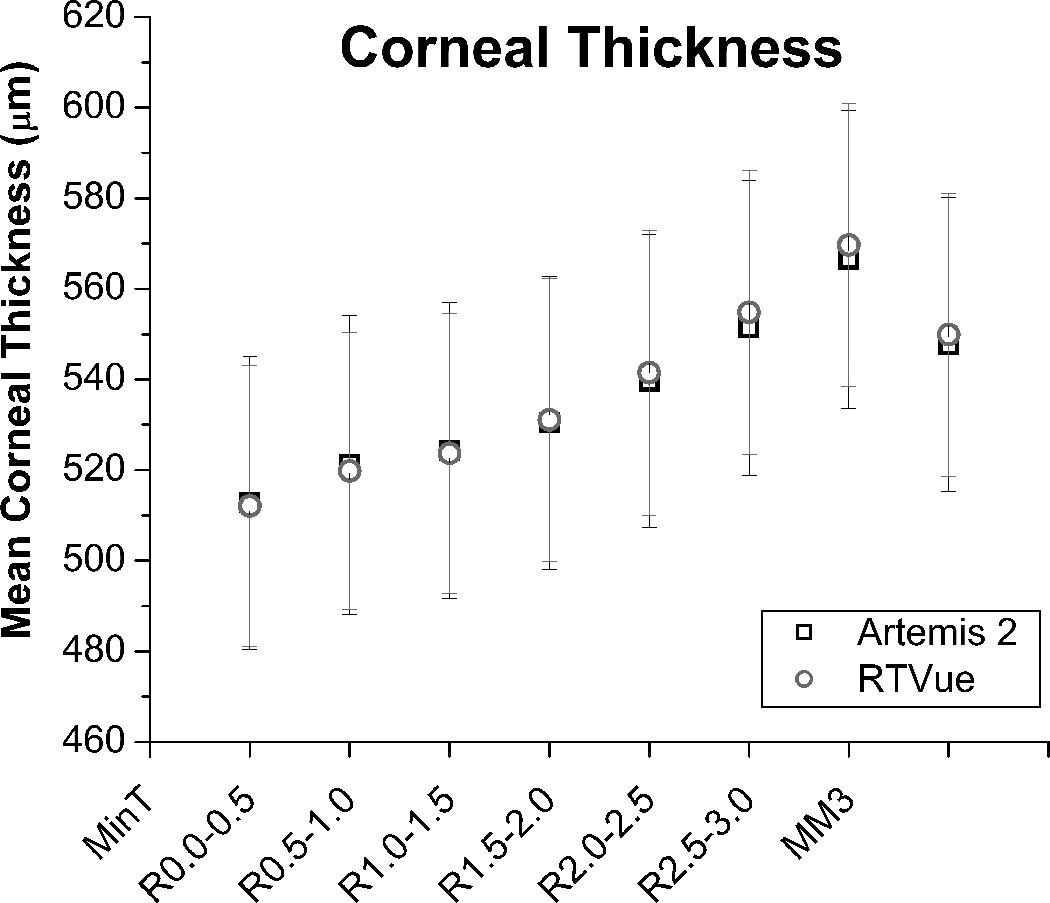
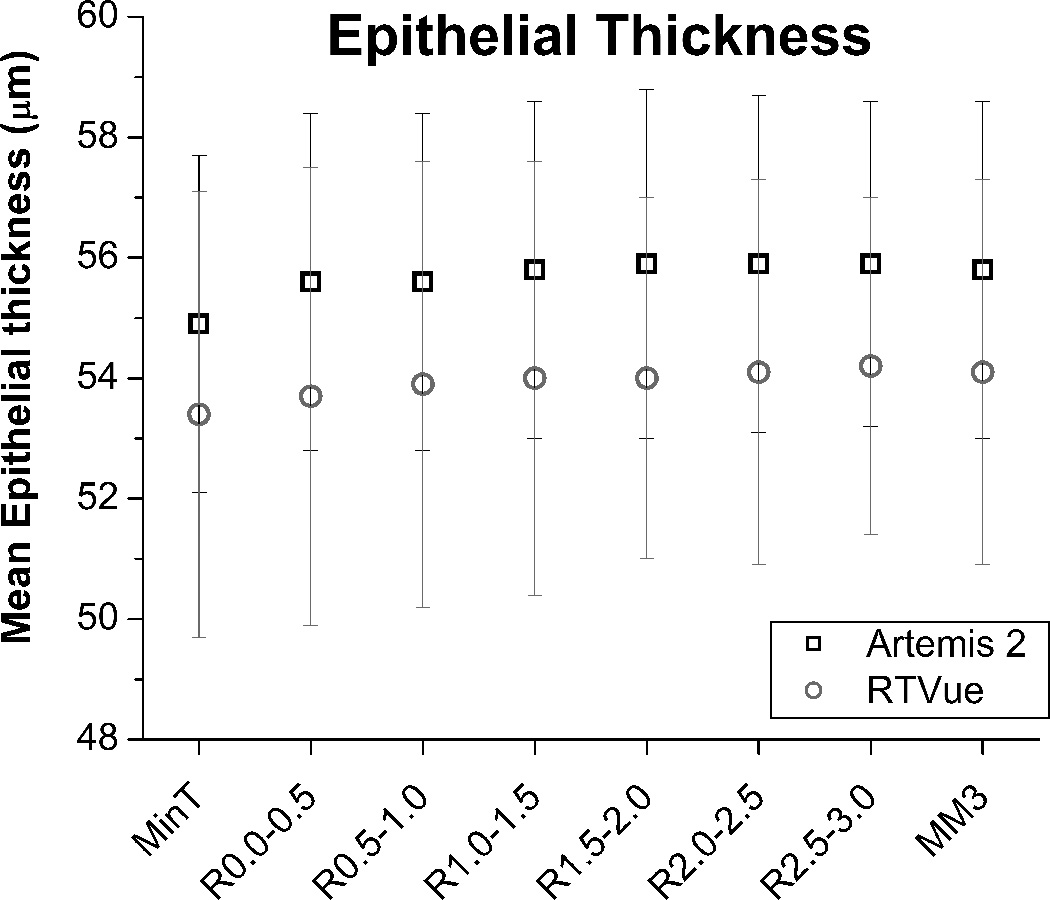
Mean (a) corneal and (b) epithelial thickness values obtained from Artemis and RTVue at the location of minimum corneal thickness (MinT), in the six concentric 0.5 mm-wide annuli centered at the corneal vertex and in the 3 mm radius zone (MM3)
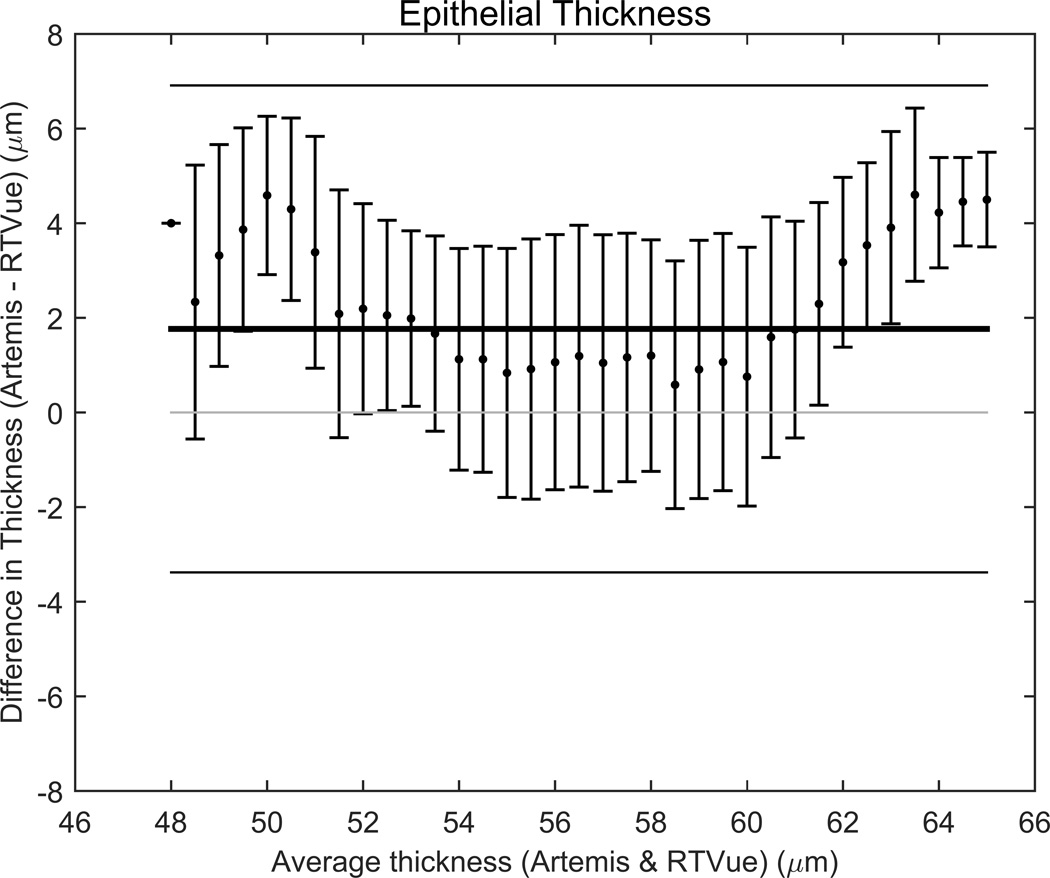
Figure 4 shows the difference in Artemis and RTVue ET as a function of their average value for all points on all eyes. Below the mean ET value of 58 µm, there was a modest decrease in the difference, as thickness increased. But for thicker values, the difference increased with mean ET.
Figure 4.
Plot of mean difference ±1 SD between Artemis and RTVue epithelial thickness values as a function of mean epithelial thickness at all pixel positions in all maps.
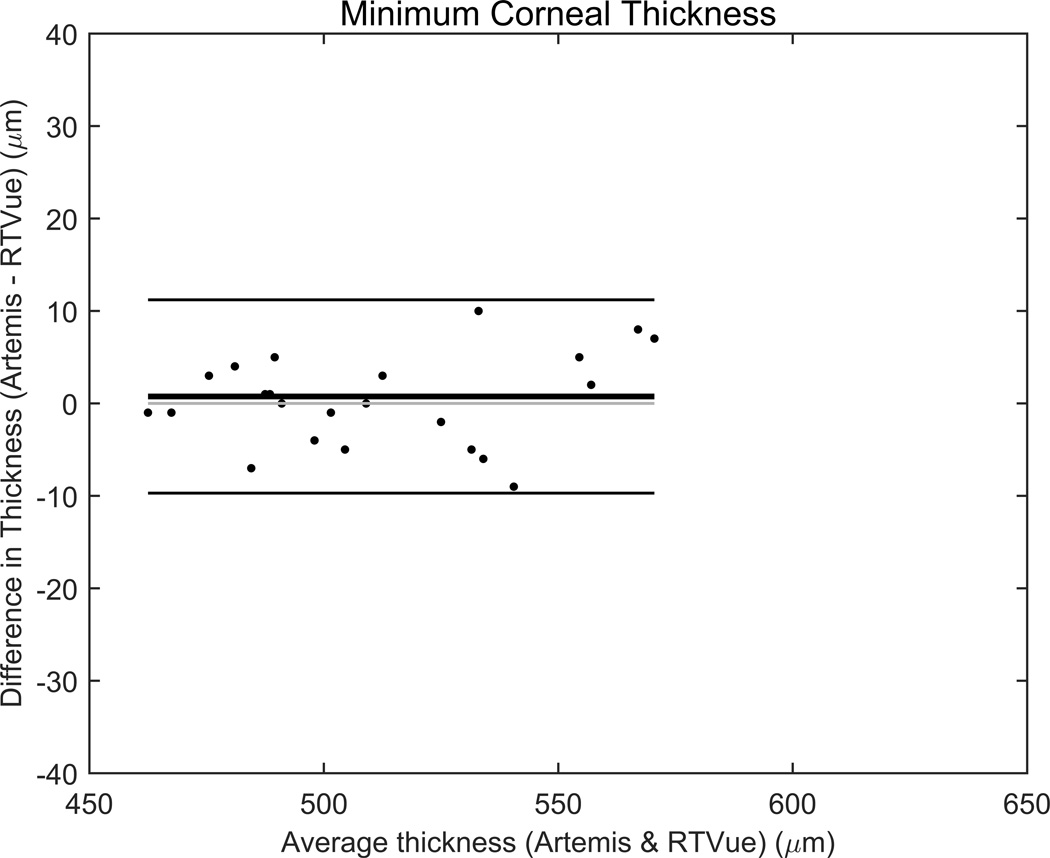
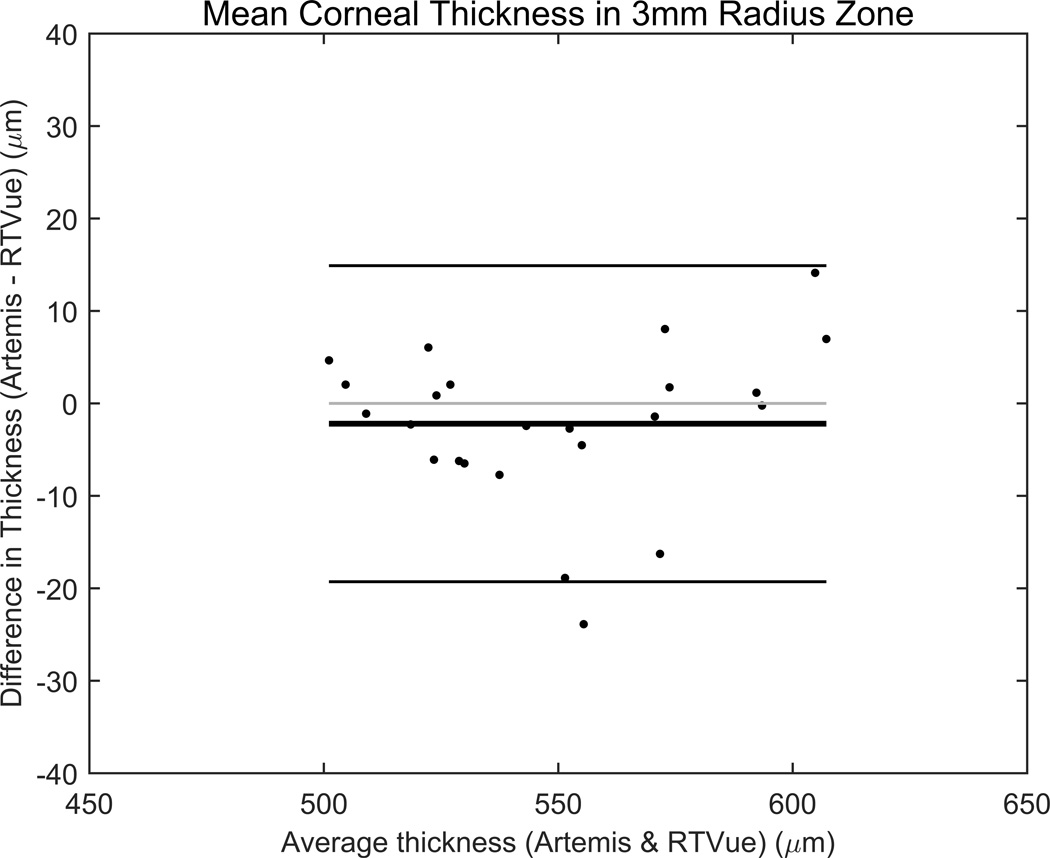
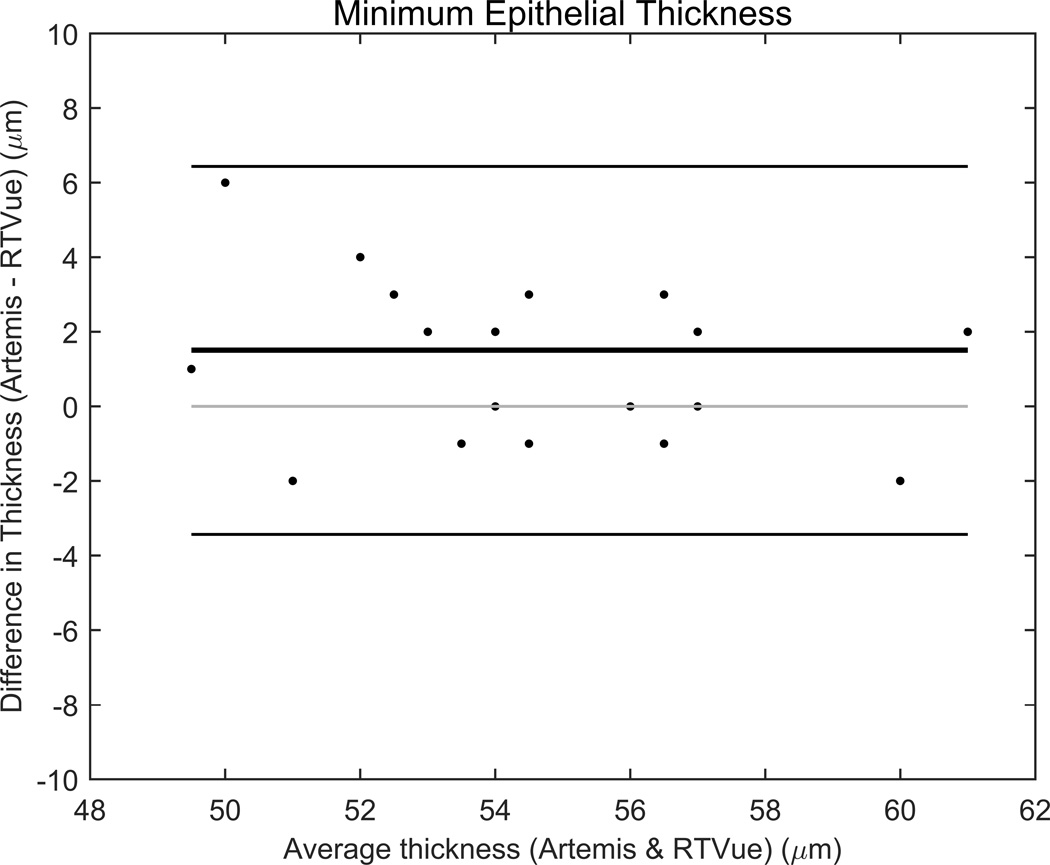
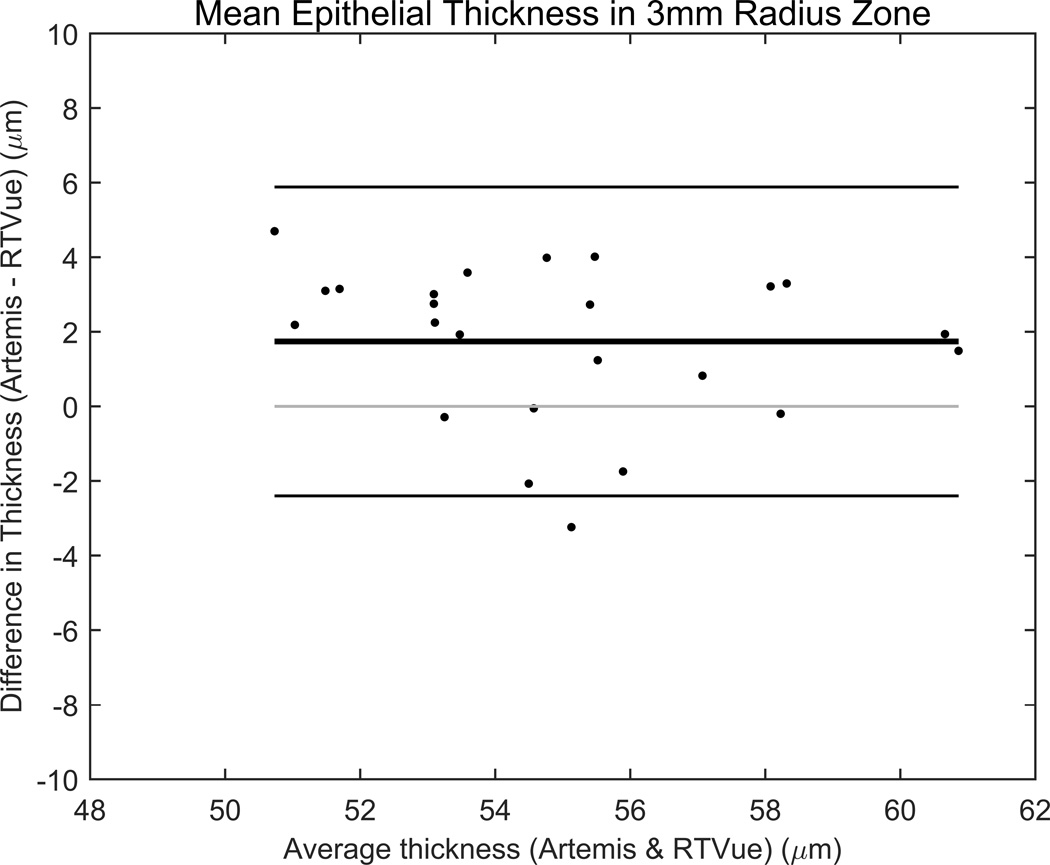
Bland-Altman plots comparing the corneal and epithelial measurements from the two devices are presented in Figures 5 and 6. The results demonstrate systematic differences between instruments in ET measurements. In the 3mm radius zone, RTVue ET measurements were on average thinner than Artemis 2 measurements by 1.7±2.1 µm.
Figure 5.
Bland-Altman plots comparing the corneal thickness measurements from Artemis and RTVue (a) at the location of minimum corneal thickness and (b) in the 3 mm radius zone. The bold line is the mean difference, the regular weight line is 2 standard deviations, and the light grey line is the zero reference.
Figure 6.
Bland-Altman plots comparing the epithelial thickness measurements from Artemis and RTVue (a) at the location of minimum corneal thickness and (b) in the 3 mm radius zone. The bold line is the mean difference, the regular weight line is 2 standard deviations, and the light grey line is the zero reference.
DISCUSSION
In this report, we compared ET and CT maps generated by OCT using RTVue and VHFUS using Artemis-2. We found that RTVue and Artemis CT maps were highly correlated and did not differ significantly statistically. At the thinnest location, the average difference was less than 1 µm and never exceeded 4 µm at up to 3 mm from the center. This finding contrasts with a previous study by our group comparing Artemis-2 with the time-domain Visante anterior segment OCT, where Artemis-2 values of CT were significantly thicker (8 µm centrally) than those obtained with the Visante, with the difference increasing with distance from the center.12 These results suggest that the Visante dewarping algorithm, compensating for optical refraction, may have been imperfect.. On the other hand, Piñero et al.13 reported no significant difference between Artemis-2 and Visante central CT. However, in this case Artemis-2 measurements were obtained by manual placement of calipers on images, which is less precise than the automated signal processing analysis using ArtPro employed in our studies.
The correlation between RTVue and Artemis CT measurements declined towards the periphery, and this can be attributed to the increasing distance between successive scan planes with distance from the center. At the edge of the 8-mm diameter zone, Artemis scan planes are 2.1 mm apart and RTVue planes are 1.6 mm apart, requiring extensive interpolation between planes at the periphery to produce contiguous maps.
While strongly correlated, ET thickness values derived from RTVue and Artemis-2 did differ systematically, with Artemis values averaging 1.5 µm thicker at the thinnest location and the difference increasing to 1.8 µm with distance from the center. This is a surprising result, in that we would have expected RTVue, which incorporates the tear film in ET measurement, to produce thicker ET values. In the case of ultrasound, the tear film is eliminated because a fluid coupling medium is used.
There are several possible explanations of the above discrepancy. A prime consideration is the unknown speed of sound in the epithelium. The Artemis calculation of ET applies the same speed of sound constant used for the cornea as a whole, 1640 m/s. This value is quite high compared to most soft tissues, and it is quite possible that the speed of sound in the epithelium is slower. Given the difference of 2–3% between RTVue and Artemis in ET values, an epithelial speed of sound of about 1590 m/s would correct the observed error, however, an even lower speed of sound would be required if the contribution of the tear film to OCT ET values is considered.
Ambiguity regarding the point of measurement at the epithelial/Bowman’s interface may also contribute to the observed difference. The RTVue, with a resolution of about 5 µm can just resolve the approximately 10 µm thick Bowman layer and the biometric algorithm picks the peak value of the Bowman reflection as the posterior limit of the epithelium in ET determination. With an axial resolution of about 30 µm, the Artemis cannot resolve Bowman layer. The anterior surface of Bowman layer, however, produces a much larger ultrasound reflection than the Bowman/stromal interface.14 Nevertheless, phase interference between reflections from the unresolved surfaces might result in the point of peak reflection occurring within rather than at the surface of Bowman, resulting in a small systematic overestimate of ET.
The finding that there was no difference between the OCT scans obtained before and after VHF-US immersion scanning agreed with a previous study that showed no change in epithelial thickness measured by VHF-US over a 5 minute period under immersion conditions.15 This finding is also in agreement with early work by Maurice, who demonstrated that the epithelial thickness did not change for concentrations between 0.9% and 2.7% NaCl solution.16
While the present study compared the RTVue SD-OCT system with the Artemis, other commercial anterior segment SD-OCTs operating at a similar wavelength and bandwidth as RTVue would be expected to have similar performance in respect to the physics of optical scattering and reflection. However, differences in processing algorithms between instruments could potentially influence measurements.
Ultrahigh resolution prototype SD-OCTs, have been developed that allow distinction between the tear film and epithelium and this might allow the present ambiguity in the relative contributions of tear film and epithelium to OCT-determined epithelial thickness to be addressed.17,18
In conclusion, we found excellent correspondence between RTVue OCT and Artemis-2 VHF-US maps of corneal and epithelial thickness, although OCT measurements of ET were about 2% thinner than VHF-US measurements.
WHAT WAS KNOWN
Artemis-2 VHF-US values of CT were significantly thicker that those obtained with the Visante Time-Domain OCT centrally, with the difference increasing with distance from the center.
WHAT WAS ADDED
CT maps obtained from Artemis-2-VHF-US and RTVue SD-OCT were highly correlated and were not statistically different.
ET maps obtained from Artemis-2 VHF-US and RTVue SD-OCT were highly correlated, but were statistically different with Artemis-2 values being systematically thicker than RTVue by 1.7 µm
Acknowledgments
Support: Supported in part by NIH grants EY019055, P30 EY019007 and an unrestricted grant to the Department of Ophthalmology of Columbia University from Research to Prevent Blindness.
Dr Reinstein is also a consultant for Carl Zeiss Meditec.
Biography

Footnotes
Publisher's Disclaimer: This is a PDF file of an unedited manuscript that has been accepted for publication. As a service to our customers we are providing this early version of the manuscript. The manuscript will undergo copyediting, typesetting, and review of the resulting proof before it is published in its final citable form. Please note that during the production process errors may be discovered which could affect the content, and all legal disclaimers that apply to the journal pertain.
Financial Disclosures: Drs. Silverman and Reinstein have a commercial interest in Arcscan, Inc. The remaining authors have no financial interest in the materials presented herein.
REFERENCES
- 1.Del Monte DW, Kim T. Anatomy and physiology of the cornea. J Cataract Refract Surg. 2011;37:588–598. doi: 10.1016/j.jcrs.2010.12.037. [DOI] [PubMed] [Google Scholar]
- 2.Reinstein DZ, Silverman RH, Trokel SL, Coleman DJ. Corneal pachymetric topography. Ophthalmology. 1994;101:432–438. doi: 10.1016/s0161-6420(94)31314-5. [DOI] [PubMed] [Google Scholar]
- 3.Reinstein DZ, Silverman RH, Sutton HFS, Coleman DJ. Very high-frequency ultrasound corneal analysis identifies anatomic correlates of optical complications of lamellar refractive surgery; anatomic diagnosis in lamellar surgery. Ophthalmology. 1999;106:474–482. doi: 10.1016/S0161-6420(99)90105-7. [DOI] [PubMed] [Google Scholar]
- 4.Reinstein DZ, Archer TJ, Gobbe M. Corneal epithelial thickness profile in the diagnosis of keratoconus. J Refract Surg. 2009;25:604–610. doi: 10.3928/1081597X-20090610-06. [DOI] [PubMed] [Google Scholar]
- 5.RoyChoudhury A, Archer TJ, Gobbe M, Reinstein DZ. Epithelial remodeling as basis for machine-based identification of keratoconus. [Accessed October 1, 2015];Invest Ophthalmol Vis Sci. 2014 55:1580–1587. doi: 10.1167/iovs.13-12578. Available at: http://www.ncbi.nlm.nih.gov/pmc/articles/PMC3954156/pdf/i1552-5783-55-3-1580.pdf. [DOI] [PMC free article] [PubMed] [Google Scholar]
- 6.Haque S, Simpson T, Jones L. Corneal and epithelial thickness in keratoconus: a comparison of ultrasonic pachymetry, Orbscan II, and optical coherence tomography. J Refract Surg. 2006;22:486–493. doi: 10.3928/1081-597X-20060501-11. [DOI] [PubMed] [Google Scholar]
- 7.Prakash G, Agarwal A, Jacob S, Kumar DA, Agarwal A, Banerjee R. Comparison of Fourierdomain and time-domain optical coherence tomography for assessment of corneal thickness and intersession repeatability. Am J Ophthalmol. 2009;148:282–290. doi: 10.1016/j.ajo.2009.03.012. [DOI] [PubMed] [Google Scholar]
- 8.Sandali O, El Sanharawi M, Temstet C, Hamiche T, Galan A, Ghouali W, Goemaere I, Basli E, Borderie V, Laroche L. Fourier-domain optical coherence tomography imaging in keratoconus; a corneal structural classification. Ophthalmology. 2013;120:2403–2412. doi: 10.1016/j.ophtha.2013.05.027. [DOI] [PubMed] [Google Scholar]
- 9.Rocha KM, Perez-Straziota CE, Stulting RD, Randleman JB. SD-OCT analysis of regional epithelial thickness profiles in keratoconus, postoperative corneal ectasia, and normal eyes. J Refract Surg. 2013;29:173–179. doi: 10.3928/1081597X-20130129-08. errata, 234. [DOI] [PMC free article] [PubMed] [Google Scholar]
- 10.Li Y, Tan O, Brass R, Weiss JL, Huang D. Corneal epithelial thickness mapping by Fourier-domain optical coherence tomography in normal and keratoconic eyes. [Accessed October 1, 2015];Ophthalmology. 2012 119:2425–2433. doi: 10.1016/j.ophtha.2012.06.023. Available at: http://www.ncbi.nlm.nih.gov/pmc/articles/PMC3514625/pdf/nihms389040.pdf. [DOI] [PMC free article] [PubMed] [Google Scholar]
- 11.Kanellopoulos AJ, Asimellis G. In vivo 3-dimensional corneal epithelial thickness mapping as an indicator of dry eye: preliminary clinical assessment. Am J Ophthalmol. 2014;157:63–68. doi: 10.1016/j.ajo.2013.08.025. [DOI] [PubMed] [Google Scholar]
- 12.Ursea R, Feng M, Urs R, RoyChoudhury A, Silverman RH. Comparison of Artemis-2 ultrasound and Visante optical coherence tomography corneal thickness profiles. [Accessed October 1, 2015];J Refract Surg. 2013 29:36–41. doi: 10.3928/1081597X-20121126-01. Available at: http://www.ncbi.nlm.nih.gov/pmc/articles/PMC3684006/pdf/nihms-481451.pdf. [DOI] [PMC free article] [PubMed] [Google Scholar]
- 13.Piñero DP, Plaza AB, Alió JL. Anterior segment biometry with 2 imaging technologies: very-high-frequency ultrasound scanning versus optical coherence tomography. J Cataract Refract Surg. 2008;34:95–102. doi: 10.1016/j.jcrs.2007.08.033. [DOI] [PubMed] [Google Scholar]
- 14.Reinstein DZ, Silverman RH, Coleman DJ. High-frequency ultrasound measurement of the thickness of the corneal epithelium. Refract Corneal Surg. 1993;9:385–387. [PubMed] [Google Scholar]
- 15.Reinstein DZ, Archer TJ, Gobbe M. Stability of epithelial thickness during 5 minutes immersion in 33°C 0.9% saline using very high-frequency digital ultrasound [letter] [Accessed October 1, 2015];J Refract Surg. 2012 28:606–607. doi: 10.3928/1081597X-20120815-03. Available at: http://www.healio.com/ophthalmology/journals/jrs/2012-9-28-9/%7B71fd7214-c63c-4128-975c-2cbfeb88a9a4%7D/stability-of-epithelial-thickness-during-5-minutes-immersion-in-33c-09-saline-using-very-high-frequency-digital-ultrasound.pdf. [DOI] [PubMed] [Google Scholar]
- 16.Maurice DM. Influence on corneal permeability of bathing with solutions of differing reaction and tonicity. [Accessed October 1, 2015];Br J Ophthalmol. 1955 39:463–473. doi: 10.1136/bjo.39.8.463. Available at: http://www.ncbi.nlm.nih.gov/pmc/articles/PMC1324582/pdf/brjopthal01120-0017.pdf. [DOI] [PMC free article] [PubMed] [Google Scholar]
- 17.Werkmeister RM, Alex A, Kaya S, Unterhuber A, Hofer B, Riedl J, Bronhagl M, Vietauer M, Schmidl D, Schmoll T, Garhöfer G, Drexler W, Leitgeb RA, Groeschl M, Schmetterer L. Measurement of tear film thickness using ultrahigh-resolution optical coherence tomography. [Accessed October 1, 2015];Invest Ophthalmol Vis Sci. 2013 54:5578–5583. doi: 10.1167/iovs.13-11920. Available at: http://iovs.arvojournals.org/article.aspx?articleid=2128654. [DOI] [PubMed] [Google Scholar]
- 18.Huang J, Yuan Q, Zhang B, Xu K, Tankam P, Clarkson E, Kupinski MA, Hindman HB, Aquavella JV, Suleski TJ, Rolland JP. Measurement of a multi-layered tear film phantom using optical coherence tomography and statistical decision theory. [Accessed October 1, 2015];Biomed Opt Express. 2014 5:4374–4386. doi: 10.1364/BOE.5.004374. Available at: http://www.ncbi.nlm.nih.gov/pmc/articles/PMC4285612/pdf/4374.pdf. [DOI] [PMC free article] [PubMed] [Google Scholar]


