Abstract
In the active cytosine demethylation pathway, 5- methylcytosine (5mC) is oxidized sequentially to 5-hydroxymethylcytosine (5hmC), 5-formylcytosine (5fC), and 5-carboxylcytosine (5caC). Thymine DNA glycosylase (TDG) selectively excises 5fC and 5caC but not cytosine (C), 5mC, and 5hmC. We propose that the electronwithdrawing properties of –CHO and –COOH in 5fC and 5caC increase N3 acidity, leading to weakened hydrogen bonding and reduced base pair stability relative to C, 5mC, and 5hmC, thereby facilitating the selective recognition of 5fC and 5caC by TDG. Through 13C NMR, we measured the pKa at N3 of 5fC as 2.4 and the two pKa’s of 5caC as 2.1 and 4.2. We used isotope-edited IR spectroscopy coupled with density functional theory (DFT) calculations to site-specifically assign the more acidic pKa of 5caC to protonation at N3, indicating that N3 acidity is increased in 5fC and 5caC relative to C. IR and UV melting studies of self-complementary DNA oligomers confirm reduced stability for 5fC-G and 5caC-G base pairs. Furthermore, while the 5fC-G base pair stability is insensitive to pH, the 5caC-G stability is reduced as pH decreases and the carboxyl group is increasingly protonated. Despite suggestions that 5fC and 5caC may exist in rare tautomeric structures which form wobble GC base pairs, our two-dimensional infrared (2D IR) spectroscopy of 5fC and 5caC free nucleosides confirms that both bases are predominantly in the canonical amino-keto form. Taken together, these findings support our model that weakened base pairing ability for 5fC and 5caC in dsDNA contributes to their selective recognition by TDG.
Graphical abstract
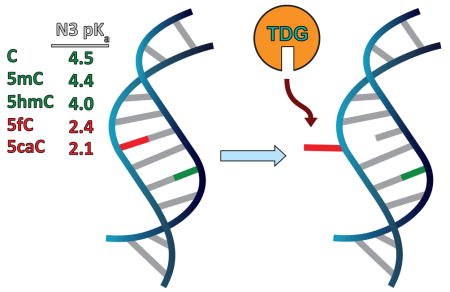
Thymine DNA glycosylase (TDG) is known to recognize and excise the thymine moieties from G–T mismatches in double-stranded DNA (dsDNA) by N-glycosidic bond hydrolysis and to initiate base replacement through the DNA base-excision repair (BER) pathway.1,2 It can also remove uracil and 5-hydroxymethyluracil (5hmU) from mismatches with guanine.3,4 This enzyme plays a central role in cellular defense against genetic mutation caused by the spontaneous deamination of cytosine (C) and 5-methylcytosine (5mC) and helps maintain genome integrity.5
Recently, another major role of TDG has been recognized in epigenetic regulation through an active 5mC demethylation pathway.6,7 Methylation and demethylation at the C5 position of cytosine are critical for transcriptional regulation and genome reprogramming in eukaryotes.6–8 Unlike the well-known methylation pathway, the active demethylation pathway was poorly understood until the recent discovery of sequential oxidation steps by the ten–eleven translocation (TET) family of enzymes.9 TET enzymes can oxidize 5mC to 5-hydroxymethylcytosine (5hmC),10,11 oxidize 5hmC to 5-formylcytosine (5fC), and then oxidize 5fC to 5-carboxylcytosine (5caC) in a stepwise manner.6,9,12,13 TDG can excise 5fC and 5caC from dsDNA to give an abasic site both in vitro14 and in mammalian cells,15–18 and 5fC shows greater activity than 5caC under physiological conditions.14 The abasic site can be replaced by cytosine through downstream BER, completing the active demethylation pathway.7 We have shown through binding affinity studies that TDG preferentially binds 5fC-G and 5caC-G over mismatched T-G and U-G base pairs in duplex DNA despite greater excision activity toward the latter pairs. This observation indicates preferential recognition of 5fC and 5caC by TDG and suggests the need for a more detailed understanding of the properties of 5fC and 5caC and their influence on the DNA duplex.19 We suspect that 5fC-G and 5caC-G base pairs have weakened stability due to their modification, which contributes to their selective flipping by TDG in the genome.
Hashimoto et al. proposed that 5fC/5caC may favor an imino tautomeric state that forces a wobble structure when paired across from G (similar to G-T and G-U mispairs) and thereby facilitates the flipping of 5fC/5caC into the active site of TDG.20 The observation that the TDG catalytic domain binds significantly more weakly to C, 5mC, and 5hmC than to 5fC and 5caC supports the existence of a discrimination step before stable complex formation.19,20
Alternatively, Maiti et al. provided an explanation attributing the TDG specificity to the N-glycosidic bond stability,21 as estimated by the electronic substituent constant (σm) of the C5 substituent22 or the N1 pKa value of the pyrimidine base.23 The observation that the TDG catalytic domain has higher activity toward G-5caC base pairs at pH 5.5 compared to pH 7.5 and 8.0 is consistent with this picture of N-glycosidic bond stability as the origin of TDG activity, but that alone cannot fully account for the activity at neutral or higher pH. In addition, this study does not address whether TDG can flip C, 5mC, or 5hmC into the active site. If TDG does flip each base into the active site and selectivity is due only to N-glycosidic bond stability, then such a recognition process must be inefficient considering the ~3 billion base pair human genome.
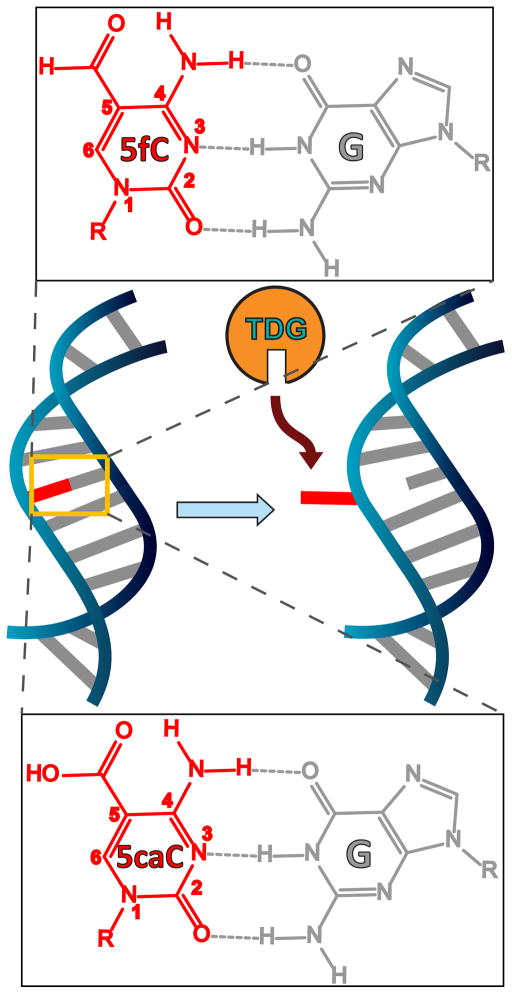
We propose that the electron-withdrawing –CHO and –COOH substituents at C5 in 5fC and 5caC not only decrease the pKa of N1 and weaken the N-glycosidic bond but also decrease the electron density at N3 (and thus the pKa). This would result in weakened hydrogen bonding of the G-5fC and G-5caC base pair and thereby facilitate flipping of 5fC and 5caC for recognition by TDG, Figure 1. To test this hypothesis we measured the N3 pKa values of 5fC and 5caC by 13C NMR and IR spectroscopy. Careful analysis of the data yields an opposite site assignment of the two 5caC pKa values (N3 and COOH) with respect to the previous suggestions,23,24 and we assign the more acidic pKa to N3. Subsequent IR and UV measurement of the stability of modified-cytosine-containing dsDNA oligomers confirmed that 5fC and 5caC oligomers are destabilized with respect to the unmodified oligomer with 5caC-oligomer stability being pH-dependent. These findings provide a chemical basis for distinguishing 5fC and 5caC from C, 5mC, and 5hmC in the DNA duplex that could be used for selective recognition and excision by TDG.
Figure 1.
Structure of 5fC and 5caC base pairs and schematic of the extrahelical flip and recognition by TDG.
RESULTS AND DISCUSSION
Both 5fC and 5caC Favor an Amino-Keto Tautomeric State
To test whether 5fC or 5caC could exist in the rare imino-keto tautomeric form, we used vibrational spectroscopy since different tautomers are expected to give distinct vibrational fingerprints.25 We focused on the frequency window for in-plane base vibrations (1450–1800 cm−1) which includes carbonyl stretches and ring breathing modes that mix C=C, C=N stretching, and ND2 bending. As a first step, we acquired temperature-dependent Fourier transform infrared (FTIR) spectra since the coexistence of multiple tautomers can result in spectral shifts and isosbestic points depending on their equilibrium thermodynamic properties.26 Both 5fC and 5caC (Figure 2a,b) exhibit minimal changes under physiological conditions, suggesting that only one tautomeric form is predominant. We assign the amino-keto species predominant for both 5fC and 5caC based on DFT calculations and comparison to the known amino-keto spectrum of 2′-deoxycytidine (SI).
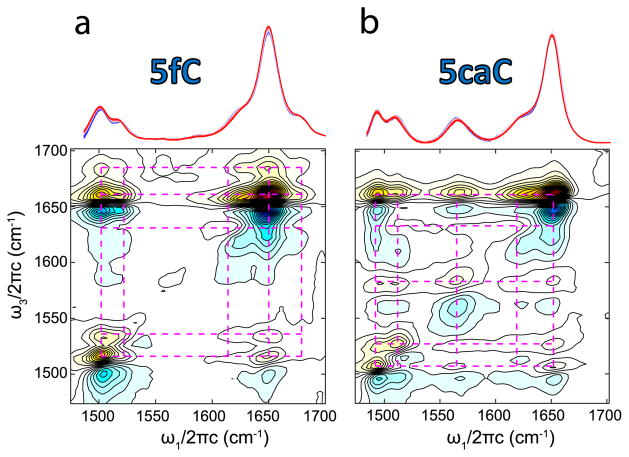
Figure 2.
Temperature-dependent FTIR spectra of (a) 5fC and (b) 5caC, pD 7.3, ranging from 10 to 95 °C (blue-red). 2D IR spectra with ZZYY polarization of 5fC and 5caC are aligned beneath the temperature ramp spectra.
The 2D IR spectra of the 5fC and 5caC free nucleosides provide direct evidence that the amino-keto tautomer is the only appreciable form. Ultrafast 2D IR spectroscopy reports on the coupling between molecular vibrations. By correlating excitation (ω1) and detection (ω3) frequencies, mixtures of tautomers can be separately resolved before they exchange through the distinct cross-peak patterns unique to each tautomer. Previous studies have shown that for a single tautomer of a nucleobase or nucleobase analog, cross-peaks exist between all of the in-plane base vibrations due to the delocalization of these modes.27,28 This is also the case for both 5fC and 5caC, as seen in their 2D IR spectra plotted in Figure 2a,b, respectively. The diagonal peaks in the 2D spectrum mirror the peaks in the linear FTIR spectrum, each consisting of an oppositely signed doublet (red above blue). The gridlines help to illustrate that cross-peaks are observed between all the diagonal peaks, indicating the presence of a single dominant tautomer species for both nucleosides. In the event that multiple tautomers were present, we would expect to see multiple overlapping grid patterns lacking cross peaks to one another.29 We have also considered the possibility of tautomerism in singly protonated 5caC, but we find no evidence for tautomers other than the dominant amino-keto species (see SI for details). Together the temperature-dependent FTIR and 2D IR spectra provide direct experimental evidence arguing against the presence of multiple 5fC and 5caC tautomers under physiological conditions. This result is consistent with computational predictions that the amino-keto tautomer of 5fC and 5caC is the most stable species.23
Measurement of N3 pKa’s by 13C NMR
The extent of hydrogen bond weakening due to the –CHO and –COOH substituents can be correlated with changes in the pKa at the N3 site. If our hypothesis is correct, both 5fC and 5caC should demonstrate increased N3 acidity. In the past, these pKa’s have been determined by pH-dependent UV spectra,23,24 but site-specific assignment is difficult since the carboxyl group of 5caC complicates the investigation by introducing a second pKa not present in the other cytosine derivatives. We reassessed the pKa values of 5hmC, 5fC, and 5caC by recording the 13C NMR spectra of the corresponding 13C-labeled free nucleosides as a function of pH. The label was inserted at the exocyclic carbon atom connected to C5 of cytosine.
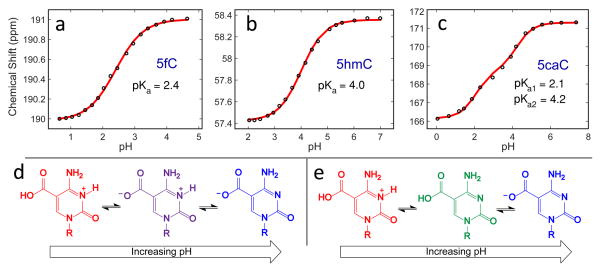
We recorded 13C NMR spectra in the pH range 0.5 to 8 and tracked the chemical shift of the labeled carbon for the nucleosides 5fC, 5hmC, and 5caC. For both 5fC and 5hmC, plotting chemical shift vs pH results in a single-transition titration curve that is readily fit to the Henderson–Hasselbalch equation, yielding a pKa value of 2.4 for 5fC and 4.0 for 5hmC (Figure 3a,b). These pKa values are comparable to those obtained by UV measurements30 and indicate that the more electron-withdrawing formyl substituent in 5fC lowers the N3 pKa significantly in contrast to C and 5hmC, consistent with our reasoning.
Figure 3.
Chemical shift vs pH titration profiles obtained from 13C NMR measurements of 13C-labeled 5fC, 5hmC, and 5caC (a, b, and c, respectively). Possible neutral species for 5caC include the Zwitterionic species protonated only at N3 (purple, d) or the species protonated at the carboxyl group (green, e).
For 5caC, the chemical shift vs pH curve results in two transitions with pKa values of 4.2 and 2.1. Although these values are similar to the pKa’s measured by UV,23 it is difficult to conclusively assign which pKa corresponds to N3 because there are two possible neutral species of 5caC depending on which site protonates first (Figure 3d,e). Since the carboxylic proton is much closer to the 13C-labeled carbon than the N3 proton, we expect the greater change in chemical shift to be associated with the carboxylic proton. We found that the change in chemical shift around pH 4.2 (~3 ppm) is greater than the shift around pH 2.1 (~2 ppm), suggesting that the pKa of 4.2 should be assigned to the carboxylic group while the pKa of 2.1 should be assigned to N3. These assignments, however, are not definitive and are the opposite of previous assignments in the literature.23,24
Determination and Site-Assignment of the pKa’s of 5-Formylcytidine and 5-Carboxylcytidine by FTIR Spectroscopy
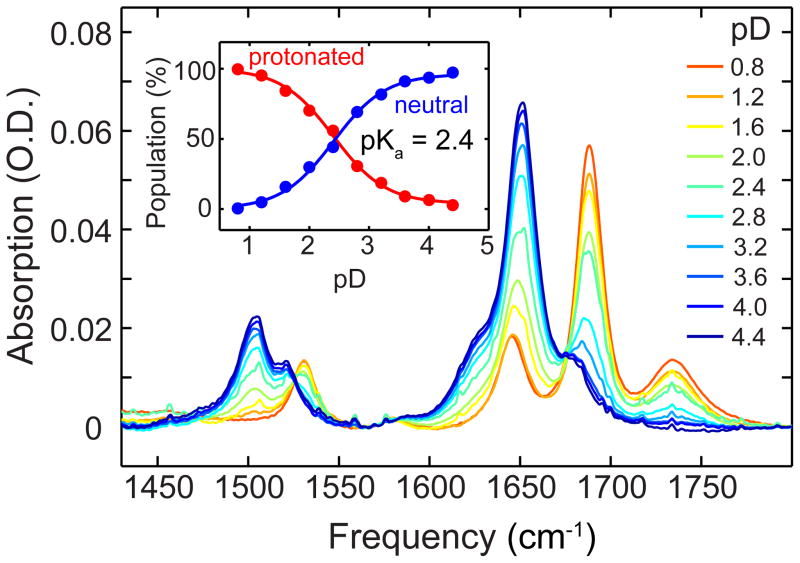
To independently examine these conclusions, we measured the pKa values of 5fC and 5caC through pH-dependent FTIR spectroscopy. Because a mixture of protonated and deprotonated species exists at each pH point, we employ singular value decomposition (SVD) analysis and a maximum entropy method to disentangle the pH-dependent spectra and reconstruct pure component spectra that individually represent each of the contributing species. We can then compare these reconstructed spectra directly against DFT calculations to assign the structure of each protonation state. As a control on this method, we assigned the pKa of 2′-deoxycytidine to be 4.5 and the pKa of 5fC to be 2.4 (Figure 4, details in SI), consistent with previous reports.30,31
Figure 4.
pD-dependent FTIR spectra of 5fC. The inset shows the titration curves for the protonated and neutral 5fC species obtained from the SVD analysis.
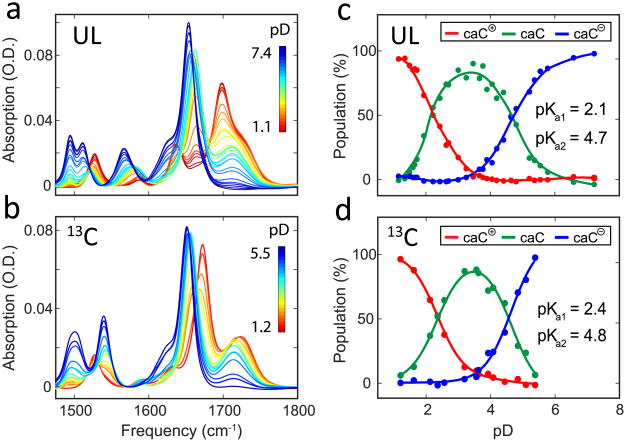
Turning to 5caC, we faced the more complicated problem of site-specific assignment of two pKa’s. As a result, we adopted an isotope labeling strategy similar to the 13C NMR experiments in which a 13C isotope label was inserted at the exocyclic carbon atom connected to C5 of cytosine. The pD-dependent FTIR spectra for unlabeled (UL) 5caC and 13C-labeled 5caC are presented in Figure 5a and b, respectively. At a pD of 7.4, the two coupled C=O stretches of UL 5caC give rise to the main carbonyl mode at 1655 cm−1 and a weaker band at 1567 cm−1, as assigned by DFT. In general, the spectra of 13C labeled 5caC are similar to UL 5caC, except that the 1567 cm−1 carbonyl peak red shifts to 1540 cm−1, indicating that this mode has significant contribution from the labeled carboxyl group.
Figure 5.
pD-dependent FTIR spectra of (a) unlabeled and (b) 13C labeled (exocyclic carbonyl carbon) 5caC. (c,d) Titration curves of 5caC cation (red), neutral (green), and anion (blue) species derived from the SVD analysis.
We performed SVD analysis and reconstruction of pure component spectra corresponding to the cationic, neutral, and anionic 5caC species for both unlabeled and 13C labeled 5caC. The reconstructed spectra are plotted in Figure 6a–c, with the UL 5caC and the 13C labeled 5caC represented by solid and dashed lines, respectively. The corresponding population fractions for the three species as a function of pD are plotted in Figure 5c and d. Through this analysis, the two pKa values of 5caC were determined to be 2.1 and 4.7 from the UL 5caC spectra and, in reasonable agreement, 2.4 and 4.8 from the 13Clabeled 5caC spectra.
Figure 6.
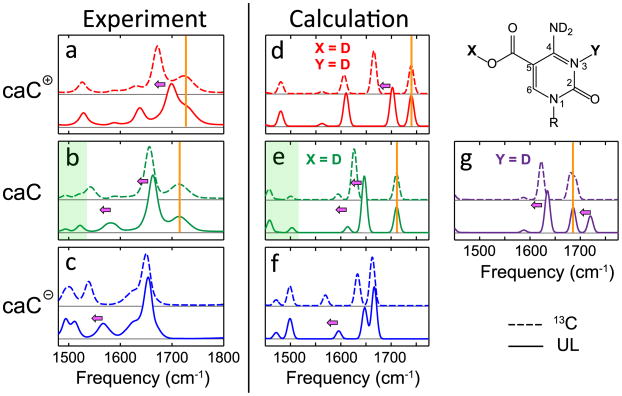
Comparison between the experimental (left) and DFT calculated (right) spectra for 5caC cation (red), neutral (green/purple), and anion (blue) species. Both unlabeled (solid lines) and 13C labeled (dashed lines) 5caC spectra are shown. Pink arrows highlight frequency shifts upon isotopic labeling, while orange bars highlight frequencies that are unaffected by the label.
To assign the molecular origin of the two pKa values, we compared the experimental spectra (Figure 6a–c) with DFT calculated spectra (Figure 6d–g) for both UL and 13C labeled 5caC. The pink arrows in Figure 6 highlight frequency shifts upon isotopic labeling, while the orange bars indicate peaks that are unaffected by the label. In the calculations, 5caC molecules with −1, 0, and +1 charges were solvated by three explicit water molecules near the hydrogen bond donor/acceptor sites. Two different isomers of neutral 5caC were considered: one protonated at the carboxyl group (Figure 6e, green) and another protonated at the N3 atom (Figure 6g, purple).
As a check on the validity of our DFT calculated spectra, we first compared the cationic and anionic experimental spectra (Figure 6a,c) against their calculated spectra (Figure 6d,f). Since these species correspond to either complete protonation or deprotonation of the nucleobase, there is no ambiguity in molecular structure. Overall, we find a close match in the peak pattern, peak intensities, and 13C isotope shift between the experimental and calculated spectra for both the 5caC cation and anion. This provides strong support for the use of DFT calculations to assign these vibrational spectra, and therefore we turn to assigning the neutral 5caC species with pKa at 4.7.
The neutral species of 5caC can be protonated at one of two sites: either the carboxyl group or the N3 of cytosine. As seen in Figure 6e and g, DFT calculations predict distinct spectra for these two possible structures. However, the spectrum calculated for the isomer with a protonated exocyclic carboxyl group (Figure 6e) best reproduces the experimental spectra, displaying a similar C=O peak pattern and the presence of low frequency ring modes between 1450 and 1550 cm−1 (highlighted by the green shading in Figure 6). The 13C labeled spectrum for neutral 5caC (Figure 6b, dashed line) demonstrates that upon isotope labeling the 1713 cm−1 peak does not shift but the 1657 cm−1 peak red shifts, indicating that these peaks involve mostly C2=O and carboxyl C=O character, respectively. This isotope-induced frequency shift is in excellent agreement with the calculated spectra for the neutral 5caC molecule protonated at the carboxyl group (Figure 6e). In contrast, the calculated spectra for the neutral 5caC molecule protonated at N3 (Figure 6g) predict that the highest frequency mode is mostly carboxyl C=O stretch (seen to red shift upon 13C labeling), but this pattern does not match the experimental observation. Moreover, the lower frequency delocalized ring vibrations around 1500 cm−1 are not reproduced for the N3-protonated structure. In light of these results, we assign the pKa of 4.7 to the carboxyl group and the pKa of 2.1 to the N3 position.
Our assignment of the 2.1 pKa of 5caC to N3 is the opposite of previous assignments that were based on similar isosbestic points between the UV spectra of 2′-deoxycytidine and 5caC and chemical analogies to other aromatic compounds possessing a carboxyl group with a vicinal amine.23,24 Our assignment supports the hypothesis that the electron-withdrawing substituent –COOH lowers the pKa of N3 and destabilizes G-5caC base pairs.
Stability of DNA Duplexes Containing 5-Formlycytidine and 5-Carboxylcytidine
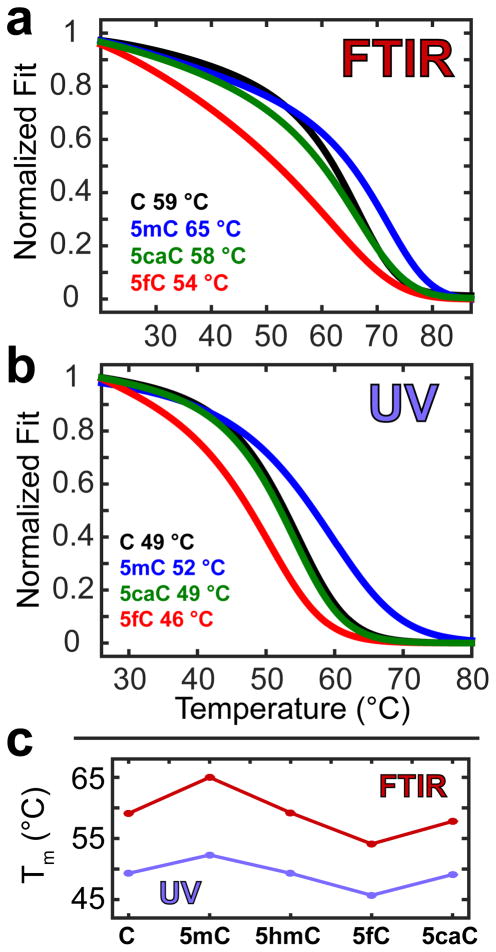
In order to further test that both G-5fC and G-5caC base pairs form less stable hydrogen bonds than the canonical G-C base pair, we studied the thermal stability of dsDNA oligonucleotides containing different cytosine modifications using IR and UV spectroscopy. To accentuate the difference in melting temperature (Tm), we used a self-complementary dsDNA oligomer containing six G-X base pairs with sequence 5′-TAXGXGXGTA-3′, where X denotes C, 5mC, 5hmC, 5fC, or 5caC. Temperature-dependent FTIR spectra measured at a pD of 7.3 (Figure S6) were analyzed using SVD, and the resulting melting curves were fit to a two-state model described in the Materials and Methods. The analogous UV measurements were also collected, but a single frequency intensity at 260 nm was tracked as a function of temperature, and this trace was fit to the same two-state model. Melting temperatures for the set of dsDNA are listed in SI Table 1. The ~10 °C difference in Tm’s measured by the two techniques is explained by the oligomer concentration difference between the two methods (1000 μM for IR vs 4 μM for UV). Figure 7 shows the melting curves fit to each data set as well as a comparison of the melting temperature trend measured by each technique. The oligomer where X = 5hmC is omitted for clarity, as the Tm of this oligomer is equal to the Tm for X = C (see SI Table 1).
Figure 7.
Melting curves obtained at physiological pH and fit to a two-state model to determine Tm for each of the oligonucleotides (a) obtained from the second SVD component of the FTIR spectra and (b) tracking the UV intensity at 260 nm. (c) Relative Tm trends between the methods.
Currently, no clear consensus exists in the literature regarding the influence of naturally occurring cytosine derivatives on the stability of dsDNA. A survey of past reports and a comparison with our results is included in the SI. Consistent with our hypothesis of weakened N3 hydrogen bonding, we find the 5fC oligomer to be less stable than the unmodified oligomer, having a significant 5 and 3 °C decrease in Tm from IR and UV measurements, respectively. Once again, the story surrounding 5caC proves more complicated. Our experiments show that the 5caC oligomer has an equal (UV) or slightly lowered (IR) Tm compared to the unmodified oligomer at neutral pH, but in light of our 5caC pKa assignments one would expect that the protonation state of the carboxyl group could influence the properties of the base pair. We have explored this possibility below with pH-dependent melting studies.
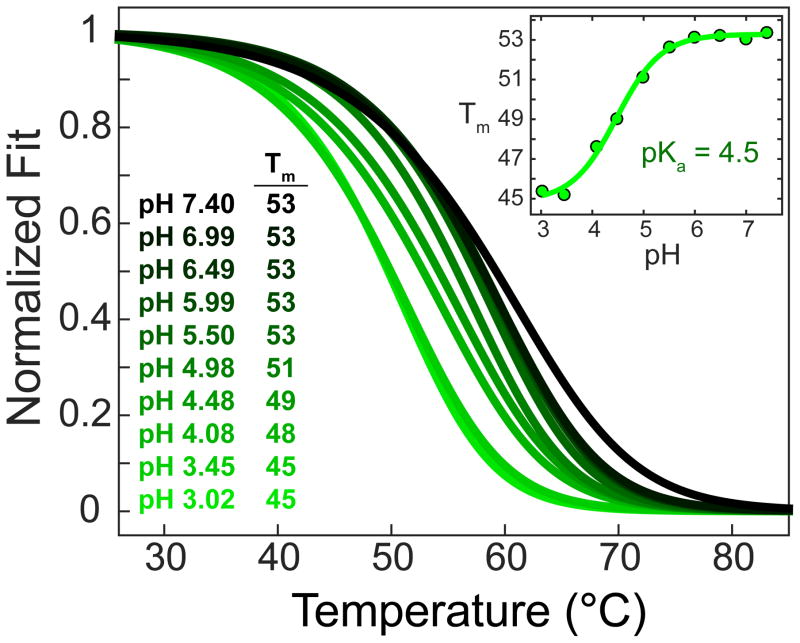
It has been reported that the excision of 5caC by TDG is acid catalyzed, while the excision of 5fC is pH independent.23 To determine whether the pH dependence in excision rate is correlated with pH dependent stability of the 5fC and 5caC oligomers, we repeated the infrared Tm determination for these duplexes in a pD 3.7 solution prepared at identical salt and buffer concentration as the previous measurements. For the 5fC oligomer, we observe no pD dependence for the Tm, while we observed a 7 °C drop in Tm for the 5caC oligomer (Figure S7). The destabilization of the 5caC oligomer relative to the 5fC oligomer is likely due to the influence of protonation at the carboxyl group of 5caC. Therefore, 5fC, with only the N3 site to protonate, displays no pD dependence. In general, for 5caC, one would expect that the increased positive charge due to protonation at the carboxyl group would lower the pKa at N3 and destabilize the base pair, consistent with the observed reduction in Tm at decreased pD. To further explore the pH dependence of the 5caC oligomer’s Tm, we carried out a series of UV melting experiments as a function of pH. The oligomer concentration and salt concentration were the same as the previous UV experiments (Figure 7); however, to increase the buffer capacity, we increased the buffer concentration from 10 to 100 mM. The change in sodium cation concentration accounts for the ~4 °C difference in Tm for the 5caC oligomer measured at a similar pH above. Figure 8 shows the pH dependence of the X = 5caC oligomer’s melting curve and melting temperature. As seen in the Figure 8 inset, the Tm plateaus around 53 °C above pH = 6, decreases with decreasing pH, and then plateaus around 45 °C below pH = 3.5. Fitting this profile to the Henderson–Hasselbalch equation results in a pKa of 4.5, consistent with the pKa measured for the carboxyl group of the 5caC free nucleoside. These observations support a picture in which increasing protonation of the carboxyl group of 5caC (pKa = 4.7) within the duplex weakens the 5caC-G base pairs, accounting for the behavior of the Tm with decreasing pH. These findings suggest that previous reports of acid catalyzed excision of 5caC could be explained by the influence of increasing protonation of the 5caC nucleobase at the exocyclic carboxyl group leading to a weakening of the 5caC-G base pair.
Figure 8.
UV melting curves of the 5caC oligomer as a function of pH and, inset, the Tm vs pH trace fit to the Henderson–Hasselbalch equation revealing a consistent pKa of 4.5.
Conclusion
Our studies have revealed two observations that have direct consequences for the mechanism of base recognition by TDG. First, we assign the lower pKa of 5caC to N3 instead of the carboxyl group based on direct site-specific assignment of the pKa values through IR spectroscopy measurement and DFT computation. Second, using two different techniques, we provide a complete data set reporting the influence of the naturally occurring cytosine modifications on dsDNA stability in order to provide a robust survey of the stability trend. Specifically, we find that at neutral pH the Tm of a 5caC-containing oligomer is not significantly different from the analogous C-containing oligomer while the Tm of a 5fCcontaining oligomer is significantly lower. Furthermore, we observed the Tm of the 5fC-containing oligomer to be pH-independent, while we observed the Tm of the 5caC-containing oligomer to drop below that of the 5fC-containing oligomer with decreasing pH as the carboxyl groups are increasingly protonated. This influence can well explain the pH dependence of both the Tm for 5caC-containing oligomers as well as the limited TDG activity toward 5caC at physiological pH, since some small percentage of the carboxyl groups will be transiently protonated and thus capable of flipping into the active site of TDG. These results demonstrate that an electron-withdrawing substituent at C5 decreases the electron density at N3 (and thus the pKa) such that the hydrogen bonding capacity of the base is weakened. Furthermore, we believe that weakened base-pairing facilitates extrahelical flipping of the modified base for recognition and excision by TDG. Our proposal can explain the previous finding that the excision of 5caC is acid catalyzed, with 5caC serving as an even more effective TDG substrate than 5fC at low pH.23
It should be noted that the electron-withdrawing properties of the 5-formyl and 5-carboxyl groups may also affect base stacking and hydrophobicity due to a shift in the electronic distribution on the base and the observed destabilization is likely not due solely to weakened N3 hydrogen bonding, but also to these more global changes.
In addition to new insights regarding the effect of N3 acidity, we emphasize the importance of past findings by Maiti et al. regarding the influence of the formyl and carboxyl groups on glycosidic bond stability as well as critical interactions between 5fC and 5caC with the enzyme. We believe our new insight regarding the nucleobases and DNA duplex are complementary with these past results.23 Maiti et al. reported an apparent pKa of 5.75 for 5caC when bound in the enzyme–substrate complex, but they assign this pKa to protonation at N3. In light of our IR/DFT analysis, we believe this apparent pKa corresponds to protonation at the carboxyl group of 5caC. In the presence of the enzyme, this elevated apparent pKa would allow for more protonation of the carboxyl group and can further help explain the limited TDG activity toward 5caC under neutral conditions.
MATERIALS AND METHODS
Synthesis of 13C-labeled 5fC, 5caC, and 5hmC
13C-labeled 5fC was synthesized directly from the commercially available 5-iododeoxycytidine through a simplified version of our former procedure using 13C-labeled carbon monoxide, but without the need to protect the free 3′ and 5′-hydroxyl groups.32 Reduction of the 13C-labeled 5fC with sodium borohydride provided the corresponding 13C-labeled 5hmC. Similarly, 13C-labeled 5caC was synthesized by coupling 5-iodo-deoxycytidine with 13CO in methanol in the presence of Pd(OAc)2 followed by alkaline hydrolysis using sodium hydroxide instead of potassium carbonate to avoid residual carbonate that would interfere with IR measurements.
Determination of pKa Values by 13C NMR Spectroscopy
Citrate buffers (0.5 mL, 0.2 M) with a series of pH values were prepared and loaded into separate NMR tubes. 13C-labeled 5caC and 5hmC samples were dissolved in water at a concentration of 20 mg mL−1. Due to the lower solubility of 5fC, 13C-labeled 5fC was prepared as a clear saturated solution. The pKa values were obtained by fitting the chemical shift versus pH titration profiles to the Henderson–Hasselbalch equation.
DNA Oligomer Synthesis of 5′-TAXGXGXGTA-3′ (X = C, 5mC, 5hmC, 5fC, or 5caC)
Unmodified and 5mC phosphoramidites were purchased from Glen Research. 5fC and 5caC phosphoramidites and DNA oligomers containing them were prepared by following our former procedure, and 5mC-containing oligomers were obtained directly from 5fC-containing oligomers by treatment with sodium borohydride.32 All the DNA oligomers were purified by C18 reverse-phase columns using acetonitrile in TEAA (0.05 M) and characterized by Maldi-TOF MS.
IR Spectroscopy
For all IR spectroscopy, the sample cell consists of ~25 or ~40 μL (depending on path length) of sample solution between two 1-mm-thick CaF2 windows that are separated by a 50 μm Teflon spacer for 1 mM oligomer samples and a 125 μm spacer for the 3 mg mL−1 free nucleotide samples. Spectra were taken in deuterated water (D2O; Cambridge Isotopes) in order to remove interference from the H2O bend absorption at 1650 cm−1.
The pH dependent FTIR spectra were acquired on a Bruker Tensor 27 spectrometer at 4 cm−1 resolution by averaging 60 scans. The deuterated samples were pH adjusted using DCl and NaOD solutions, and the pH was measured using a standard glass electrode. Measured pH values were converted to pD values according to ref 33.
Singular value decomposition (SVD) analysis of the FTIR spectra in the 1450 cm−1 to 1800 cm−1 region was used to determine the pKa’s for the nucleosides using the procedure detailed in ref 34. A maximum entropy method outlined in ref 35 was employed to reconstruct the pure component spectra corresponding to each of the distinct molecular species that contribute to the experimentally measured spectrum as well as their corresponding population profiles.
Temperature dependent FTIR were collected across a temperature range of 10 to 95 °C. Oligomer samples were filtered, H-D exchanged, and then prepared at 1 mM concentration in deuterated 10 mM sodium phosphate buffer plus 40 mM NaCl. Similar to the pH dependence, SVD analysis was applied to the FTIR temperature series, and the resulting second SVD component was fit to a melting curve that reports on the duplex fraction following the two-state model:
Here, the reference temperature is set to the melting temperature Tm, which is defined as the temperature at which 50% of the total DNA oligomers are duplexed, or where 2[D] = [M1] + [M2].
2D IR spectra were collected on a 2D IR spectrometer built to a previously described design.36 All spectra were acquired with polarization set to perpendicular (ZZYY). The waiting time was set to τ2 = 150 fs, and the evolution time τ1 was scanned out to 3.0 ps in 4 fs steps.
UV Spectroscopy
Measurement of the melting curves for the same self-complementary dsDNA oligomer for X = C, 5mC, 5hmC, 5fC, and 5caC was conducted on an Agilent 8453 Spectrophotometer. Each HPLC purified oligomer (4 μmol, 1.2 mL) was dissolved in a 1 cm cuvette with 10 mM phosphate buffer (pH 7.5) and 100 mM NaCl. UV spectra were recorded from 26 to 90 °C. The UV intensity at 260 nm vs temperature was fit to the same two-state model described for the IR measurements. The pH-dependent melting studies of the X = 5caC oligomer were similarly conducted, except the phosphate buffer concentration was increased to 100 mM.
Computation of IR Spectra
Density functional theory (DFT) calculations were performed using Gaussian 09 to help assign the experimental IR spectra.37 The B3LYP hybrid functional was implemented with the 6–31G(d,p) basis set to optimize molecular geometries and determine the vibrational normal modes. The calculated frequencies were scaled by a factor of 0.9614 to help match experimental frequencies.38 Following previous studies that described the importance of explicit water molecules,27,29 calculations were performed in the gas phase with three explicit D2O molecules positioned around the hydrogen bond acceptor/donor sites. All labile protons were deuterated in order to match the experimental conditions.
Supplementary Material
Acknowledgments
This work was supported by the U.S. National Institutes of Health (K01 HG006699 to Q.D. and R01 HG006827 to C.H.). C.H. is an investigator of Howard Hughes Medical Institute. A.T. thanks the National Science Foundation (CHE-1414486) and the University of Chicago for support.
Footnotes
The authors declare no competing financial interest.
The Supporting Information is available free of charge on the ACS Publications website at DOI: 10.1021/acschembio. 5b00762.
Assignment of 5fC and 5caC to the predominant amino-keto tautomer, details of the assignment of the pKa of C and 5fC to N3, spectroscopic signatures of duplex denaturation, comparison with previous Tm reports, IR measurement of 5caC/5fC oligomer melting temperature pH dependence, and SI references (PDF)
References
- 1.Lindahl T. Instability and decay of the primary structure of DNA. Nature. 1993;362:709–714. doi: 10.1038/362709a0. [DOI] [PubMed] [Google Scholar]
- 2.Stivers JT, Jiang YL. A mechanistic perspective on the chemistry of DNA repair glycosylases. Chem Rev. 2003;103:2729–2759. doi: 10.1021/cr010219b. [DOI] [PubMed] [Google Scholar]
- 3.Morgan MT, Bennett MT, Drohat AC. Excision of 5-halogenated uracils by human thymine DNA glycosylase: Robust activity for DNA contexts other than CpG. J Biol Chem. 2007;282:27578–27586. doi: 10.1074/jbc.M704253200. [DOI] [PMC free article] [PubMed] [Google Scholar]
- 4.Hitomi K, Iwai S, Tainer JA. The intricate structural chemistry of base excision repair machinery: Implications for DNA damage recognition, removal, and repair. DNA Repair. 2007;6:410–428. doi: 10.1016/j.dnarep.2006.10.004. [DOI] [PubMed] [Google Scholar]
- 5.Wiebauer K, Jiricny J. Mismatch-specific thymine DNA glycosylase and DNA polymerase beta mediate the correction of G.T mispairs in nuclear extracts from human cells. Proc Natl Acad Sci U S A. 1990;87:5842–5845. doi: 10.1073/pnas.87.15.5842. [DOI] [PMC free article] [PubMed] [Google Scholar]
- 6.Bhutani N, Burns DM, Blau HM. DNA demethylation dynamics. Cell. 2011;146:866–872. doi: 10.1016/j.cell.2011.08.042. [DOI] [PMC free article] [PubMed] [Google Scholar]
- 7.He YF, Li BZ, Li Z, Liu P, Wang Y, Tang Q, Ding J, Jia Y, Chen Z, Li L, Sun Y, Li X, Dai Q, Song CX, Zhang K, He C, Xu GL. Tet-Mediated Formation of 5-Carboxylcytosine and Its Excision by TDG in Mammalian DNA. Science. 2011;333:1303–1308. doi: 10.1126/science.1210944. [DOI] [PMC free article] [PubMed] [Google Scholar]
- 8.Klose RJ, Bird AP. Genomic DNA methylation: The mark and its mediators. Trends Biochem Sci. 2006;31:89–97. doi: 10.1016/j.tibs.2005.12.008. [DOI] [PubMed] [Google Scholar]
- 9.Ito S, Shen L, Dai Q, Wu SC, Collins LB, Swenberg JA, He C, Zhang Y. Tet proteins can convert 5-methylcytosine to 5-formylcytosine and 5-carboxylcytosine. Science. 2011;333:1300–1303. doi: 10.1126/science.1210597. [DOI] [PMC free article] [PubMed] [Google Scholar]
- 10.Tahiliani M, Koh KP, Shen Y, Pastor WA, Bandukwala H, Brudno Y, Agarwal S, Iyer LM, Liu DR, Aravind L, Rao A. Conversion of 5-methylcytosine to 5-hydroxymethylcytosine in mammalian DNA by MLL partner TET1. Science. 2009;324:930–935. doi: 10.1126/science.1170116. [DOI] [PMC free article] [PubMed] [Google Scholar]
- 11.Ito S, D’Alessio AC, Taranova OV, Hong K, Sowers LC, Zhang Y. Role of Tet proteins in 5mC to 5hmC conversion, ES-cell self-renewal and inner cell mass specification. Nature. 2010;466:1129–1133. doi: 10.1038/nature09303. [DOI] [PMC free article] [PubMed] [Google Scholar]
- 12.Pfaffeneder T, Hackner B, Truß M, Münzel M, Müller M, Deiml CA, Hagemeier C, Carell T. The discovery of 5-formylcytosine in embryonic stem cell DNA. Angew Chem, Int Ed. 2011;50:7008–7012. doi: 10.1002/anie.201103899. [DOI] [PubMed] [Google Scholar]
- 13.Wu SC, Zhang Y. Active DNA demethylation: many roads lead to Rome. Nat Rev Mol Cell Biol. 2010;11:607–620. doi: 10.1038/nrm2950. [DOI] [PMC free article] [PubMed] [Google Scholar]
- 14.Maiti A, Drohat AC. Thymine DNA glycosylase can rapidly excise 5-formylcytosine and 5-carboxylcytosine: Potential implications for active demethylation of CpG sites. J Biol Chem. 2011;286:35334–35338. doi: 10.1074/jbc.C111.284620. [DOI] [PMC free article] [PubMed] [Google Scholar]
- 15.Song CX, Szulwach KE, Dai Q, Fu Y, Mao SQ, Lin L, Street C, Li Y, Poidevin M, Wu H, Gao J, Liu P, Li L, Xu GL, Jin P, He C. Genome-wide profiling of 5-formylcytosine reveals its roles in epigenetic priming. Cell. 2013;153:678–691. doi: 10.1016/j.cell.2013.04.001. [DOI] [PMC free article] [PubMed] [Google Scholar]
- 16.Shen L, Wu H, Diep D, Yamaguchi S, D’Alessio AC, Fung HL, Zhang K, Zhang Y. Genome-wide analysis reveals TET- and TDG-dependent 5-methylcytosine oxidation dynamics. Cell. 2013;153:692–706. doi: 10.1016/j.cell.2013.04.002. [DOI] [PMC free article] [PubMed] [Google Scholar]
- 17.Nabel CS, Jia H, Ye Y, Shen L, Goldschmidt HL, Stivers JT, Zhang Y, Kohli RM. AID/APOBEC deaminases disfavor modified cytosines implicated in DNA demethylation. Nat Chem Biol. 2012;8:751–758. doi: 10.1038/nchembio.1042. [DOI] [PMC free article] [PubMed] [Google Scholar]
- 18.Raiber EA, Beraldi D, Ficz G, Burgess HE, Branco MR, Murat P, Oxley D, Booth MJ, Reik W, Balasubramanian S. Genome-wide distribution of 5-formylcytosine in embryonic stem cells is associated with transcription and depends on thymine DNA glycosylase. Genome Biol. 2012;13:R69. doi: 10.1186/gb-2012-13-8-r69. [DOI] [PMC free article] [PubMed] [Google Scholar]
- 19.Zhang L, Lu X, Lu J, Liang H, Dai Q, Xu GL, Luo C, Jiang H, He C. Thymine DNA glycosylase specifically recognizes 5-carboxylcytosine-modified DNA. Nat Chem Biol. 2012;8:328–330. doi: 10.1038/nchembio.914. [DOI] [PMC free article] [PubMed] [Google Scholar]
- 20.Hashimoto H, Hong S, Bhagwat AS, Zhang X, Cheng X. Excision of 5-hydroxymethyluracil and 5-carboxylcytosine by the thymine DNA glycosylase domain: Its structural basis and implications for active DNA demethylation. Nucleic Acids Res. 2012;40:10203–10214. doi: 10.1093/nar/gks845. [DOI] [PMC free article] [PubMed] [Google Scholar]
- 21.Bennett MT, Rodgers MT, Hebert AS, Ruslander LE, Eisele L, Drohat AC. Specificity of human thymine DNA glycosylase depends on N-glycosidic bond stability. J Am Chem Soc. 2006;128:12510–12519. doi: 10.1021/ja0634829. [DOI] [PMC free article] [PubMed] [Google Scholar]
- 22.Hansch C, Leo A, Unger SH, Kim KH, Nikaitani D, Lien EJ. Aromatic” substituent constants for structure-activity correlations. J Med Chem. 1973;16:1207–1216. doi: 10.1021/jm00269a003. [DOI] [PubMed] [Google Scholar]
- 23.Maiti A, Michelson AZ, Armwood CJ, Lee JK, Drohat AC. Divergent mechanisms for enzymatic excision of 5-formylcytosine and 5-carboxylcytosine from DNA. J Am Chem Soc. 2013;135:15813–15822. doi: 10.1021/ja406444x. [DOI] [PMC free article] [PubMed] [Google Scholar]
- 24.Sumino M, Ohkubo A, Taguchi H, Seio K, Sekine M. Synthesis and properties of oligodeoxynucleotides containing 5-carboxy-2′-deoxycytidines. Bioorg Med Chem Lett. 2008;18:274–277. doi: 10.1016/j.bmcl.2007.10.081. [DOI] [PubMed] [Google Scholar]
- 25.Miles HT. Tautomeric forms in a polynucleotide helix and their bearing on the structure of DNA. Proc Natl Acad Sci U S A. 1961;47:791–802. doi: 10.1073/pnas.47.6.791. [DOI] [PMC free article] [PubMed] [Google Scholar]
- 26.Peng CS, Baiz CR, Tokmakoff A. Direct observation of ground-state lactam-lactim tautomerization using temperature-jump transient 2D IR spectroscopy. Proc Natl Acad Sci U S A. 2013;110:9243–9248. doi: 10.1073/pnas.1303235110. [DOI] [PMC free article] [PubMed] [Google Scholar]
- 27.Peng CS, Tokmakoff A. Identification of Lactam–Lactim Tautomers of Aromatic Heterocycles in Aqueous Solution Using 2D IR Spectroscopy. J Phys Chem Lett. 2012;3:3302–3306. doi: 10.1021/jz301706a. [DOI] [PMC free article] [PubMed] [Google Scholar]
- 28.Peng CS, Jones KC, Tokmakoff A. Anharmonic Vibrational Modes of Nucleic Acid Bases Revealed by 2D IR Spectroscopy. J Am Chem Soc. 2014;133:15650–15660. doi: 10.1021/ja205636h. [DOI] [PubMed] [Google Scholar]
- 29.Peng CS, Fedeles BI, Singh V, Li D, Amariuta T, Essigmann JM, Tokmakoff A. Two-dimensional IR spectroscopy of the anti-HIV agent KP1212 reveals protonated and neutral tautomers that influence pH-dependent mutagenicity. Proc Natl Acad Sci U S A. 2015;112:3229–34. doi: 10.1073/pnas.1415974112. [DOI] [PMC free article] [PubMed] [Google Scholar]
- 30.La Francois CJ, Jang YH, Cagin T, Goddard WA, III, Sowers LC. Chem Res Toxicol. 2000;13:462–470. doi: 10.1021/tx990209u. [DOI] [PubMed] [Google Scholar]
- 31.Karino N, Ueno Y, Matsuda A, Odns O. Synthesis and properties of oligonucleotides containing 5-formyl-2′-deoxycytidine: in vitro DNA polymerase reactions on DNA templates containing 5-formyl-2′-deoxycytidine. Nucleic Acids Res. 2001;29:2456–2463. doi: 10.1093/nar/29.12.2456. [DOI] [PMC free article] [PubMed] [Google Scholar]
- 32.Dai Q, He C. Syntheses of 5-formyl- and 5-carboxyl-dC containing DNA oligos as potential oxidation products of 5-hydroxymethylcytosine in DNA. Org Lett. 2011;13:3446–3449. doi: 10.1021/ol201189n. [DOI] [PMC free article] [PubMed] [Google Scholar]
- 33.Kręzel A, Bal W. A formula for correlating pKa values determined in D2O and H2O. J Inorg Biochem. 2004;98:161–166. doi: 10.1016/j.jinorgbio.2003.10.001. [DOI] [PubMed] [Google Scholar]
- 34.Hendler RW, Shrager RI. Deconvolutions based on singular value decomposition and the pseudoinverse: A guide for beginners. J Biochem Biophys Methods. 1994;28:1–33. doi: 10.1016/0165-022x(94)90061-2. [DOI] [PubMed] [Google Scholar]
- 35.Widjaja E, Garland M. Pure component spectral reconstruction from mixture data using SVD, global entropy minimization, and simulated annealing. Numerical investigations of admissible objective functions using a synthetic 7-species data set. J Comput Chem. 2002;23:911–919. doi: 10.1002/jcc.10080. [DOI] [PubMed] [Google Scholar]
- 36.Deflores LP, Nicodemus RA, Tokmakoff A. Two-dimensional Fourier transform spectroscopy in the pump-probe geometry. Opt Lett. 2007;32:2966–8. doi: 10.1364/ol.32.002966. [DOI] [PubMed] [Google Scholar]
- 37.Frisch MJ, Trucks GW, Schlegel HB, Scuseria GE, Robb MA, Cheeseman JR, Scalmani G, Barone V, Mennucci B, Petersson GA, Nakatsuji H, Caricato M, Li X, Hratchian HP, Izmaylov AF, Bloino J, Zheng G, Sonnenberg JL, Hada M, Ehara MTK, Fukuda R, Hasegawa J, Ishida M, Nakajima T, Honda Y, Kitao O, Nakai H, Vreven T, Montgomery JA, Jr, Peralta JE, Ogliaro F, Bearpark M, Heyd JJ, Brothers E, Kudin KN, Staroverov VN, Kobayashi R, Normand J, Raghavachari K, Rendell A, Burant JC, Iyengar SS, Tomasi J, Cossi M, Rega N, Millam NJ, Klene M, Knox JE, Cross JB, Bakken V, Adamo C, Jaramillo J, Gomperts R, Stratmann RE, Yazyev O, Austin AJ, Cammi R, Pomelli C, Ochterski JW, Martin RL, Morokuma K, Zakrzewski VG, Voth GA, Salvador P, Dannenberg JJ, Dapprich S, Daniels AD, Farkas Ö, Foresman JB, Ortiz JV, Cioslowski J, Fox DJ. Gaussian 09, revision A.02. Gaussian, Inc; Wallingford, CT: 2009. [Google Scholar]
- 38.Scott AP, Radom L. Harmonic Vibrational Frequencies: An Evaluation of Hartree–Fock, Møller–Plesset, Quadratic Configuration Interaction, Density Functional Theory, and Semiempirical Scale Factors. J Phys Chem. 1996;100:16502–16513. [Google Scholar]
Associated Data
This section collects any data citations, data availability statements, or supplementary materials included in this article.


