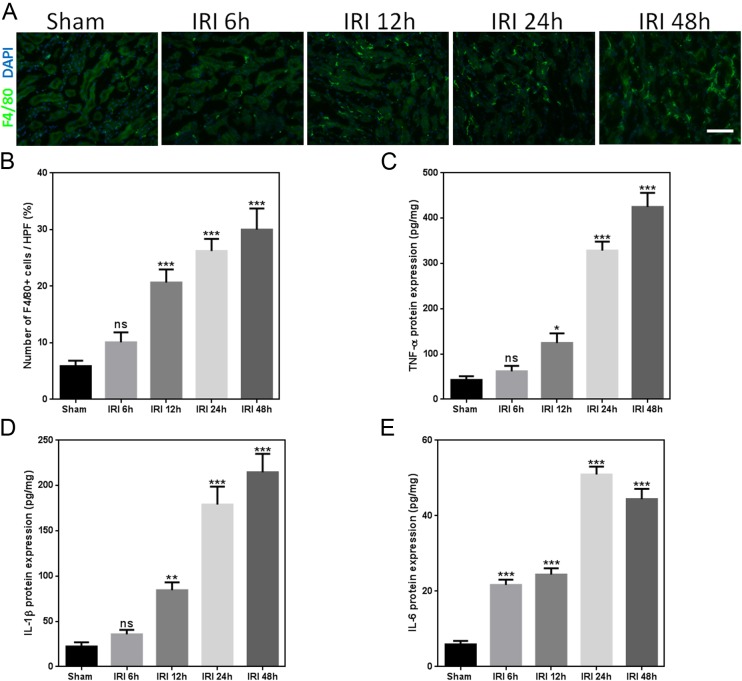
Figure 4. IRI induces release of inflammatory cytokines.
(A) Representative immunofluorescence images of F4/80-labeled macrophages (green) from the sham and IRI groups at 6, 12, 24, and 48 h. DAPI labels the nucleus (blue; magnification, 200×; bars = 250 µm). (B) Graph indicating the number of macrophages in mice after sham or IRI. (C–E) Representative ELISA detection results for inflammatory markers (TNF-α, IL-1β, and IL-6) in kidney tissue homogenates of IRI mice. ns, not significant versus sham; ∗p < 0.05, ∗∗p < 0.001, ∗∗∗p < 0.0001 versus sham; n = 8.

