

Abstract
It was proposed that the reaction of sodium pyruvate and H2O2 generates the intermediate 2-hydroperoxy-2-hydroxypropanoate, which converts into acetate, CO2, and H2O (Aleksankin et al. Kernenergie 1962, 5, 362–365). These conclusions were based on the products generated in 18O-enriched water and H2O2 reacting with pyruvic acid at room temperature; however, the lifetime of 2-hydroperoxy-2-hydroxypropanoate at room temperature is too short for direct spectroscopic observation. Therefore, we applied the combination of low-temperature and 13C NMR techniques to verify, for the first time, the formation of 2-deuteroperoxy-2-deuteroxypropanoate in mixtures of D2O and methanol-d4 and to monitor directly each species involved in the reaction between D2O2 and 13C-enriched pyruvate. Our NMR results confirm the formation of 2-deuteroperoxy-2-deuteroxypropanoate, where the respective chemical shifts are supported by density functional theory (DFT) calculations. At near-neutral apparent pD (pD*) and −35 °C, the formation of 2-deuteroperoxy-2-deuteroxypropanoate occurred with k = 2.43 × 10⁻³ dm3·mol−1·s−1. The subsequent decomposition of 2-deuteroperoxy-2-deuteroxypropanoate into acetate, CO2, and D2O occurred with k = 2.58 × 10⁻⁴ s−1 at −35 °C. In order to provide a full kinetic analysis, we also monitored the equilibrium of pyruvate and methanol with the hemiacetal (2-deuteroxy-2-methoxypropanoate). The kinetics for the reaction of sodium pyruvate and D2O2 were fitted by taking into account all these equilibria and species.
Graphical Abstract
INTRODUCTION
In mammalian cells, the formation of cytotoxic H2O2 from molecular oxygen is part of the humoral immune defense system,1 and since H2O2 is capable of crossing the cell membrane,1 its toxic effects are not limited to the cell where it is formed but may also affect the surrounding cells and tissue.2 H2O2 is converted into water and oxygen by catalase, which is present in virtually all cells.3 H2O2 also efficiently reacts with pyruvic acid and other α-keto acids.4–6
In pharmaceutical formulations, the presence of excipients such as poly(ethylene glycol) 400 (PEG400), poly(vinyl propylene) (PVP), and polysorbate 80 (PS80) can be a source of peroxides and H2O2.7 In the presence of traces of transition metals, these can generate reactive oxygen species (ROS), which can oxidize drugs and may lead to loss of potency.7 The efficient removal of peroxides, and especially of H2O2, may enhance the shelf life of pharmaceutical formulations. The reaction of H2O2 with (sodium) pyruvate may offer a suitable pathway to stabilize formulations against H2O2-mediated oxidation.
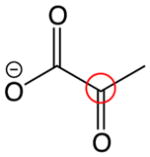
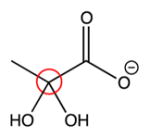
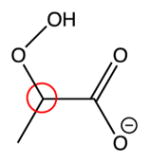
It has been suggested that the reaction of H2O2 with pyruvate proceeds through the formation of 2-hydroperoxy-2-hydroxypropanoate (Chart 1, structure 12; in Chart 1, all species are written for a reaction in D2O), which further breaks down to acetate (Chart 1, structure 7), carbon dioxide (CO2; Chart 1, structure 8), and H2O.8 Though the mechanism presented in Scheme 1 (written for a reaction in D2O) is strongly supported9,10 by experimental results with H218O and H218O2, no direct experimental observation of 2-hydroperoxy-2-hydroxypropanoate has been reported.8 A similar pathway is proposed for glyoxylic acid. Glyoxylic acid and its ionic form, glyoxylate, are proposed to react by formation of an intermediate structure, 2-hydroperoxy-2-hydroxyacetate, which breaks down to form formic acid, CO2, and OH−.11 2-Hydroperoxy-2-hydroxyacetate can be formed via Criegee intermediates generated by ozonolysis of a series of vinyl compounds.12 On the basis of kinetic isotope effect experiments, it was demonstrated that the rate-limiting step for the reaction of pyruvate with H2O2 is pH-dependent.10 At pH < 3.8 the rate-limiting step is formation of the intermediate, while at pH > 3.8 the breakdown of the intermediate is the rate-limiting step, consistent with general base catalysis.10,13 As an alternative, the formation of a dioxetane structure (Chart 1, structure 11) may be considered. The intermediary 3-methyl-1,2-dioxetane-1,1-diol could yield acetate and carbonic acid, the latter being in equilibrium with CO2 and H2O.14
Chart 1.

Chemical Structures with Carbon Position Numbers
Scheme 1.

Reaction of Pyruvate and D2O2 Forming an Intermediate and Breakdown to Products
In H2O, at neutral pH, sodium pyruvate is present in equilibrium with 2,2-dihydroxypropanoate (Chart 1, structure 2), referred to as hydrate, and undergoes a slow aldol condensation to form 2-hydroxy-2-methyl-3-oxosuccinate (Chart 1, structure 3).15–17 At lower pH the equilibrium is shifted toward formation of the hydrate due to stabilization through protonation of the carboxyl group.16,17 The formation and stability of the hydrate is directly correlated to the pKa values of pyruvic acid (2.2), and hydrate (3.6).18 The entropy of formation of the hydrate is negative (−112.13 J/mol·K), suggesting a highly structured form of the hydrate, which is stabilized through two molecules of H2O.18 In contrast, sodium pyruvate dimerizes fast at pH > 10.0. The product is often referred to as parapyruvate and polymerizes due to the acidic proton on the methyl group.15 No hydrate form was observed of the dimer, as the dimer is believed to be internally stabilized by the adjacent hydroxyl and keto groups.15 Since the average pKa of the carboxyl groups of parapyruvate is higher than that of pyruvate, the dimerization reaction is known to become autocatalytic because of the associated pH increase.19 Storage of pyruvate in solution at temperatures below −20 °C is, therefore, recommended.19 Under very basic conditions (pH > 12), practically all the pyruvate is converted efficiently to the dimer form.
Hydrogen peroxide adducts at carbonyl groups are more stable than water adducts at carbonyl groups.11–13 The addition of peroxide or H2O2 is as fast or faster than that of water, and most importantly, the acid- or water catalyzed dissociation back to the reactants is significantly slower for the peroxide adducts.13 This can be attributed to the lower basicity of hydrogen peroxide compared to that of water.13 The lower basicity results in a higher nucleophilicity of hydrogen peroxide.13 Although differing only by the presence of a hydroxyl group instead of a keto group at the C2 position, lactic acid (Chart 1, structure 6), unlike pyruvic acid, does not react efficiently with H2O2.20
All previous experiments on the reaction of H2O2 with pyruvate were performed at temperatures above 0 °C, where the lifetime of the proposed intermediate 2-hydroperoxy-2-hydroxypropanoate is too short to be directly observed by conventional spectroscopic techniques. Therefore, we applied low-temperature NMR to characterize the intermediate generated during reaction of pyruvate with D2O2. This technique allowed confirmation of the reaction scheme by studying the kinetics of formation and disappearance of the different reactants involved.
EXPERIMENTAL SECTION
Materials
Deuterium oxide (99.8%), methanol-d4 (99.6%), 13C-enriched (99%) sodium pyruvate at either position C1 or C2 (Chart 1, structure 1), 13C-enriched (99%) sodium acetate (Chart 1, structure 7), and 13C-enriched (99%) sodium bicarbonate (Chart 1, structure 9) were obtained from Cambridge Isotope Laboratories (Tewksbury, MA); non-enriched sodium pyruvate was supplied by Aldrich (Milwaukee, WI); lactic acid (85%) and H2O2 (30% in H2O) were supplied by Fisher Scientific (Waltham, MA). All chemicals were used without further purification. A solution (S0) of 49.9%/0.1%/49.8%/0.2% D2O/H2O/CD3OD/CH3OH (v/v/v/v) was used as solvent for the NMR experiments.
Instrumentation
NMR spectra were acquired on a 500 MHz (11.74 T) Bruker DRX spectrometer equipped with an X-channel observe broadband probe. Samples were cooled by a gas flow from liquid nitrogen through the probe. Standard 5 mm-7″ NMR tubes were purchased from Wilmad LabGlass (Vineland, NJ).
Software
Chemical structures were drawn with ChemBio-Draw Ultra 13.0 (PerkinElmer, Waltham, MA). Chemical shifts were initially predicted with the integrated predictor function in ChemBioDraw Ultra 13.0, which is based on empirical data. Subsequently, NMR data were predicted by density functional theory (DFT) calculations. NMR data were analyzed with MNova version 9.0 (Mestrelab Research, Santiago de Compostela, Spain). Kinetic data were fitted with a customized algorithm written in the Python programming language (see Supporting Information). DFT calculations were performed with the Gaussian-03 (G03) molecular orbital package.21
Experimental Protocol
Pure solutions of standards of 13C-sodium pyruvate, 13C-acetate, 13C-bicarbonate, and nonenriched pyruvate and CO2 were prepared in both D2O and S0. Because all experiments were performed in protic, predominantly deuterated solvents, all reactants, products, and intermediates are written with deuterons at positions of exchangeable sites. The CO2 solution was prepared by purging the solution with the gas created from a mixture of dry ice in water (dry ice should be handled with appropriate care). A lactic acid standard was prepared in D2O. The chemical shifts of these standards were recorded in both solutions to study substrate–solvent interactions and to compare predicted and measured chemical shifts. No buffer was used for the experiments due to solubility limitations in S0. However, the pD in D2O and the apparent pD (pD*) in S0 were monitored before and after all reactions.
NMR tubes were filled with 600 μL of 0.015 mol·dm−3 sodium pyruvate in S0 (pD* = 6.8) and cooled in an acetone/dry ice bath (−78 °C) to approximately −40 °C. Then 21 μL of H2O2 (7 mol·dm−3, stored on ice before injection) was added to this solution, which resulted in a final concentration of 0.15 mol·dm−3 D2O2, that is, a ratio of D2O2/pyruvate = 10/1. The cooled NMR tubes were shaken several times to allow homogeneous distribution of D2O2 and were then quickly inserted into the NMR probe. Control experiments revealed that the reaction of pyruvate with D2O2 at −40 °C is relatively slow; that is, keeping the initial solution temperature at −40 °C allowed for delaying the reaction during the time required to prepare the NMR instrument for measurement. The reaction was then started by increasing the temperature of the solution in the NMR probe to the desired value.
Measurement of the exact sample temperature in the NMR instrument was crucial for calculation of the kinetic parameters. Because of air fluctuations, the real sample temperature may differ significantly from the one measured by the internal probe of the NMR.22 It is therefore common practice to calibrate the exact sample temperature from the chemical shifts of a methanol standard (4%/96% CH3OH/CD3OD).22–24 The temperature was measured before and after the experiments with a separate sample of that methanol standard. The methanol standard allowed calculation of the exact temperature by the difference of the proton chemical shifts (Δproton signal) of the methyl and hydroxyl groups of methanol according to
| (1) |
The uncertainty of temperature measuring in the internal probe did not allow to run multiple experiments at exactly the same temperature, that is, to repeat experiments at identical temperatures. Hence, multiple experiments were performed around a desired temperature and all data were used for kinetic interpretations.
Methanol/water mixtures can form large clusters of unmixed methanol or water at low temperatures.25 In a water cluster, the pyruvate concentration may be significantly higher as compared to a cluster of methanol. However, the formation of such clusters was not taken into account in our kinetic analysis as they occur in less than 1% of the solution volume at the temperatures used for our experiments.25 The reaction kinetics of formation and disappearance of the different species were followed at temperatures between −35 and −10 °C. The kinetics could not be recorded at temperatures below −35 °C as this temperature is close to the freezing temperature of S0, which is about −40 °C for a 50% (v/v) methanol/water solution.26 Here, the increased viscosity of the solution resulted in significant peak broadening and loss of the NMR lock signal. Above −10 °C, the reactions were too fast to allow the quantification of intermediate species formed during the reaction.
The chemical shifts of substrates, intermediates, and products were determined by heteronuclear multiple-bond correlation (HMBC) except for one-dimensional (1-D) 13C NMR spectroscopy for the reference spectra of CO2, sodium methyl bicarbonate, and sodium carbonate, as these molecules are not visible in an HMBC spectrum. All experimental chemical shifts are summarized in Table 1. One-dimensional 13C NMR spectroscopy was also used to record the C3 signal of non-enriched pyruvate. For all kinetic data, 1-D 13C NMR spectra were recorded.
Table 1.
HMBC Chemical Shifts
| compd | experimental chemical shift, ppm
|
||
|---|---|---|---|
| 13C1 | 13C2 | 1Ha | |
| pyruvate | 170.0 | 204.9 | 2.3 |
| hydrate | 178.4 | 93.7 | 1.4 |
| dimer | 182.1 | 73.4 | 1.3 |
| hemiacetal | 177.9 | 99.2 | 2.9 |
| acetal | 174.0 | 101.4 | 2.9 |
| intermediate | 177.3 | 102.9 | 2.8 |
| acetate | 181.8 | 3.3 | |
Refers to protons at C3 of pyruvate and its derivatives or at C2 of acetate.
Pyruvate was distinguished from its hydrate and dimer forms by variation of the pD. In aqueous solutions of pH < 2.2, the hydrate (Chart 1, structure 2) is the predominant species.18 Therefore, a reference spectrum for the hydrate was recorded in D2O at pD < 2 (adjusted with 1 mol·dm−3 DCl). To obtain sufficient quantities of the dimer of pyruvate, the pD of a D2O solution of pyruvate was adjusted to pD > 12 by the addition of 1 mol·dm−3 NaOD.15
In the presence of methanol, the formation of a hemiacetal or acetal was observed (Chart 1, structures 4 and 5). In order to confirm the structure of the hemiacetal, the fraction of methanol in the solution S0 was varied between 0% and 75%, where the amount of hemiacetal formed was expected to increase with increasing methanol content. In order to generate the full acetal form, 5 μL of 1 mol·dm−3 DCl was added to the pyruvate in S0 solution.27
Kinetic NMR Measurements and Fitting of the Experimental Data
Kinetic data were acquired by recording 1-D 13C NMR spectra with inverse gated 1H decoupling at a rate of 4 scans/2 min for one data point every 2 min over the time of the experiment. To obtain full spectra, the spectral width and offset were set to 160 and 115 ppm for acquisition of the signal from 13C1-pyruvate and to 190 and 125 ppm for that from 13C2-pyruvate. To enable quantitative integration, the interscan delay was set to 25 s, which is greater than 5 times the 13C longitudinal relaxation time constant for these carbons.
The instrument was tuned and matched before each experiment to 500 MHz for the proton signal and 125.7 MHz for the carbon signal. The 90° pulse was set to 17.5 μs after calibrating the null value of the 360° pulse to 70 μs. The NMR was locked and shimmed to the D2O signal for all experiments. The samples were not spun in order to avoid uneven spin rates occurring during the extended experiment time, which may interfere with signal quality.
The probe was set to the desired temperature at least 10 min before the initial experiment. The samples were adjusted to that temperature within the time required to prepare the instrument for measurement after the sample was inserted into the NMR. To quantitate the amounts of hemiacetal, hydrate, and acetal, a total of 64 scans were acquired at a rate of 2 scans/min.
The concentration of each species for the kinetic data was calculated according to
| (2) |
where A is the area of the NMR signal of the species X, S is the sum of the areas of the NMR signals of all the different detected species, and C0 is the initial concentration of pyruvate.
Because of the low abundance of the dimeric and hydrated forms of pyruvate at near-neutral pD*, the kinetics of formation and disappearance of these species were not recorded. The kinetic traces of pyruvate (A), intermediate (I), hemiacetal (D), and products (P) were fitted according to the reactions presented in Scheme 2. The system of differential equations describing this reaction scheme is summarized in eqs 3–6. In these differential equations, the variables are defined as follows: [A] = pyruvate concentration, [B]0 = initial D2O2 concentration, [I] = intermediate concentration, [C]0 = initial methanol concentration, and [D] = hemiacetal concentration. For the fitting procedure, a program was written in Python language based on the implemented open Python library “odeint” for numerically solving the differential equation system. The program is provided in Supporting Information.
Scheme 2.

Reaction Pathway on Which Calculation of Kinetic Data Is Based
| (3) |
| (4) |
| (5) |
| (6) |
Density Functional Theory Calculations
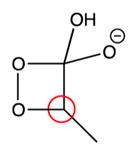
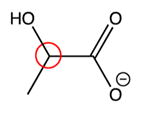
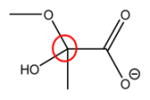
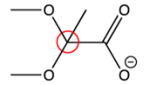
The 13C chemical shifts of the C2 atom of pyruvate and of the respective carbon atoms within the reaction products were calculated by density functional theory (DFT). The isolated geometry optimization and frequency calculations were carried out with the B3LYP/6-31G(d) level basis set with the hybrid Hartree–Fock (HF)–DFT procedure implemented in the Gaussian software package. After optimization of the neutral structures, a negative charge was added in order to account for the ionic forms used during the experiments. The geometries of the negatively charged structures were reoptimized in a water polarizable continuum model (PCM) using a tight (convergence threshold for iterative calculations of PCM polarization charges is 10−9) self-consistent solvent field at the B3LYP/6-31G(d) level. The 13C chemical shifts were obtained as follows: A single point energy of the negatively charged optimized structures was calculated for each structure in a methanol continuum at the B3LYP/6-31G(d) level. The NMR shielding tensors were computed with the gauge-independent atomic orbital (GIAO) method. The tetramethylsilane (TMS) structure was optimized by the same methodology. Optimization of the geometry of TMS showed a tetrahedral symmetry, ensuring that the tensors of the four methyl groups were the same. The 13C chemical shifts of the structures presented in Table 2 were calculated by subtracting the calculated shielding tensor value of TMS from the calculated shielding tensor values of each of the optimized structures.21
Table 2.
DFT Predicted and Experimental 13C2 NMR Shiftsa
| Structure | Computed 13C chemical shifts | Experimental 13C chemical shifts |
|---|---|---|
|
196 ppm | 204.9 ppm |
|
93 ppm | 93.7 ppm |
|
102 ppm | 102.9 ppm |
|
92 ppm | n.o.* |
|
68 ppm | 67.3 ppm |
|
95 ppm | 99.2 ppm |
|
98 ppm | 101.4 ppm |
n.o. = not observed.
In addition, some chemical shifts were predicted by use of the ChemDraw predictor. This empirical method was used for assignment of the 13C1 shift of pyruvate and the respective carbon atoms of the reaction products. These data are summarized in Table 3.
Table 3.
ChemDraw Predicted and Measured 13C Chemical Shifts of Product Standards
| position | acetate C1 | carbon dioxide | bicarbonate | methyl carbonate C1 | dimer C1 | dimer C2 |
|---|---|---|---|---|---|---|
| measured, ppm | 181.8 | 126.2 | 161.7 | 162.0 | 182.1 | 73.4 |
| predicted, ppm | 173.2 | 124.2 | 166.0 | 161.0 | 183.0 | 78.0 |
RESULTS
The HMBC and 13C NMR data for the observed species are listed in Table 1 and the HMBC spectra are shown in Figures 1–4.
Figure 1.

HMBC data of a 1:1 mixture (0.015 dm3·mol−1) of 13C1 and 13C2 enriched sodium pyruvate in 99.8% D2O/0.2% H2O at near-neutral pD*. The spectrum was recorded at room temperature; frequency 1 (f1), carbon chemical shift in ppm; frequency 2 (f2), hydrogen chemical shift.
Figure 4.

HMBC spectrum of a 1:1 mixture of 13C1- and 13C2-enriched sodium pyruvate (0.015 dm3·mol−1) in S0 at pD* <2. The spectrum was recorded at room temperature; frequency 1 (f1), carbon chemical shift in ppm; frequency 2 (f2), hydrogen chemical shift.
Characterization of Intermediate
The incubation of pyruvate with D2O2, D2O, and methanol leads to changes of the chemical shifts of 13C signals at the original C2 positions, resulting in differences larger than 100 ppm compared to the original pyruvate. This reveals that the reaction with D2O2, D2O, and methanol resulted in significant changes in the bonding characteristics around the original C2. Instead, only small differences of the chemical shifts at the pyruvate C2 position were observed between the hydrate, hemiacetal, and the intermediate I (variation of less than 6 ppm), indicating similar bonding characteristics at C2 for these species.
The changes of the 13C1 chemical shifts were all in a range of less than 10 ppm between pyruvate and its products, except for CO2, which showed a significant upfield shift. These minor shift changes indicate that none of the initial modifications occurred directly on the original carboxyl group of pyruvate during formation of the intermediate. In addition, no significant variation of the 13C3 chemical shifts was observed (less than 5 ppm), indicating no direct modification of the methyl group (data not shown).
After the addition of hydrogen peroxide to pyruvate in S0 at ca. −40 °C and warming of the solution to −35 °C, the formation of an intermediate was observed by HMBC spectroscopy. Figure 3 displays a representative HMBC spectrum recorded after the reaction of D2O2 in S0 with a 1:1 mixture of 13C1- and 13C2-enriched pyruvate. Cross peaks at 2.8 ppm frequency (f)2 (1H), 102.9 f1 (13C) ppm for C2 and 2.8 ppm f2, 178.3 f1 ppm for C1 in the HMBC spectrum were assigned to intermediate I (Chart 1, structure 12), consistent with the structure of 2-deuteroperoxy-2-deuteroxypropanoate. The assignment of the chemical shifts is supported by DFT calculations, which are summarized in Table 2. Importantly, the addition of peroxide anion to C2 caused only minor changes of the chemical shifts at C1 and C3, where the latter assignments are based on non-13C-enriched pyruvate. Intermediate I could not be observed well by NMR at temperatures above −10 °C due to its very fast breakdown.
Figure 3.

HMBC spectrum of a 1:1 mixture of 13C1 and 13C2-enriched sodium pyruvate (0.015 dm3·mol−1) in S0 ca. 30 min after the addition of 0.15 dm3·mol−1 hydrogen peroxide at near-neutral pH and −35 °C. Frequency 1 (f1), carbon chemical shift in ppm; frequency 2 (f2), hydrogen chemical shift.
Characterization of Reactants
Hydrate, Dimer, and Enol
The HMBC spectra recorded for pyruvate in D2O (pD* = 6.8; Figure 1) revealed three different species consistent with the presence of pyruvate, the hydrate, and the dimer form of pyruvate. Under near-neutral conditions the hydrate accounted for 6% ± 4% of the total pyruvate content (Table 4), while under acidic conditions (pD* < 2) the hydrate increased to 69% ± 3% of the total pyruvate content (Table 5).
Table 4.
Influence of Methanol-d4 Concentration in D2O on Hemiacetal Formation at Neutral pD*
| sample | pyruvate (%) | hemiacetal (%) | hydrate (%) |
|---|---|---|---|
| 0% methanol-d4 | 94 ± 4 | 0 | 6 ± 4 |
| 25% methanol-d4 | 90 ± 3 | 7 ± 2 | 3 ± 1 |
| 50% methanol-d4 | 85 ± 5 | 10 ± 3 | 5 ± 3 |
| 75% methanol-d4 | 85 ± 5 | 13 ± 3 | 3 ± 1 |
Table 5.
Hemiacetal and Full Acetal Formation under Acidic Conditions (pD* < 2) at Various Methanol-d4 Concentrations in D2O
| sample | pyruvate (%) | hemiacetal (%) | acetal (%) | hydrate (%) |
|---|---|---|---|---|
| 0% methanol-d4 | 31 ± 3 | 0 | 0 | 69 ± 3 |
| 25% methanol-d4 | 19 ± 4 | 38 ± 11 | 4 ± 3 | 39 ± 9 |
| 50% methanol-d4 | 18 ± 1 | 52 ± 2 | 14 ± 10 | 16 ± 10 |
| 75% methanol-d4 | 16 ± 1 | 60 ± 4 | 6 ± 1 | 19 ± 3 |
Under basic conditions (pD* > 12), only one species was observed in the HMBC spectra and no signal indicated the presence of pyruvate. The predicted chemical shifts and the fact that pyruvate readily dimerizes under basic conditions15 allowed the assignment of the spectral data to the dimer form. Only the 13C shifts of C1 and C2 were observable.
For the enol form of pyruvate, a 13C2 chemical shift was predicted in the range of 110 ppm (Table 3). A signal in this region was not observed during our experiments, and therefore, enolic structures of pyruvate were not present at significant yields under our conditions. In fact, at neutral pH the enol is known to form at rather low yield (K = [enol form]/[keto form] = 8.2 × 10⁻⁶) and would further react to generate the dimeric structure of pyruvate.28
Hemiacetal and Acetal
A comparison of the HMBC data of pyruvate in two solvents, D2O and S0, revealed that an additional product was formed in the presence of methanol. The new product had 13C2 and 13C1 chemical shifts at 99.2 and 177.9 ppm, respectively (Figure 2). Similar chemical shifts were recorded when methanol in S0 was substituted with ethanol or ethylene glycol (data not shown). These findings indicate that, in the presence of an alcohol, pyruvate formed a hemiacetal structure. Integratable 13C NMR spectra of 13C1- and 13C2- enriched pyruvate in the presence of various fractions of methanol (Table 4) were recorded in order to confirm that increasing methanol concentrations led to increasing amounts of hemiacetal, while the levels of unmodified pyruvate and hydrate decreased. These results show that the equilibrium is shifted toward the hemiacetal form at higher methanol concentrations.
Figure 2.

HMBC spectrum of a 1:1 mixture (0.015 dm3·mol−1) of 13C1- and 13C2-enriched sodium pyruvate in S0 at near-neutral pD*. The spectrum was recorded at room temperature; frequency 1 (f1), carbon chemical shift in ppm; frequency 2 (f2), hydrogen chemical shift.
Formation of the full acetal requires acid catalysis.27 Hence, acidic conditions permit us to distinguish the hemiacetal from the full acetal (see Chart 1, structures 4 and 5). Under acidic conditions, pD* < 2, HMBC spectra of 13C2- and 13C1-enriched pyruvate in S0 showed new 13C2 and 13C1 signals at 101.4 and 174.0 ppm, respectively (Figure 4), which were assigned to the full acetal structure. The full acetal concentration increased with increasing methanol content up to 50% (Table 5). A further increase of methanol to 75% did not result in a further increase in acetal formation, which may be caused by the change in solvent composition.
Characterization of Reaction Products
The final product monitored for the reaction of 13C2-enriched pyruvate with D2O2 was acetate, which was identified in the HMBC spectra. For the 13C1-enriched pyruvate, CO2 and DCO3− were identified by 1-D 13C NMR spectroscopy. Especially bicarbonate reacted with methanol to yield methyl carbonate (Chart 1, structure 10). Non-13C-enriched CO2 purged into S0 showed one signal at 125 ppm. The 13C-enriched bicarbonate standard in D2O showed only one peak at 161.7 ppm, while in S0 two peaks at 161.7 and 162.0 ppm were observed, consistent with the formation of methyl carbonate. The chemical shift assignments for CO2 and bicarbonate were supported by the 13C chemical shift predictions generated in ChemDraw. Additional HMBC spectra were taken after the sample was adjusted to room temperature, indicating that the dimer form of pyruvate is inert to D2O2.
Density Functional Theory Calculations and Experimental Results
Assignment of the 13C2 chemical shifts to the individual structures was supported by DFT calculations, as described above. The predictions were limited by the fact that the NMR lock signal for S0 was calibrated to a pure D2O signal, which differs from the lock signal of a solvent mixture. In addition, the chemical environment of acidic S0 differed from neutral S0 due to the high ionic species concentration. Also, DFT calculations were based on the TMS signal (0 ppm) while the lock signal was calibrated to D2O. The HMBC could not be calibrated to the 13C signal of methanol since HMBC NMR is omitting the one-bond signal of adjacent carbon–proton and shows only multibond signals.
The data in Table 2 compare the DFT-calculated with the experimental 13C2 chemical shifts of pyruvate, intermediate I, and reaction products. The predicted value (102 ppm) for I agrees very well with the experimental value (102.9 ppm). The calculated 13C2 chemical shifts of hydrate, hemiacetal and full acetal were generally 2–4 ppm lower than the experimental data.
Exclusion of Alternative Reaction Pathways
Under acidic (pD* < 2) conditions, D2O2 can react with acetic acid, potentially forming peroxyacetic acid.29,30 Therefore, all solvents used and the available product standards (acetate and bicarbonate) for this reaction were tested for any possible reaction with D2O2. No changes of the NMR spectra were observed before and after addition of D2O2 to the solvents and product standards at −30 °C and room temperature over a 24 h time frame.
Lactic Acid
Lactic acid was tested as a model for the pyruvate carboxylate group, since the structure of lactic acid differs from pyruvic acid only at the C2 position, where it contains a hydroxyl group and a hydrogen instead of a carbonyl group. The effects of water, methanol, and D2O2 on lactic acid were tested by NMR and no changes were detected, demonstrating the inertness of the lactic acid carboxyl group toward these reactants under our experimental conditions. In the same manner, the hydrate and hemiacetal as well as the dimer form of pyruvate appear to be rather inert toward D2O2 attack.
Kinetics
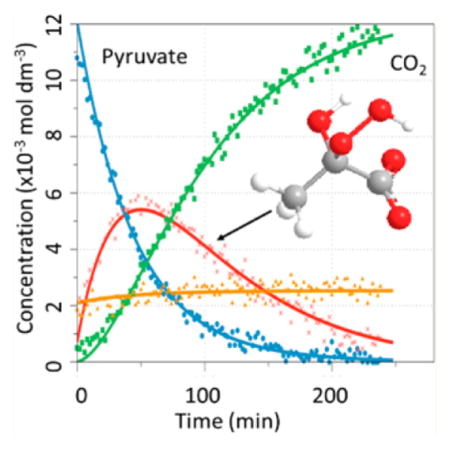
Figure 5 shows a representative 1-D 13C NMR spectrum obtained during the kinetic measurement for reaction of pyruvate with D2O2 at t = 34 min. At this time point the NMR frequencies of all species that are included in the kinetic fits are visible in the NMR spectrum. On the basis of the data in Table 2, the 13C chemical shifts were assigned to the individual species. For T = −35 °C, the integrated values of the individual 13C signals were plotted versus time as shown in Figure 6. At t = 0, the signal of the hemiacetal is present, consistent with equilibration between pyruvate and hemiacetal during preparation of the reaction mixture. Even at −35 °C, 2-deuteroperoxy-2-deuteroxypropanoate (I) formed rather quickly so that a significant fraction of this intermediate is present already at the time when the first NMR spectrum is recorded. In Figure 6, the concentration of intermediate I reached a maximum after ca. 40 min with a concentration of about 5.5 × 10⁻³ mol·dm−3. The reaction product CO2 (DCO3− and methylcarbonate) was monitored for 13C1-enriched pyruvate, and the integrated signal intensities of these products were added as they all referred to the same 13C atom. The reaction product acetate was monitored for 13C2-enriched pyruvate. Figure 7 shows the integrated values for an experiment run at −13.94 °C. Under these conditions, intermediate I had already formed to significant extent when the first NMR spectrum was recorded, and also the final product was already present at this time. The entire reaction was completed within 30 min.
Figure 5.

Representative 1-D 13C NMR spectrum of 13C2-enriched pyruvate in S0 after 34 min of reaction with hydrogen peroxide at −33.6 °C (pD* = 6.8).
Figure 6.
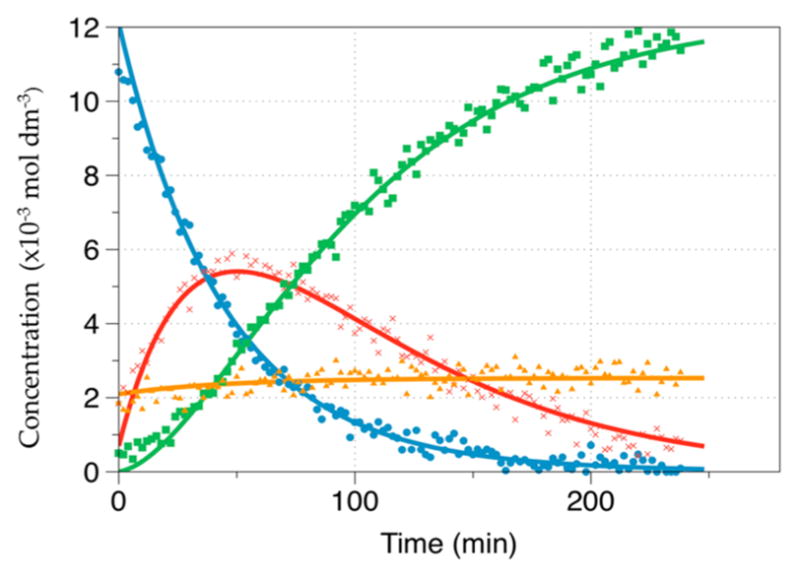
Signal intensities vs time during reaction of 13C1-enriched pyruvate with D2O2 at −34.85 °C. Pyruvate (●, blue); CO2 (■, green); hemiacetal (▲, orange); intermediate ( ×, red).
Figure 7.
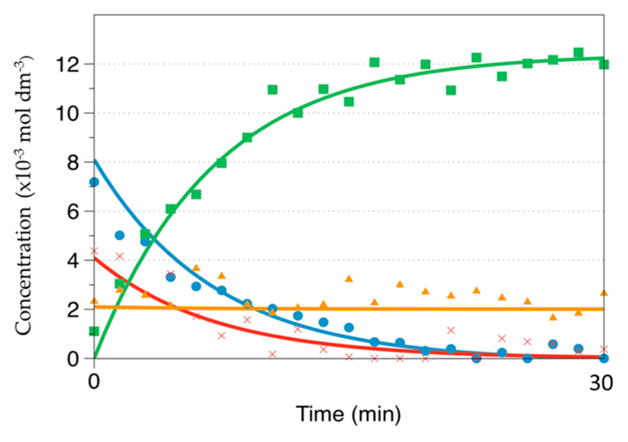
Signal intensities vs time during the reaction of 13C1-enriched pyruvate with D2O2 at −13.94 °C. Pyruvate (●, blue); CO2 (■, green); hemiacetal (▲, orange); intermediate ( ×, red).
During all experiments the pD* slightly decreased by an average of ca. 0.5 unit over the entire reaction time, even though the product acids (acetic and carbonic acid) are weaker acids than pyruvic acid. This can be accounted for by the formation of two new acids out of one. However, this pD* shift does not significantly affect the protonation state of pyruvate.
Stability of Hemiacetal
The hemiacetal appears to be inert toward D2O2 at −35 °C (see Figure 6). This is likely due to very slow elimination of CD3OD from the hemiacetal at pD* = 6.8. However, after the reaction mixture was heated to room temperature, the signals of the hemiacetal and 13C-enriched pyruvate disappeared, and only the acetate and dimer form were recorded in the NMR spectra, consistent with an equilibrium between hemiacetal and pyruvate and the complete reaction of D2O2 with pyruvate (see Figure S7 in Supporting Information).
Fitting of Kinetic Data
The rate constants were derived with a fitting procedure based on the reaction pathways shown in Scheme 2. This includes equilibria of pyruvate with methanol and D2O2, intermediate I, and formation of the final products. Not included were equilibria of pyruvate with its hydrate and formation of its dimer form, as these species were not detected at significant levels during kinetic measurements under our experimental conditions. The equilibria between CO2 and bicarbonate and methyl carbonate were not relevant for the reaction mechanism under investigation, and the sum of these three integrals was treated as one product similar to acetate. The full acetal was not included in the fitting since under neutral reaction conditions the full acetal was not formed to a significant extent.
The rate constants calculated for the reactions at different temperatures are shown in Table 6. The compilation of rate constants in Table 6 shows significant variability for the values of k1 and k2, especially for the low (≤−33 °C) and higher (≥−19.18 °C) temperatures. This is not entirely unexpected, based on the fast formation of intermediate I at higher temperatures and the fact that a fraction of intermediate I is present in the solution at the time of the first NMR measurement even at low temperatures. The latter is likely due to formation of intermediate I during the time required for warming the sample to the desired temperature from −40 °C. These effects are compounded by uncertainties in the quantitative NMR measurements. In contrast, the values for k3 show a clear trend of increased values with increasing temperature. Representative fits for two temperatures are displayed in Figures 6 and 7, while the fitting of analogous traces for other temperatures is shown in Figures S1–S6 in Supporting Information. At temperatures above −20 °C, the back reaction to form pyruvate from the intermediate became negligible. The breakdown of I is defined by the rate constant k3, which is of first order.
Table 6.
Compilation of Rate Constants for Reaction of Pyruvate with D2O2 in S0 with 13C1- and 13C2-Enriched Pyruvatea
| temp (°C) | k1 (dm3·mol−1·s−1) | k2 (s−1) | k3 (s−1) | k4 (dm3·mol−1·s−1) | k5 (s−1) |
|---|---|---|---|---|---|
| −13.94b | 1.34 × 10⁻² | <2.92 × 10⁻⁹ | 4.99 × 10⁻³ | 3.50 × 10⁻⁷ | 7.23 × 10⁻⁵ |
| −19.18b | 2.45 × 10⁻³ | <1.00 × 10⁻⁹ | 2.87 × 10⁻³ | 9.06 × 10⁻⁸ | <1.00 × 10⁻⁹ |
| −25.52c | 1.87 × 10⁻² | 1.46 × 10⁻³ | 5.82 × 10⁻⁴ | <1.00 × 10⁻⁹ | <1.00 × 10⁻⁹ |
| −28.20b | 4.33 × 10⁻³ | 3.44 × 10⁻⁴ | 7.66 × 10⁻⁴ | 2.29 × 10⁻⁷ | <1.00 × 10⁻⁹ |
| −31.21c | 3.30 × 10⁻³ | 2.39 × 10⁻⁴ | 5.81 × 10⁻⁴ | 5.40 × 10⁻⁸ | <1.00 × 10⁻⁹ |
| −33.19b | 3.13 × 10⁻³ | 8.67 × 10⁻⁴ | 3.77 × 10⁻⁴ | 1.22 × 10⁻⁷ | <1.00 × 10⁻⁹ |
| −33.64c | 6.48 × 10⁻³ | 2.81 × 10⁻⁴ | 3.92 × 10⁻⁴ | 1.33 × 10⁻⁷ | <1.00 × 10⁻⁹ |
| −34.85b | 2.43 × 10⁻³ | 6.87 × 10⁻⁶ | 2.58 × 10⁻⁴ | 8.77 × 10⁻⁸ | <1.00 × 10⁻⁹ |
Values for k were obtained by kinetic fitting as described in the Experimental Section. Calculated values below 10−9 were rejected by the program because they were considered too low to be significant.
C1 pyruvate data.
C2 pyruvate data.
The breakdown (k5) of the hemiacetal followed first-order kinetics. The values of k5 were below the reasonable minimum value for calculations for temperatures below −14 °C. This led to the conclusion that the hemiacetal structure is apparently inert toward D2O2 under experimental conditions.
By use of eq 7, ln(kh/κkBT) was plotted versus 1/T (Figure 8), where the rate constants were taken from Table 6, h = 6.626 97 × 10−34J·s, κ = 1, kB = 1.3807 × 10⁻²³ J/K, R = 8.314 J/(K·mol), and T = measured temperature in kelvins. For the formation and breakdown of intermediate I, the entropy ΔH‡ was calculated by multiplying the negative slope by R and the enthalpy ΔS‡ was calculated by multiplying the intercept value by R. All values are summarized in Table 7.
Figure 8.
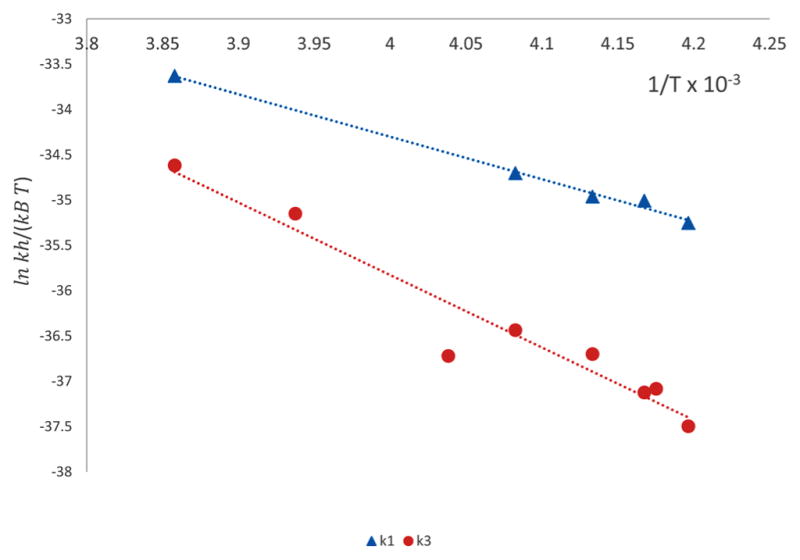
Eyring plot of dependence of k1 (▲, blue) and k3 (●, red) on temperature. Linear regression was performed and k values were rejected that led to a p-value above 0.05. For k1, values at temperatures −19.18, −25.52, and −33.64 °C were rejected, because the p-value exceeded 0.05. For k3, no values were rejected.
Table 7.
Entropy, Enthalpy, and Gibbs Free Energy of Activation for k1 and k3
| parameter | k1 | k3 |
|---|---|---|
| slope | −4686.0 | −8000.3 |
| intercept | −15.56 | −3.83 |
| ΔH‡, kJ/mol | 38.96 | 66.51 |
| ΔS‡, J/mol·K | −129.34 | −31.84 |
| ΔG‡ at 298 K, kJ/mol | 42.81 | 67.46 |
| (7) |
Exclusion of Dioxetane Formation
An alternative potential intermediate generated between the reaction of D2O2 and pyruvate would be a dioxetane (Chart 1, structure 11). However, for a dioxetane we would expect a significant change of the 13C1 chemical shift due to covalent bonding of an additional oxygen, as predicted with ChemDraw. The HMBC spectra showed no significant changes of the 13C1 chemical shifts, indicating that no dioxetane was formed. The NMR spectra recorded with 13C1-enriched pyruvate showed the formation of carbon dioxide first.
DISCUSSION
Characterization of Intermediate
The reaction pathway displayed in Scheme 1 had been proposed earlier, but no experimental data were available regarding the nature of intermediate I.8–10 By low-temperature NMR spectroscopy it is now possible to assign a structure to I by means of the chemical shifts observed in the HMBC spectrum. For elucidation of the structures, the carbon signals of pyruvate at position C2 were of particular interest, as the most significant structural changes during the reaction mechanism were expected at this position. Major changes of the 13C1 signal occurred only after the breakdown of intermediate I to the reaction products, that is, formation of CO2.
Comparison of predicted and measured chemical shifts of the known standards indicated that the DFT prediction was appropriate to assign the structure to the experimental values (Table 2), since these values differed less than 4 ppm and showed the same trends.
The 13C chemical shift correlates with the electron density provided by the substituents attached to the carbon, where the shielding effect of -OD, -OCD3, and -OOD is expected to decrease in this order.27 Our experimental data show that the 13C2 chemical shifts of pyruvate increased in the order hydrate (-OD group), hemiacetal (–OCD3 group), and intermediate (-OOD group), consistent with this expectation.
These facts support the assignment of the chemical shifts shown in Table 2 to the respective structures, and this leads to the conclusion that the intermediate structure is, in fact, identical with the proposed 2-deuteroperoxy-2-deuteroxypropanoate8 (Chart 1, structure 12).
Reaction Mechanism
Formation of Intermediate by Hydrogen Peroxide and Pyruvate
Our results support the hypothesis put forward in the literature,8,10,31 where the first step of the reaction, between D2O2 and pyruvate is the formation of 2-deuteroperoxy-2-deuteroxypropanoate. This first step is reversible, similar to the hydration of pyruvate or the formation of the hemiacetal13 or the formation of 2-hydroperoxy-2-hydroxyacetate from glyoxylate and hydrogen peroxide.11
The enthalpy of activation (ΔH‡) for formation of I is 38.96 kJ/mol. The entropy of activation for formation of I (ΔS‡) is −129.34 J/(mol·K). This very low value shows that the transition state of the formation of the intermediate is a highly ordered system. As shown in Scheme 1, the attack of D2O2 occurs at the back site of the carbonyl group of the pyruvate.
Breakdown Mechanism
Breakdown of the intermediate can be considered as a concerted step, as shown in Scheme 1. A comparable mechanism occurs when 2-hydroperoxy-2-hydroxyacetate yields formate, carbon dioxide, and water.11 The decarboxylation step appears to be similar to the enzymatic decarboxylation of pyruvate through pyruvate dehydrogenase, to yield acetyl-CoA, or through pyruvate decarboxylase, yielding acetaldehyde.32,33 For the enzymatic pathway, after a nucleophilic attack on the C2 position of pyruvate through the 4-amino-C2-carbanion thiamin pyrophosphate (TTP),32 intermediate 4-imino-2-(2-hydroxypropionyl)-TTP is formed.32 For the decarboxylation, a negative charge on the carboxylate group needs to be transferred to the C2 position by breaking the bond between C1 and C2 of pyruvate and releasing carbon dioxide. During the enzymatic decarboxylation, the free electron pair creates a new double bond in the same manner as during the peroxide degradation pathway. For the enzymatic pathway this is a carbon–carbon double bond, and for the peroxide-dependent pathway it is a carbon–oxygen double bond.
The enthalpy of activation (ΔH‡) for the breakdown is 66.51 kJ/mol. This can be attributed to the several bonds broken during the breakdown step. The entropy of activation for this step is −31.84 J/(mol·K). This value indicates the formation of several product molecules out of one substrate molecule. In fact one intermediate is converted to acetate, CO2, and D2O.
CONCLUSION
Low-temperature NMR experiments allow us to deconvolute the reaction of pyruvate with D2O2 into individual steps that permit us to characterize a key intermediate and measure individual rate constants.
Supplementary Material
Acknowledgments
We gratefully acknowledge financial support by the National Institute for Pharmaceutical Technology and Education (NIPTE) and by The University of Kansas. Support for the NMR instrumentation was provided by NSF Major Research Instrumentation Grant 9977422 and NIH Center Grant P20GM103418. We thank Dr. V. J. Stella for many helpful discussions and Dr. J. Douglas for advice during development of the NMR protocols.
Footnotes
Notes
The authors declare no competing financial interest.
Python program script; seven figures showing signal intensities vs time during reaction of 13C1- and 13C2-enriched pyruvate with D2O2 at various temperatures and HMBC spectrum after complete reaction of 13C2-enriched sodium pyruvate with D2O2. This material is available free of charge via the Internet at http://pubs.acs.org.
References
- 1.Halliwell B. Reactive Oxygen Species and the Central Nervous System. J Neurochem. 1992;59:1609–1623. doi: 10.1111/j.1471-4159.1992.tb10990.x. [DOI] [PubMed] [Google Scholar]
- 2.Desagher S, Glowinski J, Premont J. Pyruvate Protects Neurons against Hydrogen Peroxide-Induced Toxicity. J Neurosci. 1997;17:9060–9067. doi: 10.1523/JNEUROSCI.17-23-09060.1997. [DOI] [PMC free article] [PubMed] [Google Scholar]
- 3.Chance B, Sies H, Boveris A. Hydroperoxide Metabolism in Mammalian Organs. Physiol Rev. 1979;59:527–605. doi: 10.1152/physrev.1979.59.3.527. [DOI] [PubMed] [Google Scholar]
- 4.Andrae U, Singh J, Ziegler-Skylakakis K. Pyruvate and Related Alpha-Ketoacids Protect Mammalian Cells in Culture against Hydrogen Peroxide-Induced Cytotoxicity. Toxicol Lett. 1985;28:93–98. doi: 10.1016/0378-4274(85)90015-3. [DOI] [PubMed] [Google Scholar]
- 5.Giandomenico AR, Cerniglia GE, Biaglow JE, Stevens CW, Koch CJ. The Importance of Sodium Pyruvate in Assessing Damage Produced by Hydrogen Peroxide. Free Radical Biol Med. 1997;23:426–434. doi: 10.1016/s0891-5849(97)00113-5. [DOI] [PubMed] [Google Scholar]
- 6.Salahudeen AK, Clark EC, Nath KA. Hydrogen Peroxide-Induced Renal Injury. A Protective Role for Pyruvate in Vitro and in Vivo. J Clin Invest. 1991;88:1886–1893. doi: 10.1172/JCI115511. [DOI] [PMC free article] [PubMed] [Google Scholar]
- 7.Wasylaschuk WR, Harmon PA, Wagner G, Harman AB, Templeton AC, Xu H, Reed RA. Evaluation of Hydroperoxides in Common Pharmaceutical Excipients. J Pharm Sci. 2007;96:106–116. doi: 10.1002/jps.20726. [DOI] [PubMed] [Google Scholar]
- 8.Aleksankin MM, Vysotskaya NA, Brodskii AE. Mechanism of the Oxidation of Pyruvic Acid, Phenol, and Salicylaldehyde with Hydrogen Peroxide with Isotopes. Kernenergie. 1962;5:362–365. [Google Scholar]
- 9.Hamilton GA. Proton in Biological Redox Reactions. Prog Bioorg Chem. 1971;1:83–157. [Google Scholar]
- 10.Melzer E, Schmidt HL. Carbon Isotope Effects on the Decarboxylation of Carboxylic Acids. Comparison of the Lactate Oxidase Reaction and the Degradation of Pyruvate by H2O2. Biochem J. 1988;252:913–915. doi: 10.1042/bj2520913. [DOI] [PMC free article] [PubMed] [Google Scholar]
- 11.Leitzke A, Reisz E, Flyunt R, von Sonntag C. The Reactions of Ozone with Cinnamic Acids: Formation and Decay of 2-Hydroperoxy-2-Hydroxyacetic Acid. J Chem Soc Perkin Trans 2. 2001;5:793–797. [Google Scholar]
- 12.Leitzke A, Flyunt R, Theruvathu JA, von Sonntag C. Ozonolysis of Vinyl Compounds, CH2=CH-X, in Aqueous Solution: The Chemistries of the Ensuing Formyl Compounds and Hydroperoxides. Org Biomol Chem. 2003;1:1012–1019. doi: 10.1039/b212194h. [DOI] [PubMed] [Google Scholar]
- 13.Sander EG, Jencks WP. General Acid and Base Catalysis of the Reversible Addition of Hydrogen Peroxide to Aldehydes. J Am Chem Soc. 1968;90:4377–4386. [Google Scholar]
- 14.Lechtken P, Yekta A, Turro NJ. Tetramethyl-1,2-Dioxetane. Mechanism for an Autocatalytic Decomposition. Evidence for a Quantum Chain Reaction. J Am Chem Soc. 1973;95:3027–3028. [Google Scholar]
- 15.Margolis SA, Coxon B. Identification and Quantitation of the Impurities in Sodium Pyruvate. Anal Chem. 1986;58:2504–2510. [Google Scholar]
- 16.Cooper AJL, Redfield AG. Proton Magnetic Resonance Studies of [Alpha]-Keto Acids. J Biol Chem. 1975;250:527–532. [PubMed] [Google Scholar]
- 17.Socrates G. Kinetic Study of Nuclear Magnetic Resonance. J Chem Educ. 1967;44:575–576. [Google Scholar]
- 18.Pocker Y, Meany JE, Nist BJ, Zadorojny C. Reversible Hydration of Pyruvic Acid. I. Equilibrium Studies. J Phys Chem. 1969;73:2879–2882. [Google Scholar]
- 19.Von Korff RW. Purity and Stability of Pyruvate and [Alpha]-Ketoglutarate. Methods Enzymol. 1969;13:519–523. [Google Scholar]
- 20.Olek RA, Antosiewicz J, Popinigis J, Gabbianelli R, Fedeli D, Falcioni G. Pyruvate but Not Lactate Prevents NADH-Induced Myoglobin Oxidation. Free Radical Biol Med. 2005;38:1484–1490. doi: 10.1016/j.freeradbiomed.2005.02.018. [DOI] [PubMed] [Google Scholar]
- 21.Frisch MJ, Trucks GW, Schlegel HB, Scuseria GE, Robb MA, Cheeseman JR, Montgomery JA, Jr, Vreven T, Kudin KN, Burant JC, et al. Gaussian 03, Revision C.02. Gaussian, Inc; Wallingford, CT: 2004. [Google Scholar]
- 22.Findeisen M, Brand T, Berger S. A 1H-NMR Thermometer Suitable for Cryoprobes. Magn Reson Chem. 2007;45:175–178. doi: 10.1002/mrc.1941. [DOI] [PubMed] [Google Scholar]
- 23.Ammann C, Meier P, Merbach AE. A Simple Multinuclear NMR Thermometer. J Magn Reson. 1982;46:319–321. [Google Scholar]
- 24.Van Geet AL. Calibration of Methanol Nuclear Magnetic Resonance Thermometer at Low Temperature. Anal Chem. 1970;42:679–680. [Google Scholar]
- 25.Dougan L, Hargreaves R, Bates SP, Finney JL, Réat V, Soper AK, Crain J. Segregation in Aqueous Methanol Enhanced by Cooling and Compression. J Chem Phys. 2005;122(174514) doi: 10.1063/1.1888405. [DOI] [PubMed] [Google Scholar]
- 26.Haynes WM. CRC Handbook of Chemistry and Physics. 95. CRC Press; Boca Raton, FL: 2015. pp. 5–135. [Google Scholar]
- 27.Vollhardt KPC. Organic Chemistry: Structure and Function. 4. W. H. Freeman; New York: 2003. pp. 736–737. [Google Scholar]
- 28.Damitio J, Smith G, Meany JE, Pocker Y. A Comparative Study of the Enolization of Pyruvate and the Reversible Dehydration of Pyruvate Hydrate. J Am Chem Soc. 1992;114:3081–3087. [Google Scholar]
- 29.Zhao X, Zhang T, Zhou Y, Liu D. Preparation of Peracetic Acid from Hydrogen Peroxide: Part I: Kinetics for Peracetic Acid Synthesis and Hydrolysis. J Mol Catal A: Chem. 2007:246–252. [Google Scholar]
- 30.Dul’neva LV, Moskvin AV. Kinetics of Formation of Peroxyacetic Acid. Russ J Gen Chem. 2005;75:1125–1130. [Google Scholar]
- 31.Siegel B, Lanphear J. Iron-Catalyzed Oxidative Decarboxylation of Benzoylformic Acid. J Am Chem Soc. 1979;101:2221–2222. [Google Scholar]
- 32.Ciszak EM, Korotchkina LG, Dominiak PM, Sidhu S, Patel MS. Structural Basis for Flip-Flop Action of Thiamin Pyrophosphate-Dependent Enzymes Revealed by Human Pyruvate Dehydrogenase. J Biol Chem. 2003;278:21240–21246. doi: 10.1074/jbc.M300339200. [DOI] [PubMed] [Google Scholar]
- 33.Breslow R, McNelis E. Studies on Model Systems for Thiamine Action. Synthesis of Reactive Intermediates, and Evidence on the Function of the Pyrimidine Ring 1. J Am Chem Soc. 1959;81:3080–3082. [Google Scholar]
Associated Data
This section collects any data citations, data availability statements, or supplementary materials included in this article.