Abstract
For typical globular proteins, contacts involving aromatic side chains would constitute the largest number of distance constraints that could be used to define the structure of proteins and protein complexes based on NOE contacts. However, the 1H NMR signals of aromatic side chains are often heavily overlapped, which hampers extensive use of aromatic NOE cross peaks. Some of this overlap can be overcome by recording 13C-dispersed NOESY spectra. However, the resolution in the carbon dimension is rather low due to the narrow dispersion of the carbon signals, large one-bond carbon-carbon (C-C) couplings, and line broadening due to chemical shift anisotropy (CSA). Although it has been noted that the CSA of aromatic carbons could be used in TROSY experiments for enhancing resolution, this has not been used much in practice because of complications arising from large aromatic one-bond C-C couplings, and 3D or 4D carbon dispersed NOESY are typically recorded at low resolution hampering straightforward peak assignments. Here we show that the aromatic TROSY effect can optimally be used when employing alternate 13C labeling using 2-13C glycerol, 2-13C pyruvate, or 3-13C pyruvate as carbon source. With the elimination of the strong one-bond C-C coupling, the TROSY effect can easily be exploited. We show that 1H-13C TROSY spectra of alternately 13C labeled samples can be recorded at high resolution, and we employ 3D NOESY aromatic-TROSY spectra to obtain valuable intramolecular and intermolecular cross peaks on a protein complex.
Keywords: nuclear magnetic resonance, aromatic TROSY, alternate 13C labeling, 3D NOESY
Introduction
Studies of protein structure and dynamics by NMR rely heavily on resonance assignments and the structural restraints obtained from them. For structural studies in solution, the measurement of nuclear Overhauser effects (NOEs) between spin pairs (Solomon 1955) provides the most valuable data for calculating structures, although other parameters are increasingly used, such as chemical shifts (Cavalli et al. 2007; Cornilescu et al. 1999; Shen et al. 2009; Shen et al. 2008; Wishart et al. 1992), residual dipolar couplings (Tjandra and Bax 1997), paramagnetic relaxation enhancement (Battiste and Wagner 2000), and pseudocontact shifts (Su and Otting 2010). The number of short-distance contacts per amino acid residue is correlated with the size of the side chain and the position within a protein. Thus, most short distances that could be used for structure determination involve residues with large hydrophobic side chains. These include primarily methyl-bearing and aromatic residues. NOEs involving these residues can readily be assigned for small proteins (Wagner et al. 1987) and have been extensively used. However, when studying large proteins and protein complexes, such NOEs are found in crowded spectral regions and are increasingly difficult to assign even when using 3D and 4D spectroscopy of 13C/15N labeled proteins. Moreover, heavy deuteration has to be used for larger systems to reduce dipolar broadening (LeMaster 1989; LeMaster 1990a; LeMaster 1990b).
Much progress has been made in exploiting NOEs of methyl-bearing residues, such as isoleucines, leucines, valines, alanines, or thereonines, by using precursors for specific methyl groups for these residues (Ayala et al. 2012; Goto et al. 1999; Medek et al. 2000; Otten et al. 2010; Rosen et al. 1996; Ruschak and Kay 2009; Ruschak and Kay 2010; Velyvis et al. 2012). These procedures had great impact for studies of very large proteins (Frueh et al. 2008; Grishaev et al. 2008; Tugarinov et al. 2005). In contrast, measuring distances to aromatic side chains has been far less used since their signals are heavily overlapped, the signals are broadened due to large chemical shift anisotropy, and the one-bond carbon-carbon (C-C) couplings complicate signal separation and assignment in 13C dispersed NOESY spectra. The discovery of the aromatic TROSY effect (Pervushin et al. 1998) had promised to overcome some of these problems but to our knowledge this has not been utilized for studies of large and challenging proteins.
Here, we demonstrate that alternate 13C labeling (LeMaster and Kushlan 1996; Takeuchi et al. 2008) can overcome the one-bond C-C coupling problem and yield better-resolved 1H-13C correlated spectra for aromatic side chains. Alternate 13C labeling also facilitates the use of the aromatic TROSY effect (Meissner and Sorensen 1999; Pervushin et al. 1998; Schulte-Herbruggen et al. 2002; Weigelt 1998), resulting in high-resolution aromatic 1H-13C TROSY HSQC spectra. Furthermore, the 3D NOESY aromatic-TROSY spectra yield NOEs between aromatic side chains and methyl groups. We demonstrate the effect of alternate labeling on aromatic residues by using a complex of the human MED25 co-activator with the transactivation domain of VP16 and the cytosolic portion of the mitochondrial B-cell lymphoma-extra large (Bcl-xl) trans-membrane protein (Hagn et al. 2010; Sattler et al. 1997).
Materials and Methods
Protein Samples Used
The complex of the human transcriptional co-activator MED25 (VBD 391–553) with the transactivation domain (TAD 411–490) of the Herpes simplex transcriptional activator VP16 (VP16-TAD) having a total molecular mass of 28 kDa was prepared as described previously (Milbradt et al. 2011), except 2-13C glycerol and NaH13CO3 were used as carbon source to obtain an alternate 13C labeling pattern, following the procedures described in (LeMaster and Kushlan 1996). MED25 VBD and VP16-TAD were expressed for 5 hrs and 2 hrs, respectively, yielding ~ 10 mg/L of MED25 and 3 mg/L of VP16-TAD. To obtain a 1:1 complex of MED25 and VP16-TAD, a further gel filtration step on a Superdex 75 (GE Healthcare) column in NMR sample buffer (20 mM NaPi (pH 6.5), 150 mM NaCl, 3 mM DTT, 0.25 mM EDTA, 0.1% NaN3) was performed, followed by a concentration of the complex to 1 mM.
The expression and purification of BclxLΔLT (Sattler et al. 1997) (residues 1–45 and 85–209) were performed as previously described (Hagn et al. 2010). E.coli BL21(DE3) cells transformed with pET21a-BclxLΔLT coding for the protein and a non-cleavable C-terminal His6 tag were grown in M9 media supplemented with and 1g/L 15NH4Cl and a carbon source as the case required. For alternate 13C labeling using 3-13C-pyruvate, the M9 culture medium in H2O was supplemented with 3g/L of 3-13C-pyruvate and 1g/L of NaHCO3 instead of glucose as the sole carbon source. In case of 13C labeling using 2-13C-pyruvate, 3g/L 2-13C-pyruvate and 1g/L of NaH13CO3 was used as a carbon source. For making a uniformly labeled sample, 2 g/L of U-13C-glucose was used. After induction with 1 mM IPTG, the culture was grown at 298 K for 16 hrs, harvested and purified with Ni-NTA and Superdex 75 size exclusion chromatography, as described previously (Hagn et al. 2010). The final protein was in 20 mM NaPi (pH7.0), 50 mM NaCl, 0.5 mM EDTA, 5 mM DTT in D2O. The yield was 10–12 mg per liter after purification.
NMR experiments
2D aromatic 1H-13C HSQC experiments with gradient selection on the MED25/VP16-TAD complex were performed on a Bruker DRX 600 instrument equipped with a cryogenically cooled probe at 303 K. A total of 4 scans were recorded per increment. The sweep width in the direct dimension was 8013 Hz. The sweep width in the indirect carbon dimension was 4527 Hz, which was sampled in 256 increments with a maximum evolution time (t1-max) of 56 ms. Coupled spectra of aromatic 1H-13C correlations were recorded by omitting the proton decoupling pulse during t1 period and the 13C broadband decoupling during acquisition.
2D aromatic 1H-13C HSQC-TROSY experiments with gradient selection on the MED25/VP16-TAD complex were performed on a Bruker DRX 600 instrument equipped with a cryogenically cooled probe at 303 K. A total of 8 scans were recorded per increment. The sweep width in the direct dimension was 8013 Hz. The sweep width in the indirect carbon dimension was 4527 Hz, which was sampled in 256 increments with a t1-max of 56 ms.
3D NOESY aromatic-TROSY experiments with gradient selection on the MED25/VP16-TAD complex were performed on a Bruker DRX 600 instrument equipped with a cryogenically cooled probe at 303 K. A total of 8 scans were recorded per increment. The sweep width in the direct dimension was 8389 Hz. The sweep width in the indirect proton dimension was 6601 Hz, which was sampled in 190 increments with a t1-max of 28.7 ms. The sweep width in the indirect carbon dimension was 1358 Hz, which was sampled in 48 increments and a t1-max of 35 ms. A mixing time of 70 ms and a recycling delay of 1 s were used. The pulse sequence and the corresponding parameters are provided in the supplementary.
Experiments on Bcl-xl samples were collected on either a Bruker 750 MHz or 800 MHz spectrometer equipped with a cryogenically cooled probe. The data was collected on 250 μM samples at 303 K. The sweep width in the indirect dimension was 50 ppm centered at 120 ppm and 13 ppm in the direct dimension centered at 4.7 ppm. The constant-time period was set to 17.6 ms (1×CT), 35.2 ms (2×CT) and 52.8 ms (3×CT) and 128, 256, and 450 complex points, respectively, were collected in the indirect dimension.
Results
Dependence of alternate 13C labeling pattern on carbon source
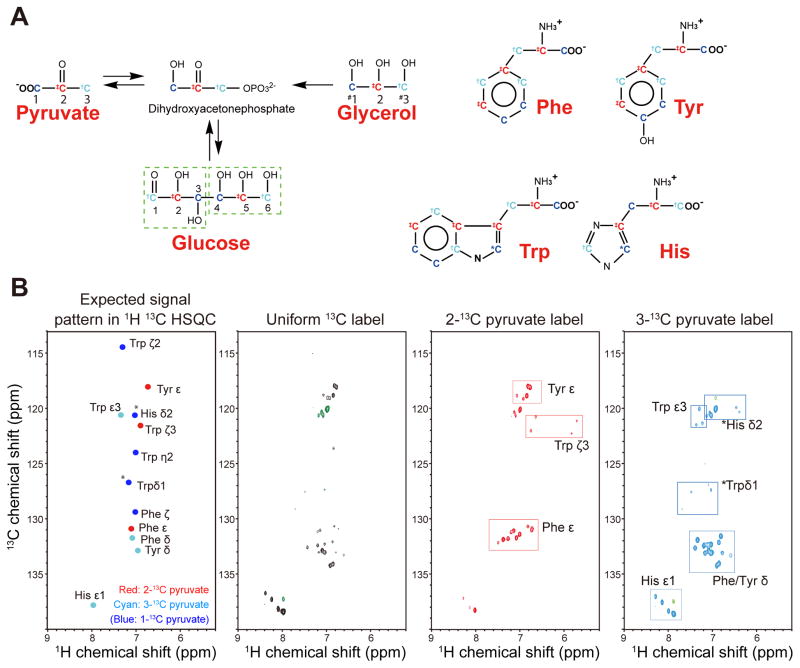
Alternate 13C labeling of the aromatic residues can be accomplished by using either 2-13C/1,3-13C glycerol or 2-13C/1,3-13C pyruvate as carbon source. The labeling pattern of aromatic amino acids arising from 2- or 1,3-13C carbon sources has been previously discussed (LeMaster and Kushlan 1996; Takeuchi et al. 2008). The resulting labeling pattern of aromatic residues, indicating where each carbon of pyruvate, glycerol or glucose gets incorporated into aromatic side chains, is shown in Fig 1A. The expected positions of the corresponding cross peaks are indicated in the left panel of Fig. 1B.
Figure 1.
Aromatic labeling scheme resulting from alternate 13C12C labeling. (A) The metabolic conversion between different carbon sources and transfer of carbons from pyruvate into aromatic side chains (B) Resultant labeling schemes in aromatic residues. The most probable labeling patterns are indicated in the hypothetical spectrum (left). Experimental labeling patterns obtained with uniform 13C labeling, 2-13C pyruvate and 3-13C pyruvate labeling of Bcl-xL are shown in the right-hand aromatic TROSY spectra. Signals that appear for His and Trp due to carbon shuffling are indicated with (*). Note: Other parts are specifically labeled without shuffling as it is evident from the fact that Phe ζ, Trp ζ2, and η2 are not labeled with 2-13C and 3-13C pyruvate. Glycerol and pyruvate are essentially equivalent, thus 2-13C-glycerol and 1,3-13C-glycerol are interchangeable with 2-13C-pyruvate and 1,3-13C- pyruvate, respectively. However, the 1st and 3rd positions are indistinguishable when glycerol is used (indicated with #).
What are the best precursors for alternate labeling? Glycerol and pyruvate are almost equivalent, thus 2-13C-glycerol and 1,3-13C-glycerol are interchangeable with 2-13C-pyruvate and 1,3-13C- pyruvate. However, 1,3-13C glycerol or 1,3-13C pyruvate carbon sources introduce unwanted 13C adjacencies in certain aromatic side chains and limited the utility of aromatic 1H-13C spectra. In contrast, a 3-13C pyruvate carbon source is unique in its molecular directionality and gives rise to a truly 2-13C-pyruvate-complementary alternate-13C labeling pattern of aromatic side chains.
Thus, we decided to use 3-13C pyruvate rather than 1,3-13C glycerol or 1,3-13C pyruvate in this study. Aromatic 1H-13C TROSY cross peaks obtained for uniform 13C, alternate 2-13C and 3-13C pyruvate labeling of Bcl-xL are shown in the three right-hand panels of Fig. 1B. As indicated in the figure, the 1st and 3rd positions are shuffled for the carbons incorporated via ribose-5P affecting Trp δ1 and His δ2.
Enabling the aromatic TROSY effect with alternate 13C labeling
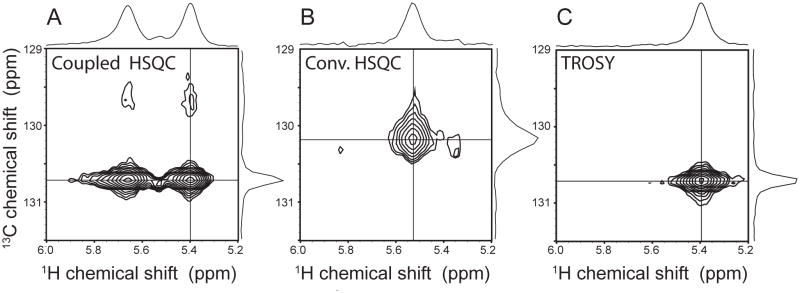
It has been recognized in the past that the relatively large CSA of aromatic carbons could be used for TROSY-based line narrowing (Meissner and Sorensen 1999; Pervushin et al. 1998). However, this effect has not been exploited much for large proteins probably due to spectral crowding and the interference with the one-bond C-C couplings in uniformly 13C labeled aromatic side chains. Both complications can be readily overcome with the alternate 13C labeling, and the aromatic TROSY can be utilized effectively. This TROSY line-narrowing effect is demonstrated in Fig. 2 with the aromatic cross peaks for the Phe-500 side chain of the 28 kDa alternately 13C labeled MED25-VP16 complex. Since one-bond C-C couplings are removed, we only observe an isolated 13C-1H spin pair with simplified scalar couplings. The coupled spectrum (Fig. 2A) shows that the upfield 13C component is severely broadened while the downfield component is sharp. However, the downfield 1H component shows almost same line width the up-field component in 1H dimension, reflecting the marginal proton TROSY effect in a protonated environment. Thus, the 13C decoupling should be applied during acquisition for the optimal sensitivity in a protonated environment, while the 13C decoupling during acquisition can be omitted to achieve optimal resolution (~10% of line narrowing would be expected in our case) at the expense of sensitivity. We have used 13C decoupling during acquisition in all figures except Figure 2 and 6. The proton line width could possibly be improved using the SAIL approach, where 12C nuclei are deuterated, and only 13C nuclei are protonated (Takeda et al. 2010). Obviously, the 1H and 13C decoupled spectrum (Fig. 2B) has a broader line width for 13C than the bottom right-hand TROSY-selected component (Fig. 2C), which confirms the benefit of pursuing the aromatic TROSY.
Figure 2.
Comparison of select regions of the aromatic 1H -13C correlated spectra of the MED25/VP16-TAD. (A) The Hε/Cε cross peak of Phe-500 of alternately 13C labeled complex in a coupled HSQC spectrum, (B) with decoupling in t1 and t2 and (C) with TROSY selection of the bottom right-hand TROSY component.
Figure 6.
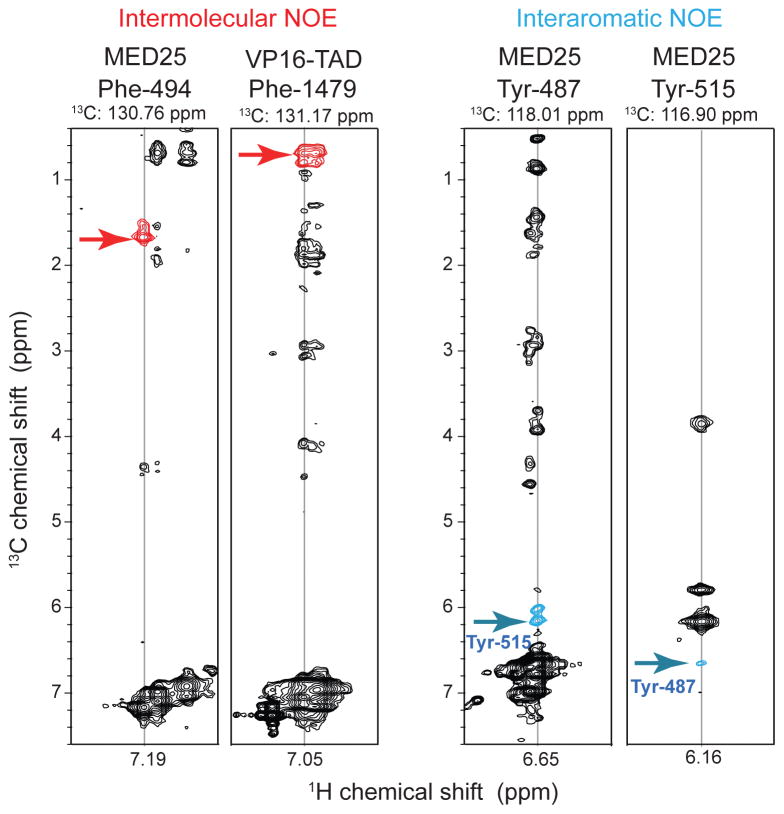
3D NOESY aromatic-TROSY recorded with the MED25/VP16-TAD complex. Representative strips observing intermolecular (left) and inter-aromatic NOE cross peaks (right) are shown. The cross peaks are colored red and blue, respectively. The employed Bruker pulse sequence is depicted in Fig. S2b. The supplement also lists a more sensitive 3D NOESY aromatic TROSY pulse sequence with 13C decoupling during detection, and two representative strips of uniformly 13C labeled and 2-13C pyruvate labeled Bcl-xL are shown.
Enhanced resolution in aromatic 1H-13C HSQCs with alternate 13C labeling
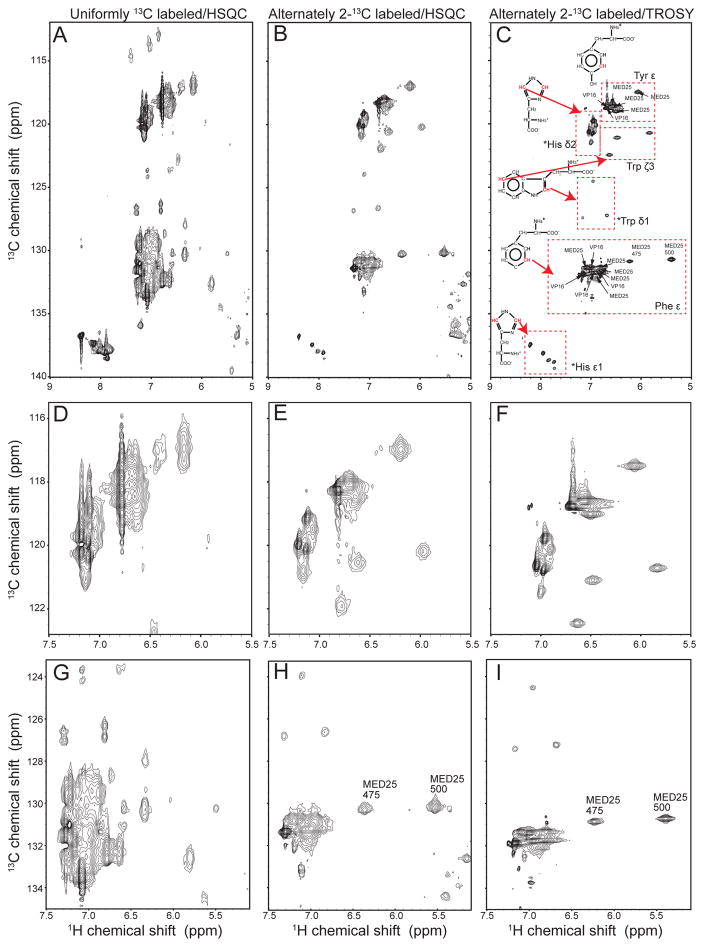
As indicated above, the resolution of aromatic 1H-13C correlated spectra can be dramatically increased when alternate 13C labeling with 2-13C glycerol is used. Fig. 3 shows 1H-13C correlated spectra of a complex between the transcriptional co-activator MED25 with the transactivation domain of VP16. In contrast, the HSQC spectrum of the uniformly 13C labeled complex (Fig. 3A) is heavily overlapped, and peaks are severely broadened due to the large one-bond C-C couplings, strong 1H-1H and 1H-13C dipole couplings and the large CSA. The HSQC spectrum of the alternately 13C labeled sample (Fig. 3B) is much less crowded and exhibits narrower line shapes. In Fig. 3C, the spectrum was recorded as an aromatic TROSY selecting for the bottom right-hand TROSY component, which resulted in additional line narrowing. This gain in resolution allowed us to use 3D experiments and NOEs to assign 6 Hε/Cε peaks for the 6 tyrosines, and 11 Hε/Cε peaks of the 12 phenylalanines. In addition, we observe 3 Hδ1/Cδ1 and 3 Hζ3/Cζ3 cross peaks for the three tryptophans, and surprisingly at least 5 Hε1/Cε1 and 5 Hδ2/Cδ2 signals for the 8 histidines. Based on the metabolic origin of the δ2 and ε1 histidine carbons, the observed histidine labeling pattern is likely caused by carbon shuffling, however, this is not considered to be a predominant labeling pattern. The labeling patterns for the other aromatic side chains are fully consistent with previous literature reports (LeMaster and Kushlan 1996). Thus, although there are fewer 1H/13C cross peaks due to the alternate 13C labeling, we can now observe at least one signal for almost every aromatic side chains with dramatically enhanced resolution. In particular, this approach also provides access to side chain signals of histidines and tryptophans that are hardly ever used for structural constraints or dynamics studies. They are seldom assigned in larger proteins, except for the well-separated tryptophan εNH. Interestingly, the different labeling patterns of Trp side chains should make it possible to define a NOE-based orientation of these side chains with respect to the χ2 angle.
Figure 3.
Aromatic region of the 1H-13C HSQC correlated spectra of MED25 in complex with TAD of VP16. (A) HSQC of uniformly 13C labeled complex. (B) HSQC of alternately 13C labeled complex using 2-13C glycerol as 13C source. (C): Same, but recorded with aromatic TROSY scheme selecting the bottom right TROSY component. The spectra were recorded at 303 K. (D, E and F) Expansions of the region containing the cross peaks of Tyr Hε/Cε, Trp Hζ3/Cζ3 and His Hδ2/Cδ2 recorded with a uniformly 13C-labeled sample (D), an alternately 13C labeled sample using a standard HSQC (middle), and an aromatic TROSY (F). (G, H and I) Expansions of the region containing the cross peaks of Phe Hε/Cε with the corresponding procedures.
Figs. 3D, E and F show a comparison between the region containing the tyrosine Hε/Cε, the tryptophan Hζ3/Cζ3 and His Hδ2/Cδ2 cross peaks for the three spectra. The Hζ3/Cζ3 peaks of the three tryptophans are completely absent in the uniformly 13C labeled sample, but are visible in the alternately 13C labeled sample and exhibit narrower line widths with the TROSY effect. The tyrosine Hε/Cε peaks are best resolved in the TROSY experiment, and the same is the case with the His Hδ2/Cδ2 cross peaks. Fig. 3 panels G, H and I show the corresponding comparison for the phenylalanine Hε/Cε and tryptophan Hδ1/Cδ1 cross peaks. The complexity of the spectrum is dramatically reduced with the 13C alternate labeling approach. Moreover, the line widths are reduced when using the aromatic TROSY, in particular in the carbon dimension. In addition, using the TROSY increases the peak heights due to the more favorable relaxation properties. This is clearly seen for the well-resolved peaks of Phe-475 and Phe-500 (Fig. 3H and I).
Comparison of 2 and 3 13C pyruvate labeling with uniform 13C labeling
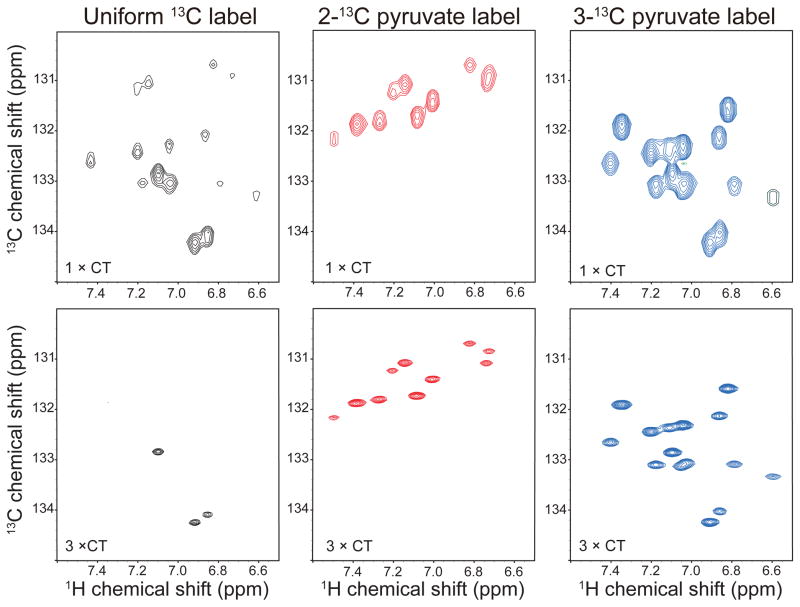
To further evaluate this approach we used samples of Bcl-xl to investigate the labeling patterns and the aromatic TROSY. We expressed three Bcl-xl samples with different labeling patterns: alternately-2-13C-pyruvate-labeled, alternately-3-13C-pyruvate-labeled, and uniformally 13C labeled. All three samples were measured at the same concentration of 250 μM and identical measurement conditions. The resulting spectra were processed with the same parameters and plotted with the same vertical scale and contour levels. Fig 4 shows the comparison of a constant-time aromatic TROSY (Pervushin et al. 1998) for 2-13C pyruvate, 3-13C pyruvate and uniformly-13C samples at two different constant-time periods (17.6 ms (1 × CT) and 52.8 ms (3 × CT)). Constant-time evolution was chosen in the indirect dimension to facilitate comparison with the uniformly labeled sample. The pulse sequence enabled TROSY selection in the indirect 13C dimension and employed carbon decoupling during 1H encoding in the direct dimension. For the sake of clarity only phenylalanine resonances are shown and the full aromatic spectra are presented in the supplementary material (Fig. S1). There is a marked decrease in intensity of the uniformly labeled sample between the one and three constant time experiments, mostly due to relaxation to the neighboring carbon. On the other hand the alternately labeled samples have stronger peaks, and are still clearly visible at a constant-time period of 26.4 ms. The complementary labeling pattern between the 2-13C and 3-13C pyruvate is also clearly seen. While all resonances are visible in the alternately-labeled samples even with at longer constant-time delays the uniformly labeled sample exhibits only the three strongest peaks. We have considered both positive and negative peaks in the above discussion as carbons with one or two neighboring would be of opposite sign in certain constant-time periods.
Figure 4.
Comparison of aromatic TROSY spectra (Meissner and Sorensen 1999) using one or three constant time evolution periods of uniformly 13C labeled, 2-13C pyruvate, and 3-13C pyruvate labeled Bcl-xL. The region contains Phe and Tyr δ signals. While the uniformly 13C labeled sample lost most signals after three CT periods, the signals remain very strong with alternate labeling and are sharper due to extensive sampling.
Comparison of HSQC and two aromatic TROSY experiments on alternately labeled samples
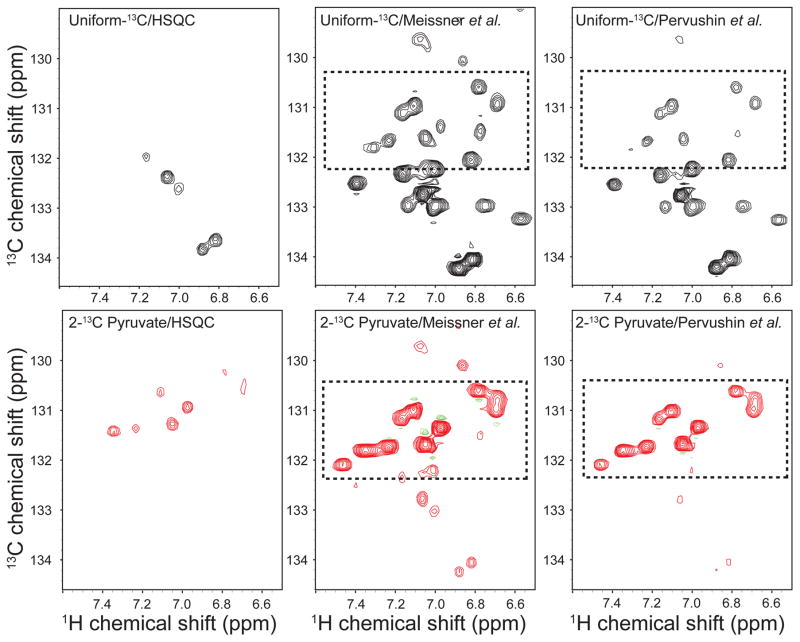
To compare the effect of aromatic TROSY on alternate labeling, we used constant-time HSQC (2 × CT: 17.6 ms) and two different TROSY experiments described by Pervushin et al. (Pervushin et al. 1998) and Meissner et al. (Meissner and Sorensen 1999). The results comparing uniformly 13C labeled samples and 2-13C pyruvate labeled samples are shown in Fig 5. The acquisition time, sample concentrations, experimental and processing parameters were identical. The aromatic TROSY clearly shows marked improvement in intensity both in the case of uniformly labeled and alternately labeled samples. However, the aromatic TROSY shows even stronger peaks in case of an alternately labeled sample when compared with a uniformly labeled sample (highlighted in a rectangular box). The Meissner et. al. TROSY gave the best signal intensity. These results clearly demonstrate the effect of aromatic TROSY and the benefits of alternate labeling.
Figure 5.
Comparison of a standard HSQC and two alternative aromatic TROSYs of uniformly 13C labeled (upper panel) and 2-13C pyruvate labeled (lower panel) Bcl-xL. Clearly, both aromatic TROSY sequences dramatically outperform the standard HSQC. The Meissner TROSY (Meissner and Sorensen 1999) is more sensitive than the original version by Pervushin (Pervushin et al. 1998).
Facilitating assignment of aromatic-aromatic and aromatic-methyl NOEs in 3D TROSY-NOESY experiments
To utilize the high resolution obtainable with aromatic TROSY sequences, we recorded a 3D NOESY aromatic TROSY experiment on the MED25/VP-16 complex. The deployed pulse sequence is a straightforward extension of TROSY sequences commonly used for 15N dispersed 3D NOESY-TROSY experiments, and details of the pulse sequence are provided in the supplementary information. Sample strips of the 3D NOESY-aro-TROSY are displayed in Fig. 6B. The resolution obtained with the aromatic TROSY allowed identification of intermolecular NOEs between phenylalanines of MED25 and the VP16-TAD (red crosspeaks). The experiment also enabled the identification of NOEs between different aromatic side chains (blue crosspeaks), which would not be resolvable with uniform 13C labeling. Furthermore, the experiment allowed the identification of intermolecular NOEs between aromatic and methyl side chain groups. The information obtained from this experiment facilitated the structure determination of the complex between MED25 and the VP16-TAD (to be published).
The 3D NOESY-TROSY spectra were recorded with TROSY selection in both 13C and 1H dimensions (Fig. 6A) and resulted in almost complete assignment of the Phe and Tyr side chains. The sensitivity can be further increased by using TROSY selection in the carbon dimension only and by employing carbon decoupling during detection. These types of experiments were recorded on uniformly 13C labeled and 2-13C pyruvate labeled Bcl-xL samples. Two strips from the 3D NOESY are shown as supplementary Fig. S3, and the respective pulse sequence scheme is provided in Fig. S2b.
Discussion
The bulky side chains of aromatic residues make numerous contacts within globular protein cores, and measuring distance constraints involving these side chains is essential for defining the structures of these cores. While β-sheet regions are often readily defined through backbone NOE contacts, placing of helical segments relies more heavily on side chain contacts, including aromatic residues with crowded and often unresolved signals. Frequently, aromatic side chains are also part of hydrophobic patches of globular proteins that are crucial for interactions with other proteins or peptide ligands. Furthermore, aromatic residues often contribute to key hydrophobic interactions with small molecule inhibitors, which are discovered in high-throughput or fragment-based screening. Thus, monitoring aromatic contacts by NMR would be invaluable for characterizing such protein-inhibitor complexes. The fact that aromatic contacts are sparsely utilized stems from the poor resolution of aromatic resonances, complicated coupling patterns, and line broadening due to chemical shift anisotropy.
The use of alternate 13C labeling dramatically improves the resolution of the aromatic spectrum by removing strong one-bond C-C couplings and reducing the number of cross peaks to approximately one half (Fig 2). The latter effect is critical in simplifying the phenylalanine region of the spectra (Fig 2C, 5). This simplification renders the aromatic TROSY effect worthwhile to use and leads to a significant line narrowing in particular in the carbon dimension. The use of 1-13C glucose to obtain alternate labeling of aromatic residues has been previously described (Teilum et al. 2006), but metabolic conversion of 1-13C glucose results in 13C incorporation of approximate 50%. Thus, this relatively inexpensive labeling strategy is not recommended for NOESYs or other sensitivity-limited experiments. Note that we use NaH13CO3, to prevent incorporation of unlabeled CO32- into the position next to 3rd position of pyruvate when oxaloacetate is made. This gave a better alternate 13C pattern for the amino acids that are made through the TCA cycle. The use of non-labeled NaHCO3 would reduce the 13C labeling rate of the aforementioned amino-acid residues and would limit the use of the labeled protein in 4D 13C NOESY experiment. Especially, CO32- would be incorporated into one third of the methyl moieties of Ile δ1 and Thr γ1 when a combination of 3g/L 2-13C-pyruvate and 1g/L of NaH13CO3 was used. This could give important distance information between aromatic and those methyls. Thus, the use of NaH13CO3 in combination with 2-13C alternate labeling would be more general and useful, although is not necessarily required for achieving alternate 13C labeling pattern in aromatic side chains. It should be noted that having NaH13CO3 would not be detrimental for alternate 13C labeling of aromatic side chain.
Exploiting the synergies between alternate 13C labeling and the aromatic TROSY effect opens avenues for recording high-resolution 3D 13C-dispersed NOESY spectra for the efficient identification of aromatic/methyl contacts (Fig 6). Moreover, it permits detecting aromatic-aromatic NOEs, which is nearly impossible in larger proteins with conventional uniform 13C labeling. The experiments can readily be extended to 4D 13C-13C dispersed NOESY experiments suitable for studies of larger proteins. In this case, labeling with 3-13C pyruvate would be preferred as this form of 13C labeling would also be fully incorporated 13C into Ala β, Ile γ1, Leu δ, Val γ, and one third of Ile δ1 and Thr γ1 positions.
Supplementary Material
Acknowledgments
This research was supported by the National Institutes of Health (Grants GM047467, GM094608 and EB002026).
Abbreviations
- NMR
nuclear magnetic resonance
- NOE
nuclear Overhauser effect
- NOESY
NOE spectroscopy
References
- Ayala I, Hamelin O, Amero C, Pessey O, Plevin MJ, Gans P, Boisbouvier J. An optimized isotopic labelling strategy of isoleucine-gamma2 methyl groups for solution NMR studies of high molecular weight proteins. Chem Commun (Camb) 2012;48:1434–1436. doi: 10.1039/c1cc12932e. [DOI] [PubMed] [Google Scholar]
- Battiste JL, Wagner G. Utilization of site-directed spin labeling and high-resolution heteronuclear nuclear magnetic resonance for global fold determination of large proteins with limited nuclear overhauser effect data. Biochemistry. 2000;39:5355–5365. doi: 10.1021/bi000060h. [DOI] [PubMed] [Google Scholar]
- Cavalli A, Salvatella X, Dobson CM, Vendruscolo M. Protein structure determination from NMR chemical shifts. Proc Natl Acad Sci U S A. 2007;104:9615–9620. doi: 10.1073/pnas.0610313104. [DOI] [PMC free article] [PubMed] [Google Scholar]
- Cornilescu G, Delaglio F, Bax A. Protein backbone angle restraints from searching a database for chemical shift and sequence homology. J Biomol NMR. 1999;13:289–302. doi: 10.1023/a:1008392405740. [DOI] [PubMed] [Google Scholar]
- Frueh DP, Arthanari H, Koglin A, Vosburg DA, Bennett AE, Walsh CT, Wagner G. Dynamic thiolation-thioesterase structure of a non-ribosomal peptide synthetase. Nature. 2008;454:903–906. doi: 10.1038/nature07162. [DOI] [PMC free article] [PubMed] [Google Scholar]
- Goto NK, Gardner KH, Mueller GA, Willis RC, Kay LE. A robust and cost-effective method for the production of Val, Leu, Ile (delta 1) methyl-protonated 15N-, 13C-, 2H-labeled proteins. J Biomol NMR. 1999;13:369–374. doi: 10.1023/a:1008393201236. [DOI] [PubMed] [Google Scholar]
- Grishaev A, Tugarinov V, Kay LE, Trewhella J, Bax A. Refined solution structure of the 82-kDa enzyme malate synthase G from joint NMR and synchrotron SAXS restraints. J Biomol NMR. 2008;40:95–106. doi: 10.1007/s10858-007-9211-5. [DOI] [PubMed] [Google Scholar]
- Hagn F, Klein C, Demmer O, Marchenko N, Vaseva A, Moll UM, Kessler H. BclxL changes conformation upon binding to wild-type but not mutant p53 DNA binding domain. J Biol Chem. 2010;285:3439–3450. doi: 10.1074/jbc.M109.065391. [DOI] [PMC free article] [PubMed] [Google Scholar]
- LeMaster DM. Deuteration in protein proton magnetic resonance. Methods Enzymol. 1989;177:23–43. doi: 10.1016/0076-6879(89)77004-x. [DOI] [PubMed] [Google Scholar]
- LeMaster DM. Deuterium labelling in NMR structural analysis of larger proteins. Q Rev Biophys. 1990a;23:133–174. doi: 10.1017/s0033583500005527. [DOI] [PubMed] [Google Scholar]
- LeMaster DM. Uniform and selective deuteration in two-dimensional NMR of proteins. Annu Rev Biophys Biophys Chem. 1990b;19:243–266. doi: 10.1146/annurev.bb.19.060190.001331. [DOI] [PubMed] [Google Scholar]
- LeMaster DM, Kushlan DM. Dynamical Mapping of E. coli Thioredoxin via 13C NMR Relaxation Analysis. J Am Chem Soc. 1996;118:9255–9264. [Google Scholar]
- Medek A, Olejniczak ET, Meadows RP, Fesik SW. An approach for high-throughput structure determination of proteins by NMR spectroscopy. J Biomol NMR. 2000;18:229–238. doi: 10.1023/a:1026544801001. [DOI] [PubMed] [Google Scholar]
- Meissner A, Sorensen OW. The role of coherence transfer efficiency in design of TROSY-type multidimensional NMR experiments. J Magn Reson. 1999;139:439–442. doi: 10.1006/jmre.1999.1788. [DOI] [PubMed] [Google Scholar]
- Milbradt AG, et al. Structure of the VP16 transactivator target in the Mediator. Nat Struct Mol Biol. 2011;18:410–415. doi: 10.1038/nsmb.1999. [DOI] [PMC free article] [PubMed] [Google Scholar]
- Otten R, Chu B, Krewulak KD, Vogel HJ, Mulder FA. Comprehensive and cost-effective NMR spectroscopy of methyl groups in large proteins. J Am Chem Soc. 2010;132:2952–2960. doi: 10.1021/ja907706a. [DOI] [PubMed] [Google Scholar]
- Pervushin K, Riek R, Wider G, Wuthrich K. Transverse relaxation-optimized spectroscopy (TROSY) for NMR studies of aromatic spin systems in 13C-labeled proteins. J Am Chem Soc. 1998;120:6394–6400. [Google Scholar]
- Rosen MK, Gardner KH, Willis RC, Parris WE, Pawson T, Kay LE. Selective methyl group protonation of perdeuterated proteins. J Mol Biol. 1996;263:627–636. doi: 10.1006/jmbi.1996.0603. [DOI] [PubMed] [Google Scholar]
- Ruschak AM, Kay LE. Methyl groups as probes of supra-molecular structure, dynamics and function. J Biomol NMR. 2009 doi: 10.1007/s10858-009-9376-1. [DOI] [PubMed] [Google Scholar]
- Ruschak AM, Kay LE. Methyl groups as probes of supra-molecular structure, dynamics and function. J Biomol NMR. 2010;46:75–87. doi: 10.1007/s10858-009-9376-1. [DOI] [PubMed] [Google Scholar]
- Sattler M, et al. Structure of Bcl-xL-Bak peptide complex: recognition between regulators of apoptosis. Science. 1997;275:983–986. doi: 10.1126/science.275.5302.983. [DOI] [PubMed] [Google Scholar]
- Schulte-Herbruggen T, Meissner A, Papanikos A, Meldal M, Sorensen OW. Optimizing delays in the MBOB, broadband HMBC, and broadband XLOC NMR pulse sequences. J Magn Reson. 2002;156:282–294. doi: 10.1006/jmre.2002.2565. [DOI] [PubMed] [Google Scholar]
- Shen Y, Delaglio F, Cornilescu G, Bax A. TALOS+: a hybrid method for predicting protein backbone torsion angles from NMR chemical shifts. J Biomol NMR. 2009;44:213–223. doi: 10.1007/s10858-009-9333-z. [DOI] [PMC free article] [PubMed] [Google Scholar]
- Shen Y, et al. Consistent blind protein structure generation from NMR chemical shift data. Proc Natl Acad Sci U S A. 2008;105:4685–4690. doi: 10.1073/pnas.0800256105. [DOI] [PMC free article] [PubMed] [Google Scholar]
- Solomon I. Relaxation processes in a system of two spins. Phys Rev. 1955;99:559–565. [Google Scholar]
- Su XC, Otting G. Paramagnetic labelling of proteins and oligonucleotides for NMR. J Biomol NMR. 2010;46:101–112. doi: 10.1007/s10858-009-9331-1. [DOI] [PubMed] [Google Scholar]
- Takeda M, Ono AM, Terauchi T, Kainosho M. Application of SAIL phenylalanine and tyrosine with alternative isotope-labeling patterns for protein structure determination. J Biomol NMR. 2010;46:45–49. doi: 10.1007/s10858-009-9360-9. [DOI] [PubMed] [Google Scholar]
- Takeuchi K, Sun ZY, Wagner G. Alternate 13C-12C labeling for complete mainchain resonance assignments using C alpha direct-detection with applicability toward fast relaxing protein systems. J Am Chem Soc. 2008;130:17210–17211. doi: 10.1021/ja806956p. [DOI] [PMC free article] [PubMed] [Google Scholar]
- Teilum K, Brath U, Lundstrom P, Akke M. Biosynthetic 13C labeling of aromatic side chains in proteins for NMR relaxation measurements. J Am Chem Soc. 2006;128:2506–2507. doi: 10.1021/ja055660o. [DOI] [PubMed] [Google Scholar]
- Tjandra N, Bax A. Direct measurement of distances and angles in biomolecules by NMR in a dilute liquid crystalline medium. Science. 1997;278:1111–1114. doi: 10.1126/science.278.5340.1111. [DOI] [PubMed] [Google Scholar]
- Tugarinov V, Choy WY, Orekhov VY, Kay LE. Solution NMR-derived global fold of a monomeric 82-kDa enzyme. Proc Natl Acad Sci U S A. 2005;102:622–627. doi: 10.1073/pnas.0407792102. [DOI] [PMC free article] [PubMed] [Google Scholar]
- Velyvis A, Ruschak AM, Kay LE. An economical method for production of (2)H, (13)CH3-threonine for solution NMR studies of large protein complexes: application to the 670 kDa proteasome. PLoS One. 2012;7:e43725. doi: 10.1371/journal.pone.0043725. [DOI] [PMC free article] [PubMed] [Google Scholar]
- Wagner G, Braun W, Havel TF, Schaumann T, Go N, Wuthrich K. Protein structures in solution by nuclear magnetic resonance and distance geometry. The polypeptide fold of the basic pancreatic trypsin inhibitor determined using two different algorithms, DISGEO and DISMAN. J Mol Biol. 1987;196:611–639. doi: 10.1016/0022-2836(87)90037-4. [DOI] [PubMed] [Google Scholar]
- Weigelt J. Single Scan, Sensitivity- and Gradient-Enhanced TROSY for Multidimensional NMR Experiments. J Am Chem Soc. 1998;120:10778–10779. [Google Scholar]
- Wishart D, Sykes B, Richards F. The chemical shift index: a fast and simple method for the assignment of protein secondary structure. Biochemistry. 1992;31:1647–1651. doi: 10.1021/bi00121a010. [DOI] [PubMed] [Google Scholar]
Associated Data
This section collects any data citations, data availability statements, or supplementary materials included in this article.


