

Abstract
Neuroimaging techniques, such as fMRI, structural MRI, diffusion tensor imaging (DTI), and proton magnetic resonance spectroscopy (1H-MRS) have uncovered evidence for widespread functional and anatomical brain abnormalities in autism spectrum disorder (ASD) suggesting it to be a system-wide neural systems disorder. Nevertheless, most previous studies have focused on examining one index of neuropathology through a single neuroimaging modality, and seldom using multiple modalities to examine the same cohort of individuals. The current study aims to bring together multiple brain imaging modalities (structural MRI, DTI, and 1H-MRS) to investigate the neural architecture in the same set of individuals (19 high-functioning adults with ASD and 18 typically developing (TD) peers). Morphometry analysis revealed increased cortical thickness in ASD participants, relative to typical controls, across the left cingulate, left pars opercularis of the inferior frontal gyrus, left inferior temporal cortex, and right precuneus, and reduced cortical thickness in right cuneus and right precentral gyrus. ASD adults also had reduced fractional anisotropy (FA) and increased radial diffusivity (RD) for two clusters on the forceps minor of the corpus callosum, revealed by DTI analyses. 1H-MRS results showed a reduction in the N-acetylaspartate/Creatine ratio in dorsal anterior cingulate cortex (dACC) in ASD participants. A decision tree classification analysis across the three modalities resulted in classification accuracy of 91.9% with FA, RD, and cortical thickness as key predictors. Examining the same cohort of adults with ASD and their TD peers, this study found alterations in cortical thickness, white matter (WM) connectivity, and neurochemical concentration in ASD. These findings underscore the potential for multimodal imaging to better inform on the neural characteristics most relevant to the disorder.
Keywords: Autism, MRI, DTI, Spectroscopy, Multimodal neuroimaging, Classification
1. Introduction
Autism spectrum disorder (ASD) has been characterized as a disorder of neurodevelopmental origin, with widespread abnormalities such as altered cortical anatomy (Amaral, Schumann, & Nordahl, 2008; Nickl-Jockschat et al., 2012), abnormal white matter (WM) integrity (Travers et al., 2012), altered brain function and connectivity (Anagnostou & Taylor, 2011; Kana, Libero, & Moore, 2011; Libero & Kana, 2013; Maximo, Cadena, & Kana, 2014; Schipul, Keller, & Just, 2011), increase in the number of neurons (Courchesne, Campbell, & Solso, 2011), numerous and smaller cortical minicolumns (Casanova, Buxhoeveden, & Brown, 2002; Casanova, Buxhoeveden, Switala, & Roy, 2002; Casanova et al., 2006), and alterations in synaptic connections and the organization of neurons within cortex (Avino & Hutsler, 2010; Hutsler, Love, & Zhang, 2007; Hutsler & Zhang, 2010; Stoner et al., 2014). Such abnormalities point to a complex and multilayered picture of the neurobiology of autism. While this may be a true reflection of the multidimensional manifestation of the behavioral symptoms of autism, uncovering the neural underpinnings of this disorder certainly poses immense challenge to neuroscientists. Previous neuroimaging studies have approached this by resorting to different types of imaging techniques, such as functional MRI, structural MRI, diffusion tensor imaging (DTI), and proton magnetic resonance spectroscopy (1H-MRS), mostly using each modality in isolation resulting in significant but not highly consistent findings.
With regard to cortical anatomy, there has been reports of early overgrowth in brain volume (Courchesne et al., 2011; Hazlett et al., 2005, 2011; Stanfield et al., 2008), followed by abnormal decline and degeneration during adolescence and adulthood (Courchesne et al., 2011). However, regional volumetric differences found in ASD have been variable with no consensus on any single region to be the main culprit. The relatively more consistent findings are increased gray matter (GM) volume in frontal, temporal, parietal, and limbic areas, decreased WM volume in frontal, temporal, and limbic areas (Chen, Jiao, & Herskovits, 2011; Stanfield et al., 2008), and volumetric abnormalities in amygdala, hippocampus, corpus callosum, and cerebellum (Brambilla et al., 2003; Stanfield et al., 2008). Surface based examinations of brain structure in ASD, on the other hand, have uncovered alterations in cortical thickness in regions across the entire brain (Chung et al., 2005; Ecker, Ginestet, et al., 2013; Ecker, Spooren, & Murphy, 2013; Hadjikhani, Joseph, Snyder, & Tager-Flusberg, 2006; Hardan, Muddasani, Vemulapalli, Keshavan, & Minshew, 2006; Hyde, Samson, Evans, & Mottron, 2010; Mak-Fan, Taylor, Roberts, & Lerch, 2012; Raznahan et al., 2010; Scheel et al., 2011; Wallace, Dankner, Kenworthy, Giedd, & Martin, 2010). As cortical thickness and volume are related to dendritic arborization (Huttenlocher, 1990), myelination (Sowell et al., 2004), and the migration of neurons and organization of minicolumns (Rakic, 1988), abnormalities in surface features of cortex in ASD may imply significant alterations at cellular and developmental levels. In addition, many of the regions implicated are members of a network of brain regions called the social brain, which includes the amygdala, anterior cingulate cortex, posterior cingulate cortex (PCC), insula, ventral striatum, premotor cortex, orbitofrontal cortex, medial prefrontal cortex, fusiform gyrus and temporoparietal junction/superior temporal sulcus (Adolphs, 2001, 2009). Function and structure of social brain regions are associated with human social cognition, thus abnormalities in any of these regions found in individuals with ASD point to potential neural underpinnings for the social behavioral deficits seen in ASD.
While volumetric examinations provide valuable information about the neuroanatomical organization, it does not address the microstructural aspects of tissues like WM. With advanced neuroimaging techniques like DTI, studying the structural integrity of WM in disorders like autism has become more promising. Whole brain studies of diffusion in ASD have found reduced fractional anisotropy (FA; an index of the directionality of diffusion) and increased mean diffusivity (MD; average diffusion in all directions) in overall WM in ASD participants (Groen, Buitelaar, Van Der Gaag, & Zwiers, 2011; Shukla, Keehn, Lincoln, & Müller, 2010), suggesting significant disturbance in WM integrity across the brain. At a finer level, DTI studies in ASD examining specific regions or WM tracts have most consistently found reduced FA, indicating alterations in WM tract integrity, in a number of tracts including corpus callosum, cingulum bundle, and tracts projecting to the temporal lobes, such as the uncinate fasciculus, inferior longitudinal fasciculus, and superior longitudinal fasciculus [(A. L. Alexander et al., 2007; Barnea-Goraly et al., 2004; Bloemen et al., 2010; Keller, Kana, & Just, 2007; Lee et al., 2007); see (Travers et al., 2012) for a review]. These findings indicate significant microstructural abnormalities and alterations in the organization of WM fibers in ASD, which may translate into functional impairments in brain activation and functional connectivity.
While cortical anatomy and WM fiber orientation provide two different aspects of brain organization, the health of individual neurons is yet another factor which determines the structural and functional makeup of the brain. 1H-MRS measures tissue metabolite concentration, and can be used as an indirect measure of neuronal health and function in living tissue (Fayed, Olmos, Morales, & Modrego, 2006; Stanley, 2002). 1H-MRS is applied to examine the concentration of specific neurochemicals in the brain, and their potential role in disease and treatment. This technique can measure various neurochemicals, including N-acetylaspartate (NAA; a marker for neuronal and axonal health and density), choline (Cho; marking cellular membrane proliferation), glutamate/gluta mine (Glx; measuring glutamate/glutamine levels), and creatine (Cr; marking energy homeostasis). Previous 1H-MRS studies in ASD have found reductions of NAA in both gray and WM in children and adults with ASD most consistently (Ipser et al., 2012). These findings suggest significant alterations in neurochemicals in certain regions of the ASD brain, specifically pointing to poorer neuronal health or possible cellular damage or inflammation.
Thus, neuroimaging evidence coming from cortical morphometry, DTI, and 1H-MRS studies in ASD have provided information about alterations in brain structure, WM integrity, and neuronal health; yet, these findings span diffuse and spatially distinct brain regions, with relatively poor consistency and overlap of results across studies. While heterogeneity among individuals with autism may be an important factor driving the inconsistency in findings, what's striking is that studies rarely, if ever, have investigated all indices of brain organization (anatomy, WM integrity, and neurochemical concentration) from the same set of participants. Therefore, it is difficult to derive a convincing inference that is comprehensive and reliable in representing the neuropathology in autism. The current study is an attempt to address this gap by using multimodal neuroimaging data from the same participants across three modalities of neuroimaging, MRI, DTI, and 1H-MRS. This approach is novel and provides a promising venue for understanding the neuropathology of autism.
Another objective of this study was to identify patterns across findings from different modalities and to apply that knowledge to classify participants into autism and TD control groups. Utilizing pattern classification of neuroimaging data, several studies have aimed to identify a predictive model for ASD diagnosis. For example, functional brain activation and connectivity were used for pattern classification to separate ASD from TD peers (Anderson et al., 2011; Coutanche, Thompson-Schill, & Schultz, 2011; Deshpande, Libero, Sreenivasan, Deshpande, & Kana, 2013; Kaiser & Pelphrey, 2012; Murdaugh et al., 2012; Spencer et al., 2011). A few studies have also applied classification analyses to volumetric and surface based structural measures (Akshoomoff et al., 2004; Ecker, Marquand, et al., 2010; Ecker, Rocha-Rego, et al., 2010; Uddin et al., 2011; Yun Jiao et al., 2010) and DTI data (Ingalhalikar, Parker, Bloy, Roberts, & Verma, 2011; Lange et al., 2010) to predict ASD group membership. One study has also used a combination of cortical volume and thickness measures, along with single-nucleotide polymorphisms (Y Jiao et al., 2011) to predict group membership. Thus, accurate and reliable classification of participants with autism is a promising step towards the diagnostic utility of such measures. For a neurodevelopmental disorder that relies on behavioral diagnosis, an applied neural classifier could be helpful, at least in deciding difficult and borderline cases. Attempts at neural classifiers thus far have mainly relied on measures of brain function, based on experimental tasks, which may be inappropriate for many individuals with ASD, particularly those who would be considered low-functioning or young children. ASD has been identified as a neural systems disorder with complex neurobiology, and any biomarker will need to be multivariate, possibly including several aspects of biology and genetics (Ecker, Spooren, et al., 2013). Ultimately, a multimodal technique could become more sensitive to symptomatology, which can lead to not only better diagnosis of autism, but also aid in designing more tailored interventions. The current study is novel in that it marks the first one to examine three neuroimaging modalities (SBM, DTI, and 1H-MRS) in the same subjects with ASD, and to apply such measures to a diagnostic classification of autism.
2. Method & materials
2.1. Participants
Nineteen high-functioning adults with ASD (15 males/4 females; mean age: 27.1 years) and 18 typically developing (TD) peers (14 males/4 females; mean age: 24.6 years) participated in this multimodal neuroimaging study (see Table 1 for demographic information). The groups were matched on age and IQ. Full-scale IQ (FSIQ), verbal IQ (VIQ), and performance IQ (PIQ) were assessed using the Wechsler Abbreviated Scale of Intelligence (WASI) (Wechsler, 1999), handedness using the Edinburgh Handedness Inventory (Oldfield, 1971), and ASD symptoms using the Ritvo Autism Asperger Diagnostic Scale-Revised (RAADS-R) (Ritvo et al., 2011). Age, FSIQ, VIQ, and PIQ were not significantly different between groups. The ASD group scored significantly higher on the RAADS-R compared to their TD peers (see Table 1). Participants with ASD had received a diagnosis of an ASD based on Autism Diagnostic Interview-Revised (ADI-R) (Rutter, Le Couteur, & Lord, 2003) symptoms and Autism Diagnostic Observation Schedule (ADOS) (Lord et al., 2000). TD participants were screened through a self-report history questionnaire to rule out neurological disorders, such as ASD, ADHD, or Tourette's Disorder, that could potentially confound the results. Several ASD participants reported taking medications, including stimulant medication (n =6), antidepressants (n =8), anxiety medication (n=1), and antipsychotic medication (n = 1). Eight ASD participants reported no medications, and no TD participants reported taking medication. Finally, all participants were reported to be non-smokers. The study was approved by the Institutional Review Board of our university, and all participants provided informed consent for their participation in the study. Structural MRI, DTI, and MR spectroscopy data were acquired from all participants. See Supplementary Fig. 1 for a flow-chart overview of the procedures involved in multimodal neuroimaging method.
Table 1. Participant demographic information.
| Autism | Control | Group difference | ||||||
|---|---|---|---|---|---|---|---|---|
|
|
||||||||
| N = 19 | N = 18 | |||||||
|
|
|
|
||||||
| Mean | Range | SD | Mean | Range | SD | t-value | p-value | |
| Age | 27.1 | 19–40 | 1.38 | 24.6 | 19–38 | 1.22 | 1.39 | .17 |
| Verbal IQ | 113.7 | 95–139 | 3.15 | 113.0 | 88–141 | 3.04 | .15 | .88 |
| Performance IQ | 113.9 | 89–138 | 3.18 | 115.2 | 99–133 | 3.08 | .27 | .78 |
| Full-scale IQ | 115.4 | 99–140 | 2.88 | 117.1 | 103–140 | 2.73 | .41 | .68 |
| RAADS total | 128.9 | 72–181 | 7.04 | 39.8 | 13–77 | 3.99 | 10.8 | <.0001 |
2.2. MRI data acquisition & surface based morphometry
MRI images were acquired using a 3T Siemens Allegra head-only scanner (Siemens Medical Inc., Erlangen, Germany) housed at the Civitan International Research Center, University of Alabama at Birmingham (UAB). Anatomical images have been acquired using high resolution T1-weighted scans using a 160 slice 3D MPRAGE volume scan with a TR = 200 msec, TE = 3.34 msec, flip angle = 12, FOV = 25.6, 256 × 256 matrix size, and 1 mm slice thickness. 3D volumes were visually examined by three researchers independently to confirm data quality (examining images for significant distortion due to head motion or scanner artifact). No participants needed to be excluded due to poor data quality.
Structural images were analyzed using FreeSurfer image analysis suite, which is documented and freely available (http://surfer.nmr.mgh.harvard.edu/) (Fischl, 2012; Fischl & Dale, 2000). The technical details of these procedures can be found in previous publications (Dale, Fischl, & Sereno, 1999; Dale & Sereno, 1993; Fischl & Dale, 2000; Fischl, Liu, & Dale, 2001; Fischl, Salat, et al., 2004; Fischl, Sereno, & Dale, 1999; Fischl, Sereno, Tootell, & Dale, 1999; Han et al., 2006; Jovicich et al., 2006; Ségonne et al., 2004). Images undergo skull stripping using a watershed/surface deformation procedure to remove non-brain tissue (Ségonne et al., 2004), transformation to Talairach space, segmentation of subcortical white and GM structures (Fischl et al., 2002; Fischl, van der Kouwe, et al., 2004), intensity normalization (Sled, Zijdenbos, & Evans, 1998) in order to correct for MR intensity non-uniformity mainly arising from variations in the sensitivity of the reception coil and from gradient-driven eddy currents (Sled et al., 1998), tessellation of the GM/WM boundaries, automated topology correction (Fischl et al., 2001; Ségonne, Pacheco, & Fischl, 2007), and surface deformation following intensity gradients to optimally place the gray/white and gray/CSF borders that most accurately define the transition to the other tissue class (Dale et al., 1999; Dale & Sereno, 1993; Fischl & Dale, 2000). Segmented images were visually inspected for acceptable segmentation. These images were then inflated and registered to a spherical atlas which separated the cortex into 66 regions of interest (ROI) (Desikan et al., 2006; Fischl, Salat, et al., 2004; Fischl, Sereno, et al., 1999). Segmented data were then parceled into units based on gyral and sulcal structure, resulting in values for cortical thickness, surface area, and volume (Desikan et al., 2006; Fischl, Salat, et al., 2004). Cortical thickness measurements as implemented in FreeSurfer have been validated against manual measurements (Kuperberg et al., 2003; Salat et al., 2004) and histological analysis (Rosas et al., 2002). Previous studies have found FreeSurfer morphometric procedures to have sufficient test-retest reliability across scanner manufacturers, field strengths, and other imaging parameters (Han et al., 2006; Jovicich et al., 2006; Wonderlick et al., 2009). Groups were compared on the resulting cortical thickness values using ANCOVAs conducted using SPSS 22.0 software. Age was used as a covariate for all between-group analyses, as well as average hemispheric cortical thickness.
2.3. 1H-MRS imaging
Imaging was performed on a 3T head-only scanner (Siemens Allegra, Erlangen, Germany) with a circularly polarized transmit/receive head coil. A series of sagittal, coronal, and axial T1-weighted anatomical scans were acquired for 1H-MRS voxel placement (gradient-recalled echo sequence; TR = 250 msec, TE = 3.48 msec, flip angle = 70°, 512 × 512 matrix size, 5 mm slice thickness, and 1.5 mm gap). Slices were aligned to anatomical midline to control for head tilt. The 1H-MRS voxel for dorsal anterior cingulate cortex (dACC) (20 × 27 × 10 mm) was positioned around the center of the ACC, identified centrally in the GM above the anterior corpus callosum. The 1H-MRS voxel for posterior cingulate cortex (PCC) (20 × 27 × 20 mm) was positioned above the splenium of the corpus callosum with the long axis parallel to the parietooccipital sulcus. These voxels were placed on the basis of the sagittal and coronal images, such that the amount of GM in the voxel as viewed on the T1-weighted images is maximized. Following manual shimming, to optimize field homogeneity across the voxel, water-suppressed spectra were collected with the point-resolved spectroscopy sequence (PRESS; TR/TE = 2000/80 msec, 1200 Hz spectral bandwidth, 1024 points, 128 averages, 4 min 24 sec scanning time).
MRS data were processed in jMRUI (version 5.0) (Naressi et al., 2001). The residual water peak was removed using the Hankel-Lanczos singular values decomposition filter (Pijnappel, Van den Boogaart, De Beer, & Van Ormondt, 1992). Spectra were quantified in the time domain by the AMARES algorithm (advanced method for accurate, robust, and efficient spectral fitting) (Vanhamme, van den Boogaart, & Van Huffel, 1997). AMARES is a quantification method that has been used to compute the spectral fitting parameters (e.g., amplitudes, frequencies, and linewidths for the metabolite peaks). Ratios of NAA, Cho, Cr, and Glx, with respect to Cr were calculated using the amplitudes of the time domain signal resulting from the AMARES analysis. Cramer-Rao lower bounds (CRLB) were used as a measure of uncertainty of the fitting procedure. Inclusion in analyses required ratios to have CRLB less than 20%; all participants' ratios were within these limits and were included in the final analyses.
High resolution anatomical data were processed using Statistical Parametric Mapping 8 (SPM8; Wellcome Trust Center for Neuroimaging) in MATLAB version 7.11.0 (Mathworks). Each participant's T1-weighted MPRAGE image was segmented into GM, WM (WM), and cerebrospinal fluid (CSF) using the segmentation routine in SPM8. Using native-space masks, we calculated the total GM, WM, and CSF volumes for the dACC and PCC ROI using a script adapted from John's SPM Gems (http://www-personal.umich.edu/∼nichols/JohnsGems.html) in MATLAB. The GM, WM, and CSF content were obtained in order to control for the tissue concentration of our acquired 1H-MRS voxels.
Statistical analyses were performed in SPSS 22.0. 1H-MRS ratios were compared using ANCOVA, covarying for age, and GM content.
2.4. DTI
Diffusion weighted images were collected using a single-shot, spin-echo, EPI sequence. A diffusion weighted, single-shot, spineecho, echo–planar imaging sequence was used (TR = 7000 msec, TE = 90 msec, bandwidth = 2790 Hz/voxel, FOV = 220 mm, and matrix size = 128 × 128 × 27, resulting in an in-plane resolution of 1.7 × 1.7 × 3 mm3). Twenty-seven 3-mm thick slices were imaged (no slice gap) with no diffusion-weighting (b = 0 sec/mm2) and with diffusion-weighting (b = 1000 sec/mm2) gradients applied in 46 orthogonal directions. Ninety-two images of each slice by gradient direction combination were acquired (two averages) to produce the final diffusion imaging dataset for each participant.
Diffusion images were preprocessed using the mrDiffusion package (Stanford VISTA Lab). Through this pipeline, participant head motion and eddy current distortions were removed by a 14-parameter constrained non-linear co-registration based on the expected pattern of distortions for each phase-encoded direction of the data (Rohde, Barnett, Basser, Marenco, & Pierpaoli, 2004). Diffusion weighted images were aligned to the unweighted (b = 0) images, and then rigid-body aligned to each subject's anatomical T1 reference image. Data were resampled to 2 × 2 × 2 mm3 voxels with a 7th order b-spline interpolation, taking into account head motion-correction, eddy-current distortion correction, and anatomical alignment transforms (Friston & Ashburner, 2004). The rotation components from the alignment steps were combined and applied to correctly orient the respective vectors. Finally, the tensor model was fit using a robust least-squares algorithm, and the resulting eigenvalues were used to compute FA, MD, radial diffusivity (RD), and axial diffusivity (AD) (Basser & Pierpaoli, 1996).
The preprocessed data were analyzed using Automated Fiber Quantification (AFQ) (Yeatman, Dougherty, Myall, Wandell, & Feldman, 2012). The data for each participant were subjected to whole-brain tractography (using deterministic tractography). The data were then segmented into tracts for left thalamic radiation, right thalamic radiation, left corticospinal, right corticospinal, left cingulum cingulate, right cingulum cingulate, left cingulum hippocampus, right cingulum hippocampus, callosum forceps major, callosum forceps minor, left inferior fronto-occipital fasciculus, right inferior fronto-occipital fasciculus, left inferior longitudinal fasciculus, right inferior longitudinal fasciculus, left superior longitudinal fasciculus, right superior longitudinal fasciculus, left uncinate, right uncinate, left arcuate, and right arcuate. The fibers were segmented in two steps: (1) fibers are selected if they pass through the waypoint ROIs that define the trajectory of the tract, and (2) high probability fibers, after comparison to a fiber probability map, are retained in the group (Hua et al., 2008; Yeatman et al., 2012; Zhang, Olivi, Hertig, van Zijl, & Mori, 2008). The 20 included fibers were based on the previously defined Mori WM atlas, selected due to its high reproducibility in adult WM (Hua et al., 2008; Wakana et al., 2007). Next, stray fibers were removed using an algorithm for rejecting statistical outliers, and tract properties (FA, RD, MD, and AD) were computed for 100 points along each tract for each participant. Norms for each fiber tract were determined using data from TD individuals [see (Yeatman et al., 2012) for a more detailed explanation of this method]. For some participants, tract properties for specific tracts could not be computed [due to artifact, head motion, or qualities (e.g., size or crossing fibers) of the tissue]. Tracts with greater than 10% of participants missing data (due to incomplete tractography) were removed from further analyses in order to keep the quality of the measures intact. These tracts included the left and right cingulum bundles. To compare the ASD and TD groups on FA, RD, MD, and AD, t-tests were conducted point-wise along each fiber tract for 100 points. A permutation based multiple comparison correction was applied to determine statistical significance (Nichols & Holmes, 2002), p < .05.
2.5. Decision tree pattern classification and regression
There is emerging consensus that while statistical separability is useful, it is not informative for predicting the diagnostic status of an individual subject. Nevertheless, the latter aspect is critical for assessing the clinical utility of imaging metrics. Therefore, we employed predictive models to examine the utility of multimodal neuroimaging measures for forecasting the diagnostic label as well as symptom severity of participants in this study. Decision tree is a class of Hierarchical Optimal Discriminant Predictive Models which map several input observations into the value of a target variable. When the target variable is discrete, the decision tree is referred to as a classification tree and when the target variable is continuous, it is referred to as a regression tree. The decision tree is derived by recursively partitioning the values of observed variables using top-down induction greedy search (Quinlan, 1986). Specifically we used the CART (Classification and Regression Trees) algorithm (Barros, Basgalupp, Carvalho, & Freitas, 2011; Loh, 2011) to perform this greedy search. The algorithm was initiated with one of the many given variables (FA/RD, CT or NAA) as the head node. At each node (including the head node), we determined the variable to be tested and the many possible splits of the variable's values. Each possible split yields a partition into two child nodes and we chose the partitions which resulted in a tree that minimized the weighted sum of the class impurities of each branch of the split. The recursion was stopped when further splitting did not improve the prediction. Class impurities were determined using the Gini impurity index (Coppersmith, Hong, & Hosking, 1999). Decision tree based classification was used for predicting the diagnostic label (TD or ASD) of a given subject, while regression was used for predicting autism symptom severity (RAADS-R). Leave-one-subject-out cross validation was performed for both regression and classification. Many previous studies have demonstrated the efficacy of decision trees for applications in MR-based diagnostics (Douglas, Harris, Yuille, & Cohen, 2011; Nair et al., 2013; Schiffmann & van der Knaap, 2009).
We illustrate decision tree based classification using a toy example. Values of three hypothetical variables X1, X2 and X3 were assigned for two classes: Class-1 and Class-2. The variables are analogous to multimodal neuroimaging measures and the classes are analogous to groups such as ASD and TD. A 3D scatter plot of the three variables is shown in Fig. 1A. The pattern obtained when a decision tree is built on this data is shown in Fig. 1B. In order to visualize the principle under this decision tree, the data are projected onto X1-X3 and X2-X3 planes as shown in Fig. 1C and D, respectively. Fig. 1C illustrates that X1 has very little discriminability between the classes. Hence it does not feature in the decision tree as it does not minimize class impurity. On the other hand, the decision point of X3 < .732 correctly separates examples belonging to Class-1, but for two mis-classifications. However, it is not possible to resolve these mis-classifications using information from the variable X1. When the X2-X3 projection was examined (see Fig. 1D), it is evident that X3 < .732 correctly separates examples belonging to Class-1, but for two mis-classifications. Critically, it is possible to resolve one of the two mis-classifications using an X2 < .483 decision point. The process described above is pictorially depicted by the decision tree in Fig. 1B. The CART algorithm essentially performs a greedy search in order to arrive at the decision tree with least number of mis-classifications. We also performed cross-validation so that the decision points are generalizable. This example also illustrates the meaning of the directionality shown in the decision tree. Rather than any physiological causal relationship between the variables, the directionality simply indicates the order in which the variables are considered and usually correspond to the order of importance of the corresponding variables for classification. The above example can be easily extended to decision tree based regression analyses where in, unlike classification, the target variable is continuous. In neuroimaging, a classic way of building a discriminative classification model for data shown in Fig. 1A utilizes support vector machines so that a hyper-plane is estimated which separates the two groups (Deshpande et al., 2013). Such a hyper-plane would be some linear combination of the variables and hence the decision boundary is nonintuitive since we understand separation between the classes in terms of each of the distinct variables. The decision tree also mirrors the process by which a physician might arrive ata particular diagnosis by eliminating alternate possibilities. Further, as shown before, decision trees generally perform better than the more popular support vector machines for classification (Douglas et al., 2011).
Fig. 1.
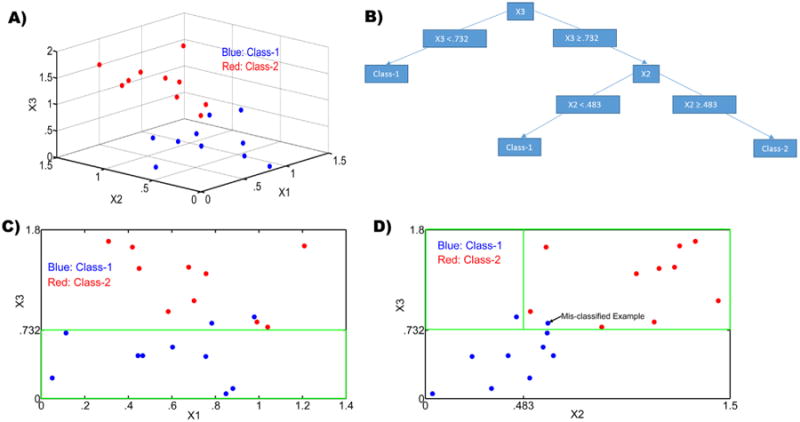
(A) The input feature space for our toy example showing a scatter plot of the three variables X1, X2 and X3 for two classes (shown in red and blue); (B) The decision tree obtained for the data in the toy example shown in A; (C) A projection of the data in A onto the X1–X3 plane. The green box corresponds to the feature space for the left arm of the decision tree in Fig. 1B, i.e., X3 < .732. It can be seen all that class-1 features (blue) are correctly classified; and (D) A projection of the data in A onto the X2-X3 plane. The green box corresponds to the feature space for the right arm of the decision tree in Fig. 1B, i.e., X3 < .732 & X2 < .483 and X3 < .732 & X2 > .483. It can be seen that a class-1 feature (blue) is correctly identified for X3 < .732 & X2 < .483 while another class-1 feature (blue) is mis-classified along with class-2 features for X3 < .732 & X2 > .483.
3. Results
3.1. Cortical thickness
Cortical thickness was increased in ASD participants, relative to TD controls, in left caudal anterior cingulate cortex [F(2,35) = 5.46, p = .025], left posterior cingulate cortex [F(2,35) = 5.84, p = .021], left isthmus cingulate cortex [F(2,35) = 7.21, p = .011], left pars opercularis aspect of the inferior frontal gyrus [F(2,35) = 4.87, p = .034], left inferior temporal gyrus F(2,35)=5.16, p =. 029], and right precuneus [F(2,35)=5.07, p = .03] (See Table 2). Regions with reduction in cortical thickness in ASD participants, compared to TD peers, included right cuneus [F(2,35)= 4.20, p = .048], and right precentral gyrus [F(2,35) = 5.54, p = .024] (See Table 2). It should be noted that these results did not survive multiple comparisons correction. Many of these regions are considered to be part of the social brain. These results are important given several of these regions have previously been reported as potential candidates for a reliable neural marker of ASD (Chiu et al., 2008; Kaiser et al., 2010; Spencer et al., 2011), and also considering their role in mediating the social deficits that are hallmark to the disorder.
Table 2. Group differences in cortical thickness, comparing TD and ASD adults.
| Region | F-statistic | p-value | Direction |
|---|---|---|---|
| (1) L Caudal Anterior Cingulate | 5.46 | .025 | ASD > TD |
| (2) L Posterior Cingulate | 5.84 | .021 | ASD > TD |
| (3) L Isthmus Cingulate | 7.27 | .011 | ASD > TD |
| (4) L Pars Opercularis | 4.87 | .034 | ASD > TD |
| (5) L Inferior Temporal | 5.16 | .029 | ASD > TD |
| (6) R Cuneus | 4.20 | .048 | TD > ASD |
| (7) R Precentral | 5.54 | .024 | TD > ASD |
| (8) R Precuneus | 5.07 | .030 | ASD > TD |
3.2. Neural metabolite concentration
For the dACC, the mean NAA/Cr ratio for the ASD group was significantly reduced (not multiple comparisons corrected) compared to the TD group, while there were no statistically significant group differences in Glx/Cr and Cho/Cr ratios (see Table 3). Mean amplitude for Cr, which was used as a reference, was not significantly different between the groups (F = 2.60, p = .11). For the PCC region, metabolite ratios did not significantly differ between the groups (see Table 3), and the mean amplitude for Cr was not significantly different between groups (F = 1.39, p = .24).
Table 3. Group differences in neurochemical concentrations for of the dACC and PCC, comparing ASD and TD adults.
| ROI | Metabolite | ASD (n = 19) | TD (n = 18) | Group differences | |
|---|---|---|---|---|---|
|
|
|
|
|||
| Mean (SD) | Mean (SD) | F-statistic | p-value | ||
| dACC | NAA/Cr | 1.39 (.08) | 1.47 (.08) | F(1,33) = 4.94 | .033 |
| CRLB,% | 4.57 (.003) | 5.03 (.003) | |||
| Glx/Cr | .74 (.09) | .78 (.09) | F(1,33) = .914 | .346 | |
| CRLB,% | 8.82 (.007) | 9.16 (.006) | |||
| Cho/Cr | .80 (.09) | .79 (.07) | F(1,33) = .004 | .952 | |
| CRLB,% | 3.35 (.002) | 3.57 (.002) | |||
| Linewidth, Hz | 4.84 (.87) | 4.55 (.68) | F(1,36) = 1.26 | .269 | |
| PCC | NAA/Cr | 1.49 (.06) | 1.51 (.08) | F(1,33) = .814 | .373 |
| CRLB,% | 3.17 (.001) | 3.56 (.002) | |||
| Glx/Cr | .74 (.07) | .75 (.08) | F(1,33) = .294 | .591 | |
| CRLB,% | 5.96 (.002) | 6.72 (.005) | |||
| Cho/Cr | .59 (.06) | .57 (.07) | F(1,33) = .960 | .334 | |
| CRLB,% | 2.01 (.0008) | 2.21 (.001) | |||
| Linewidth, Hz | 5.10 (.60) | 5.18 (1.57) | F(1,36) = .04 | .846 | |
3.3. Diffusion measures
The main finding here is a significant difference in WM connectivity of the forceps minor of the corpus callosum, with ASD participants showing significantly reduced FA compared to their TD peers on two clusters (p < .05, corrected) (See Fig. 2). Differences in FA occurred on two clusters of the forceps minor, one left and one right, towards the middle of each half, with no differences in FA in the middle most points of the tract (see Fig. 2 for a graph representing mean FA for both ASD and TD groups for the statistically significant cluster on the forceps minor). The same two clusters on the forceps minor also showed significant increases in RD for the ASD group compared to the TD group (p < .05, corrected). No significant differences in FA, RD, MD, or AD emerged between groups for the remaining 19 tracts after correcting for multiple comparisons.
Fig. 2.
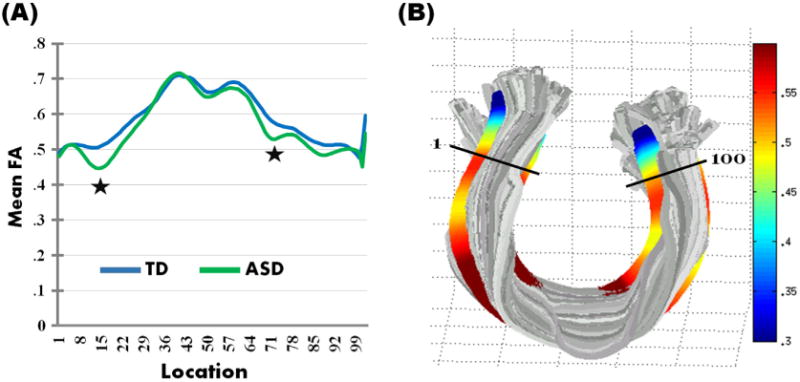
(A) Group means for fractional anisotropy (FA) for the nodes along the forceps minor of the corpus callosum for the TD (depicted in blue) and ASD (depicted in green) groups. The clusters with significant reduction in FA in ASD participants (p < .05, corrected) are indicated with a star; (B) A rendering of FA measurements for the forceps minor of the corpus callosum for one subject as a visualization of the tract properties. The tract segmentation was based on the previously defined Mori white matter atlas (Hua et al., 2008; Wakana et al., 2007).
3.4. Pattern classification: decision tree
Decision trees were generated based on combinations of the data to determine the best model for classification of participants by diagnostic group. Three sets of data points (DTI measurements, surface based cortical thickness measures, and neurochemical concentration) were combined to make two predictions (ASD or TD diagnosis). The data points included were the significant resulting values of the statistical analyses of separate neuroimaging modalities. The best decision tree model returned a classification accuracy of 91.9% ± .42, including RD for the right forceps minor, FA for the left forceps minor, and CT for the pars opercularis aspect of the inferior frontal gyrus as the best predictors (see Fig. 3). According to the decision tree, when the RD of right forceps minor is high, having higher FA in the left forceps minor results in a subject having decreased likelihood of an ASD classification while lower FA in the left forceps minor increased the likelihood of an ASD designation (see Figs. 3 and 4). Likewise, when the RD cluster is low, having higher CT in left pars opercularis of the IFG results in a subject more likely being classified as ASD, with lower CT in left pars opercularis reducing one's chance of an ASD classification (see Figs. 3 and 4).
Fig. 3.
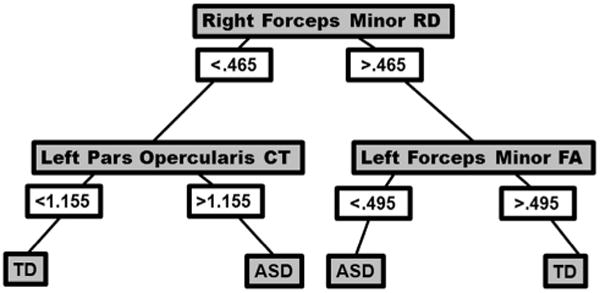
Decision tree for classification of autism (ASD) and typically developing (TD) groups, including the following predictors: right forceps minor radial diffusivity (RD), left Inferior Frontal Gyrus pars opercularis cortical thickness (CT), and left forceps minor fractional anisotropy (FA). Classification accuracy reached 91.9% ± .42.
Fig. 4.
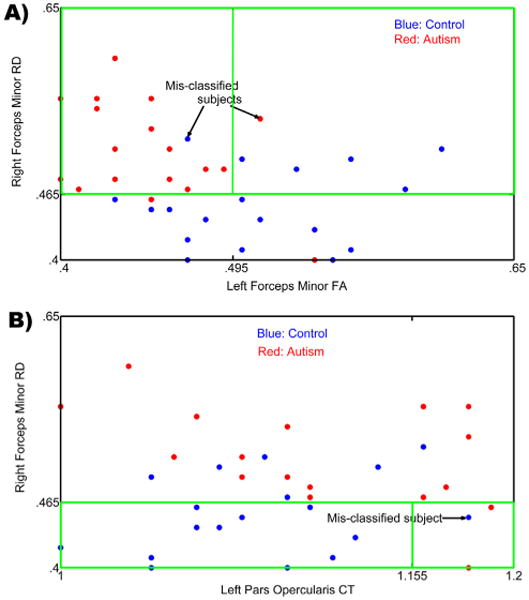
(A) A projection of the input feature space onto a 2D feature space containing the right forceps minor RD and left forceps minor FA as the two axes. The highlighted green box indicates the region in the feature space being utilized for classification which corresponds to the right side of the decision tree in Fig. 3. Blue indicates TD control participants and Red indicates ASD participants. Mis-classified subjects are shown using arrows; (B) A projection of the input feature space onto a 2D feature space containing the right forceps minor RD and left pars opercularis CT as the two axes. The highlighted box indicates the region in the feature space being utilized for classification which corresponds to the left side of the decision tree in Fig. 3. Blue indicates TD participants and Red indicates ASD participants. Mis-classified subject is shown using an arrow.
In order to establish the relationship between the neuroimaging measures and autism symptom severity (measured by the RAADS-R), a regression analysis was conducted, resulting in a root mean square error for predicting RAADS-R score of 18.72 for all subjects. Given that the mean difference in RAADS-R scores between the groups was 83.42, the mean squared error of 18.72 is demonstrating a large predictive effect. Based on the decision tree for this model, a number of relationships with symptom severity emerged (see Figs. 5 and 6). First, low FA in the left hemisphere cluster of the forceps minor accurately predicted higher symptom severity for all subjects. Next, higher symptom severity was predicted when the left FA measure was high, but measures of CT for left isthmus cingulate, left posterior cingulate, and right cuneus were low, and lower symptom severity was predicted when right cuneus CT was higher. Finally, when FA for left forceps minor was high, higher cortical thickness for left isthmus cingulate and left posterior cingulate and RD for the forceps minor resulted in moderate symptom severity, while low RD for the right forceps minor resulted in low symptom severity. See Supplementary Fig. 2 for correlations between the significant brain measures from the two classification trees and ASD symptom severity.
Fig. 5. Decision tree for a regression model including symptom severity scores (measured by RAADS-R) and significant factors including left forceps minor fractional anisotropy (FA), cortical thickness (CT) for left isthmus cingulate, left posterior cingulate, and right cuneus, and radial diffusivity (RD) for right forceps minor.
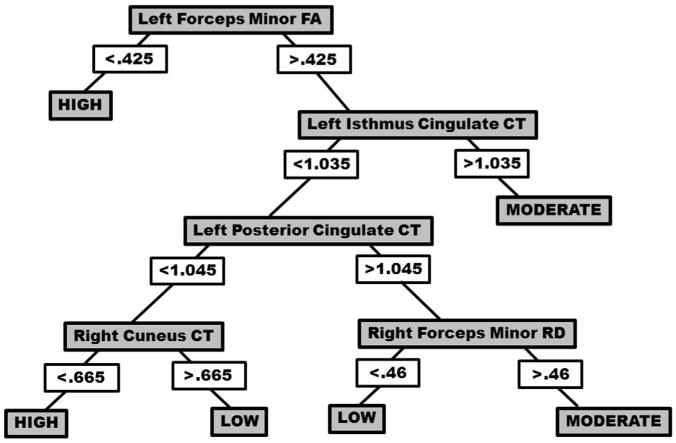
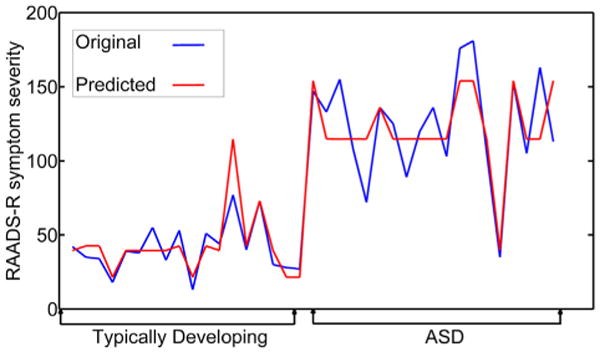
Fig. 6. Original (blue) and predicted (red) symptom severity (measured by RAADS-R) using a regression model including typically developing (TD) and autism (ASD) participants.
4. Discussion
The current study examined a cohort of adults with ASD and their TD peers using three different neuroimaging techniques, and found alterations in measurements of cortical thickness, WM connectivity, and neurochemical concentration in participants with ASD. Measures with differences between groups were investigated as potential predictors for diagnostic status of participants in a pattern classification analysis. While emphasizing the importance of understanding the neurobiology of complex disorders like autism at multiple comprehensive levels, our results also provide information about the relative sensitivity of these measures in classifying autism from typical individuals.
Surface based brain morphometry results indicated differences between the ASD and TD participants in this study. Reduced CT in precentral gyrus and cuneus and increased CT in cingulate cortex, IFG, and temporal cortex is in line with previous studies of surface based features in ASD (Ecker, Ginestet, et al., 2013; Ecker, Spooren, et al., 2013; Hyde et al., 2010; Mak-Fan et al., 2012; Wallace et al., 2010). Cortical thickness is an important measure of the brain which has anatomical and functional significance, especially to cognitive functioning and intelligence (Karama et al., 2009). Differences in CT may also reflect alterations in underlying cellular organization, density of neurons, and dendritic arborization/synaptic pruning. In postmortem studies of ASD, more numerous, smaller, and less compact minicolumns, compared to TD individuals, have been reported within middle temporal, superior and middle frontal, and temporoparietal cortices (Casanova, Buxhoeveden, et al., 2002; Casanova, Buxhoeveden, Switala, et al., 2002; Casanova et al., 2006), holding implications for the alterations seen in CT. The DTI finding of significantly reduced FA in the forceps minor of the corpus callosum in the ASD group is consistent with alterations in FA reported in previous studies of ASD. The forceps minor crosses the genu of the corpus callosum and radiates to the lateral and medial sides of prefrontal cortex. Previous studies have also found reduced FA (Jou et al., 2011; Keller et al., 2007) and increased RD in these regions in autism (Alexander et al., 2007; Ameis et al., 2011). Alterations in this tract could potentially affect the communication between the two hemispheres in the prefrontal cortex, and in how each side connects to the rest of the brain. In addition, the forceps minor may mediate anatomical connections between frontal lobe and rostral ACC, and between orbitofrontal cortex and nucleus accumbens (Tadayonnejad, Yang, Kumar, & Ajilore, 2014). Thus, the disruption in the diffusion of this tract can have significant consequence in brain connectivity. Our finding of reduced levels of NAA/Cr in dACC is in line with previous reports of lower NAA concentration in adults with autism in the ACC (Fujii et al., 2010), hippocampal-amygdala formation (Suzuki et al., 2010), and frontal, parietal, and occipital cortices (Kleinhans, Schweinsburg, Cohen, Müller, & Courchesne, 2007). Reduction in NAA, a neurochemical representing neuronal and axonal health and density, can be an indication of disease (Fayed et al., 2006; Maddock & Buonocore, 2012; Meyerhoff et al., 1993). Lower NAA level may also reflect alterations in soma integrity, the number of axon terminals (Lentz et al., 2005), and/or mitochondrial function (Bates et al., 1996; Stork & Renshaw, 2005).
Group differences found across all three neuroimaging modalities in our study point to ASD as a complex and multilayered neural disorder, with spatially distinct problems in cortical structure, WM integrity, and brain metabolism. It should be noted here that while the abnormalities can be seen at multiple levels examinedin this study,itis possible that one or more of these, but not all, may be more predictive of the core symptomatology of the disorder. Interestingly, the results of our pattern classification analysis are mostly along these lines. We found that predictors from DTI and SBM returned the highest classification accuracy among the three modalities of imaging (DTI, SBM, and 1H-MRS). In addition, higher FA in the left forceps minor decreased the chance of an ASD diagnosis when RD in the right forceps minor was high; and lower CT in pars opercularis of the IFG decreased one's chance of an ASD diagnosis when coupled with lower RD in the right forceps minor. It is certainly possible that the diffusion properties of the forceps minor are linked to CT in the left pars oper-cularis, especially considering the anatomical connections of the forceps minor with prefrontal cortex and that both measures come from frontal cortex. But it is not necessarily the case that they directly influence the anatomical or functional properties of one another. More specifically, the directionality in decision trees in classification analysis indicates the order in which metrics are considered for the best possible assignment of group membership to individual subjects; therefore, the causality indicated by the arrows in decision tree figures is information-theoretic rather than physiological.
The group differences in many spatially distinct regions (and across differing modalities) may suggest the involvement of several neural processes in ASD (e.g., altered diffusion across WM tracts, alterations in metabolic processes in brain cells, and alterations in cortical thickness). In the present study, although many differences were found across SBM, 1H-MRS, and DTI, the classification analysis returned the forceps minor and pars opercularis as the most predictive of group membership. This distinction, of which brain measures are most predictive of ASD classification, is important considering that many other disorders also share altered cortical structure, water diffusion, and brain metabolite concentration. Thus, it is critical to investigate which level and type of alterations are specific (or most predictive) of ASD. Examining group differences within one modality may not be sufficient considering the overlap with other disorders. This is best illustrated from Fig. 4A and B where in the number of mis-classified subjects would be much larger if only one of the metrics/modalities was considered. The decision tree in Fig. 3 also indicates that a favorable value for one of the measures will act as a protective factor against ASD even when another metric is unfavorable. This underscores the utility of employing classification using multiple modalities for understanding the etiology of complex neurodevelopmental disorders like autism.
While more accurate classification of ASD was made possible by contributions from both DTI and SBM, the predictor from 1H-MRS did not contribute the most accurate classification model. While these differences may reflect the abnormalities specific to individuals or subgroups, some variables may not be sufficient to separate participants for diagnostic group membership. In addition, it should be noted that while the diffusion measures survived multiple comparison correction, the SBM and 1H-MRS measures did not. This is a limitation of the current study (perhaps driven by relatively small sample size). This may also explain why the diffusion measures were prominently featured in both classification models, while the SBM was to a lesser degree, and the 1H-MRS measures were not included at all. However, overall, a multimodal approach returned the highest classification percentage, indicative of the potential benefit of including brain measures from many systems. Another limitation of the current study is that although high classification accuracy of participants was obtained, these results pertain to our sample of 19 high-functioning individuals. Although our participants were limited to those with normal and above average IQ, the brain measures included were advantageous in that they are structural and neurochemical in nature, and did not utilize a cognitive task (which would make it likely impossible to generalize to lower functioning individuals who may struggle to perform cognitive tasks). In order to improve generalizability of these findings, the multimodal imaging approach used in this study needs to be applied to a larger sample, to lower-functioning individuals, to younger children, and to a larger number of female participants. Less reliance on participant input in the measures used in this study, unlike fMRI, increases its applicability to classification of younger and lower-functioning patients.
Investigation into the relationship between the predictor variables and symptom severity showed relationship between FA for forceps minor and symptom severity, as well as combinations of DTI and SBM measures predicting high, moderate, and low symptom severity for all participants. Interestingly the DTI and SBM data interacted to mediate varying severity of ASD. This suggests different neural systems are related to different symptomatology, with perhaps not one modality explaining everything. Also, different combinations of variables potentially explain different behavioral outcomes. We found measures of CT, FA, and RD together to impact symptom severity. Thus, varying combinations of neural abnormalities could account for the heterogeneity in behavioral symptoms in ASD. Further research in these lines may aid establishing this relationship, and in identifying subgroups of individuals who share similar behavioral and neural profiles. Identifying subsets of individuals with differences in DTI, SBM, and 1H-MRS measures could lead to interventions that target the specific areas needed and have the most impact. This could be most fruitful for a disorder where treatment cannot be one size fits all.
The current study makes a vital contribution to the literature on the neuropathology of ASD, with its integrated approach and its application to testing the diagnostic utility of these measures. This method could potentially be applied to younger or lower functioning individuals in the future, increasing the utility of this approach. The relationship found between neural measures and symptoms demonstrate the role of the organization of cortical matter in determining behavior. Future studies should apply multimodal imaging to investigate classification and apply such a method to a validation cohort (participants who were not included in the analysis determining the predictors to include) to test the validity of this method. In addition, applying multimodal neuroimaging classification in younger children and lower functioning individuals may likely most benefit from such a technique as these methods are task-free. Overall, this study marks a contribution to the literature on neural markers of ASD, and is the first one, to our knowledge, to employ three neuroimaging modalities together and apply the results to classification of the disorder.
Supplementary Material
Acknowledgments
This study was fundedbythe UAB College ofArts and Sciences Interdisciplinary Innovation Award to RK. The authors would also like to thank Dr. Meredith Reid and David White for their assistance with the 1H-MRS aspect of this project. The authors would also like to thank Dr. Jason Yeatman, Dr. Franco Pestilli, Dr. Brian Wandell, and the Stanford Vision and Imaging Science and Technology Laboratory for providing access to the mrDiffusion and AFQ software, and their assistance with these resources.
Footnotes
Supplementary data: Supplementary data related to this article can be found at http://dx.doi.org/10.1016/j.cortex.2015.02.008.
References
- Adolphs R. The neurobiology of social cognition. Current Opinion in Neurobiology. 2001;11(2):231–239. doi: 10.1016/s0959-4388(00)00202-6. [DOI] [PubMed] [Google Scholar]
- Adolphs R. The social brain: neural basis of social knowledge. Annual Review of Psychology. 2009;60:693–716. doi: 10.1146/annurev.psych.60.110707.163514. http://dx.doi.org/10.1146/annurev.psych.60.110707.163514. [DOI] [PMC free article] [PubMed] [Google Scholar]
- Akshoomoff N, Lord C, Lincoln AJ, Courchesne RY, Carper RA, Townsend J, et al. Outcome classification of preschool children with autism spectrum disorders using MRI brain measures. Journal of the American Academy of Child & Adolescent Psychiatry. 2004;43(3):349–357. doi: 10.1097/00004583-200403000-00018. [DOI] [PubMed] [Google Scholar]
- Alexander AL, Lee JE, Lazar M, Boudos R, DuBray MB, Oakes TR, et al. Diffusion tensor imaging of the corpus callosum in Autism. NeuroImage. 2007;34(1):61–73. doi: 10.1016/j.neuroimage.2006.08.032. [DOI] [PubMed] [Google Scholar]
- Amaral DG, Schumann CM, Nordahl CW. Neuroanatomy of autism. Trends in Neurosciences. 2008;31(3):137–145. doi: 10.1016/j.tins.2007.12.005. [DOI] [PubMed] [Google Scholar]
- Ameis SH, Fan J, Rockel C, Voineskos AN, Lobaugh NJ, Soorya L, et al. Impaired structural connectivity of socio-emotional circuits in autism spectrum disorders: a diffusion tensor imaging study. PLoS One. 2011;6(11):e28044. doi: 10.1371/journal.pone.0028044. [DOI] [PMC free article] [PubMed] [Google Scholar]
- Anagnostou E, Taylor MJ. Review of neuroimaging in autism spectrum disorders: what have we learned and where we go from here. Molecular Autism. 2011;2(4) doi: 10.1186/2040-2392-2-4. [DOI] [PMC free article] [PubMed] [Google Scholar]
- Anderson JS, Nielsen JA, Froehlich AL, DuBray MB, Druzgal TJ, Cariello AN, et al. Functional connectivity magnetic resonance imaging classification of autism. Brain. 2011;134(12):3742–3754. doi: 10.1093/brain/awr263. [DOI] [PMC free article] [PubMed] [Google Scholar]
- Avino TA, Hutsler JJ. Abnormal cell patterning at the cortical graye–white matter boundary in autism spectrum disorders. Brain Research. 2010;1360:138–146. doi: 10.1016/j.brainres.2010.08.091. [DOI] [PubMed] [Google Scholar]
- Barnea-Goraly N, Kwon H, Menon V, Eliez S, Lotspeich L, Reiss AL. White matter structure in autism: preliminary evidence from diffusion tensor imaging. Biological Psychiatry. 2004;55(3):323–326. doi: 10.1016/j.biopsych.2003.10.022. [DOI] [PubMed] [Google Scholar]
- Barros R, Basgalupp M, Carvalho A, Freitas A. A survey of evolutionary algorithms for decision-tree induction. IEEE Transactions on Systems, Man and Cybernetics, Part C: Applications and Reviews. 2011;42(3):291–312. [Google Scholar]
- Basser PJ, Pierpaoli C. Microstructural and physiological features of tissues elucidated by quantitative-diffusion-tensor MRI. Journal of Magnetic Resonance, Series B. 1996;111(3):209–219. doi: 10.1006/jmrb.1996.0086. http://dx.doi.org/10.1006/jmrb.1996.0086. [DOI] [PubMed] [Google Scholar]
- Bates TE, Strangward M, Keelan J, Davey GP, Munro PM, Clark JB. Inhibition of N-acetylaspartate production: implications for 1H MRS studies in vivo. NeuroReport. 1996;7(8):1397–1400. [PubMed] [Google Scholar]
- Bloemen OJ, Deeley Q, Sundram F, Daly EM, Barker GJ, Jones DK, et al. White matter integrity in Asperger syndrome: a preliminary diffusion tensor magnetic resonance imaging study in adults. Autism Research. 2010;3(5):203–213. doi: 10.1002/aur.146. [DOI] [PubMed] [Google Scholar]
- Brambilla P, Hardan A, di Nemi SU, Perez J, Soares JC, et al. Brain anatomy and development in autism: review of structural MRI studies. Brain Research Bulletin. 2003;61(6):557–569. doi: 10.1016/j.brainresbull.2003.06.001. [DOI] [PubMed] [Google Scholar]
- Casanova MF, Buxhoeveden DP, Brown C. Clinical and macroscopic correlates of minicolumnar pathology in autism. Journal of Child Neurology. 2002;17(9):692–695. doi: 10.1177/088307380201700908. [DOI] [PubMed] [Google Scholar]
- Casanova MF, Buxhoeveden DP, Switala AE, Roy E. Minicolumnar pathology in autism. Neurology. 2002;58(3):428–432. doi: 10.1212/wnl.58.3.428. http://dx.doi.org/10.1212/wnl.58.3.428. [DOI] [PubMed] [Google Scholar]
- Casanova MF, van Kooten IA, Switala AE, van Engeland H, Heinsen H, Steinbusch HW, et al. Minicolumnar abnormalities in autism. Acta Neuropathologica. 2006;112(3):287–303. doi: 10.1007/s00401-006-0085-5. [DOI] [PubMed] [Google Scholar]
- Chen R, Jiao Y, Herskovits EH. Structural MRI in autism spectrum disorder. Pediatric Research. 2011;69:63R–68R. doi: 10.1203/PDR.0b013e318212c2b3. [DOI] [PMC free article] [PubMed] [Google Scholar]
- Chiu PH, Kayali MA, Kishida KT, Tomlin D, Klinger LG, Klinger MR, et al. Self responses along cingulate cortex reveal quantitative neural phenotype for high-functioning autism. Neuron. 2008;57(3):463–473. doi: 10.1016/j.neuron.2007.12.020. [DOI] [PMC free article] [PubMed] [Google Scholar]
- Chung MK, Robbins SM, Dalton KM, Davidson RJ, Alexander AL, Evans AC. Cortical thickness analysis in autism with heat kernel smoothing. NeuroImage. 2005;25(4):1256–1265. doi: 10.1016/j.neuroimage.2004.12.052. [DOI] [PubMed] [Google Scholar]
- Coppersmith D, Hong S, Hosking J. Partitioning nominal attributes in decision trees. Data Mining and Knowledge Discovery. 1999;3:197–217. [Google Scholar]
- Courchesne E, Campbell K, Solso S. Brain growth across the life span in autism: age-specific changes in anatomical pathology. Brain Research. 2011;1380:138–145. doi: 10.1016/j.brainres.2010.09.101. [DOI] [PMC free article] [PubMed] [Google Scholar]
- Coutanche MN, Thompson-Schill SL, Schultz RT. Multi-voxel pattern analysis of fMRI data predicts clinical symptom severity. NeuroImage. 2011;57(1):113–123. doi: 10.1016/j.neuroimage.2011.04.016. [DOI] [PMC free article] [PubMed] [Google Scholar]
- Dale AM, Fischl B, Sereno MI. Cortical surface-based analysis: I. Segmentation and surface reconstruction. NeuroImage. 1999;9(2):179–194. doi: 10.1006/nimg.1998.0395. [DOI] [PubMed] [Google Scholar]
- Dale AM, Sereno MI. Improved localizadon of cortical activity by combining EEG and MEG with MRI cortical surface reconstruction: a linear approach. Journal of Cognitive Neuroscience. 1993;5(2):162–176. doi: 10.1162/jocn.1993.5.2.162. [DOI] [PubMed] [Google Scholar]
- Deshpande G, Libero LE, Sreenivasan KR, Deshpande HD, Kana RK. Identification of neural connectivity signatures of autism using machine learning. Frontiers in Human Neuroscience. 2013;7 doi: 10.3389/fnhum.2013.00670. [DOI] [PMC free article] [PubMed] [Google Scholar]
- Desikan RS, Ségonne F, Fischl B, Quinn BT, Dickerson BC, Blacker D, et al. An automated labeling system for subdividing the human cerebral cortex on MRI scans into gyral based regions of interest. NeuroImage. 2006;31(3):968–980. doi: 10.1016/j.neuroimage.2006.01.021. [DOI] [PubMed] [Google Scholar]
- Douglas P, Harris S, Yuille A, Cohen M. Performance comparison of machine learning algorithms and number of independent components used in fMRI decoding of belief vs. disbelief. NeuroImage. 2011;56(2):544–553. doi: 10.1016/j.neuroimage.2010.11.002. [DOI] [PMC free article] [PubMed] [Google Scholar]
- Ecker C, Ginestet C, Feng Y, Johnston P, Lombardo MV, Lai MC, et al. Brain surface anatomy in adults with autism: the relationship between surface area, cortical thickness, and autistic symptoms. JAMA Psychiatry. 2013;70(1):59–70. doi: 10.1001/jamapsychiatry.2013.265. [DOI] [PubMed] [Google Scholar]
- Ecker C, Marquand A, Mourão-Miranda J, Johnston P, Daly EM, Brammer MJ, et al. Describing the brain in autism in five dimensions—dmagnetic resonance imaging-assisted diagnosis of autism spectrum disorder using a multiparameter classification approach. The Journal of Neuroscience. 2010;30(32):10612–10623. doi: 10.1523/JNEUROSCI.5413-09.2010. [DOI] [PMC free article] [PubMed] [Google Scholar]
- Ecker C, Rocha-Rego V, Johnston P, Mourao-Miranda J, Marquand A, Daly EM, et al. Investigating the predictive value of whole-brain structural MR scans in autism: a pattern classification approach. NeuroImage. 2010;49(1):44–56. doi: 10.1016/j.neuroimage.2009.08.024. [DOI] [PubMed] [Google Scholar]
- Ecker C, Spooren W, Murphy D. Translational approaches to the biology of Autism: false dawn or a new era? Molecular Psychiatry. 2013;18(4):435–442. doi: 10.1038/mp.2012.102. [DOI] [PMC free article] [PubMed] [Google Scholar]
- Fayed N, Olmos S, Morales H, Modrego PJ. Physical basis of magnetic resonance spectroscopy and its application to central nervous system diseases. American Journal of Applied Sciences. 2006;3(5):1836. [Google Scholar]
- Fischl B. FreeSurfer. NeuroImage. 2012;62(2):774–781. doi: 10.1016/j.neuroimage.2012.01.021. [DOI] [PMC free article] [PubMed] [Google Scholar]
- Fischl B, Dale AM. Measuring the thickness of the human cerebral cortex from magnetic resonance images. Proceedings of the National Academy of Sciences. 2000;97(20):11050–11055. doi: 10.1073/pnas.200033797. [DOI] [PMC free article] [PubMed] [Google Scholar]
- Fischl B, Liu A, Dale AM. Automated manifold surgery: constructing geometrically accurate and topologically correct models of the human cerebral cortex. IEEE Transactions on Medical Imaging. 2001;20(1):70–80. doi: 10.1109/42.906426. [DOI] [PubMed] [Google Scholar]
- Fischl B, Salat DH, Busa E, Albert M, Dieterich M, Haselgrove C, et al. Whole brain segmentation: automated labeling of neuroanatomical structures in the human brain. Neuron. 2002;33(3):341–355. doi: 10.1016/s0896-6273(02)00569-x. [DOI] [PubMed] [Google Scholar]
- Fischl B, Salat DH, van der Kouwe AJ, Makris N, Ségonne F, Quinn BT, et al. Sequence-independent segmentation of magnetic resonance images. NeuroImage. 2004;23:S69–S84. doi: 10.1016/j.neuroimage.2004.07.016. [DOI] [PubMed] [Google Scholar]
- Fischl B, Sereno MI, Dale AM. Cortical surface-based analysis: II: inflation, flattening, and a surface-based coordinate system. NeuroImage. 1999;9(2):195–207. doi: 10.1006/nimg.1998.0396. [DOI] [PubMed] [Google Scholar]
- Fischl B, Sereno MI, Tootell RB, Dale AM. High-resolution intersubject averaging and a coordinate system for the cortical surface. Human Brain Mapping. 1999;8(4):272–284. doi: 10.1002/(SICI)1097-0193(1999)8:4<272::AID-HBM10>3.0.CO;2-4. [DOI] [PMC free article] [PubMed] [Google Scholar]
- Fischl B, van der Kouwe A, Destrieux C, Halgren E, Ségonne F, Salat DH, et al. Automatically parcellating the human cerebral cortex. Cerebral Cortex. 2004;14(1):11–22. doi: 10.1093/cercor/bhg087. [DOI] [PubMed] [Google Scholar]
- Friston KJ, Ashburner J. Generative and recognition models for neuroanatomy. NeuroImage. 2004;23(1):21–24. doi: 10.1016/j.neuroimage.2004.04.021. http://dx.doi.org/10.1016/j.neuroimage.2004.04.021. [DOI] [PubMed] [Google Scholar]
- Fujii E, Mori K, Miyazaki M, Hashimoto T, Harada M, Kagami S. Function of the frontal lobe in autistic individuals: a proton magnetic resonance spectroscopic study. Journal of Medical Investigation. 2010;57(1–2):35–44. doi: 10.2152/jmi.57.35. [DOI] [PubMed] [Google Scholar]
- Groen WB, Buitelaar JK, Van Der Gaag RJ, Zwiers MP. Pervasive microstructural abnormalities in autism: a DTI study. Journal of Psychiatry & Neuroscience: JPN. 2011;36(1):32. doi: 10.1503/jpn.090100. [DOI] [PMC free article] [PubMed] [Google Scholar]
- Hadjikhani N, Joseph RM, Snyder J, Tager-Flusberg H. Anatomical differences in the mirror neuron system and social cognition network in autism. Cerebral Cortex. 2006;16(9):1276–1282. doi: 10.1093/cercor/bhj069. [DOI] [PubMed] [Google Scholar]
- Han X, Jovicich J, Salat D, van der Kouwe A, Quinn B, Czanner S, et al. Reliability of MRI-derived measurements of human cerebral cortical thickness: the effects of field strength, scanner upgrade and manufacturer. NeuroImage. 2006;32(1):180–194. doi: 10.1016/j.neuroimage.2006.02.051. [DOI] [PubMed] [Google Scholar]
- Hardan A, Muddasani S, Vemulapalli M, Keshavan M, Minshew N. An MRI study of increased cortical thickness in autism. American Journal of Psychiatry. 2006;163(7):1290–1292. doi: 10.1176/appi.ajp.163.7.1290. [DOI] [PMC free article] [PubMed] [Google Scholar]
- Hazlett HC, Poe M, Gerig G, Smith RG, Provenzale J, Ross A, et al. Magnetic resonance imaging and head circumference study of brain size in autism: birth through age 2 years. Archives of General Psychiatry. 2005;62(12):1366–1376. doi: 10.1001/archpsyc.62.12.1366. [DOI] [PubMed] [Google Scholar]
- Hazlett HC, Poe MD, Gerig G, Styner M, Chappell C, Smith RG, et al. Early brain overgrowth in autism associated with an increase in cortical surface area before age 2 years. Archives of General Psychiatry. 2011;68(5):467–476. doi: 10.1001/archgenpsychiatry.2011.39. [DOI] [PMC free article] [PubMed] [Google Scholar]
- Hua K, Zhang J, Wakana S, Jiang H, Li X, Reich DS, et al. Tract probability maps in stereotaxic spaces: analyses of white matter anatomy and tract-specific quantification. NeuroImage. 2008;39(1):336–347. doi: 10.1016/j.neuroimage.2007.07.053. http://dx.doi.org/10.1016/j.neuroimage.2007.07.053. [DOI] [PMC free article] [PubMed] [Google Scholar]
- Hutsler JJ, Love T, Zhang H. Histological and magnetic resonance imaging assessment of cortical layering and thickness in autism spectrum disorders. Biological Psychiatry. 2007;61(4):449–457. doi: 10.1016/j.biopsych.2006.01.015. [DOI] [PubMed] [Google Scholar]
- Hutsler JJ, Zhang H. Increased dendritic spine densities on cortical projection neurons in autism spectrum disorders. Brain Research. 2010;1309:83–94. doi: 10.1016/j.brainres.2009.09.120. [DOI] [PubMed] [Google Scholar]
- Huttenlocher PR. Morphometric study of human cerebral cortex development. Neuropsychologia. 1990;28(6):517–527. doi: 10.1016/0028-3932(90)90031-i. [DOI] [PubMed] [Google Scholar]
- Hyde KL, Samson F, Evans AC, Mottron L. Neuroanatomical differences in brain areas implicated in perceptual and other core features of autism revealed by cortical thickness analysis and voxel-based morphometry. Human Brain Mapping. 2010;31(4):556–566. doi: 10.1002/hbm.20887. [DOI] [PMC free article] [PubMed] [Google Scholar]
- Ingalhalikar M, Parker D, Bloy L, Roberts TP, Verma R. Diffusion based abnormality markers of pathology: toward learned diagnostic prediction of ASD. NeuroImage. 2011;57(3):918–927. doi: 10.1016/j.neuroimage.2011.05.023. [DOI] [PMC free article] [PubMed] [Google Scholar]
- Ipser JC, Syal S, Bentley J, Adnams CM, Steyn B, Stein DJ. 1H-MRS in autism spectrum disorders: a systematic meta-analysis. Metabolic Brain Disease. 2012;27(3):275–287. doi: 10.1007/s11011-012-9293-y. [DOI] [PubMed] [Google Scholar]
- Jiao Y, Chen R, Ke X, Cheng L, Chu K, Lu Z, et al. Predictive models for subtypes of autism spectrum disorder based on single-nucleotide polymorphisms and magnetic resonance imaging. Advances in Medical Sciences. 2011;56(2):334–342. doi: 10.2478/v10039-011-0042-y. [DOI] [PubMed] [Google Scholar]
- Jiao Y, Chen R, Ke X, Chu K, Lu Z, Herskovits EH. Predictive models of autism spectrum disorder based on brain regional cortical thickness. NeuroImage. 2010;50(2):589–599. doi: 10.1016/j.neuroimage.2009.12.047. [DOI] [PMC free article] [PubMed] [Google Scholar]
- Jou R, Mateljevic N, Kaiser M, Sugrue D, Volkmar F, Pelphrey K. Structural neural phenotype of autism: preliminary evidence from a diffusion tensor imaging study using tract-based spatial statistics. American Journal of Neuroradiology. 2011;32(9):1607–1613. doi: 10.3174/ajnr.A2558. [DOI] [PMC free article] [PubMed] [Google Scholar]
- Jovicich J, Czanner S, Greve D, Haley E, van der Kouwe A, Gollub R, et al. Reliability in multi-site structural MRI studies: effects of gradient non-linearity correction on phantom and human data. NeuroImage. 2006;30(2):436–443. doi: 10.1016/j.neuroimage.2005.09.046. [DOI] [PubMed] [Google Scholar]
- Kaiser MD, Hudac CM, Shultz S, Lee SM, Cheung C, Berken AM, et al. Neural signatures of autism. Proceedings of the National Academy of Sciences. 2010;107(49):21223–21228. doi: 10.1073/pnas.1010412107. [DOI] [PMC free article] [PubMed] [Google Scholar]
- Kaiser MD, Pelphrey KA. Disrupted action perception in autism: behavioral evidence, neuroendophenotypes, and diagnostic utility. Developmental Cognitive Neuroscience. 2012;2(1):25–35. doi: 10.1016/j.dcn.2011.05.005. [DOI] [PMC free article] [PubMed] [Google Scholar]
- Kana RK, Libero LE, Moore MS. Disrupted cortical connectivity theory as an explanatory model for autism spectrum disorders. Physics of Life Reviews. 2011;8(4):410–437. doi: 10.1016/j.plrev.2011.10.001. [DOI] [PubMed] [Google Scholar]
- Karama S, Ad-Dab'bagh Y, Haier R, Deary I, Lyttelton O, Lepage C, et al. Positive association between cognitive ability and cortical thickness in a representative US sample of healthy 6 to 18 year-olds. Intelligence. 2009;37(2):145–155. doi: 10.1016/j.intell.2008.09.006. [DOI] [PMC free article] [PubMed] [Google Scholar]
- Keller TA, Kana RK, Just MA. A developmental study of the structural integrity of white matter in autism. NeuroReport. 2007;18:23–27. doi: 10.1097/01.wnr.0000239965.21685.99. [DOI] [PubMed] [Google Scholar]
- Kleinhans NM, Schweinsburg BC, Cohen DN, Müller RA, Courchesne E. N-acetyl aspartate in autism spectrum disorders: regional effects and relationship to fMRI activation. Brain Research. 2007;1162:85–97. doi: 10.1016/j.brainres.2007.04.081. [DOI] [PMC free article] [PubMed] [Google Scholar]
- Kuperberg GR, Broome MR, McGuire PK, David AS, Eddy M, Ozawa F, et al. Regionally localized thinning of the cerebral cortex in schizophrenia. Archives of General Psychiatry. 2003;60(9):878–888. doi: 10.1001/archpsyc.60.9.878. [DOI] [PubMed] [Google Scholar]
- Lange N, DuBray MB, Lee JE, Froimowitz MP, Froehlich A, Adluru N, et al. Atypical diffusion tensor hemispheric asymmetry in autism. Autism Research. 2010;3(6):350–358. doi: 10.1002/aur.162. [DOI] [PMC free article] [PubMed] [Google Scholar]
- Lee JE, Bigler ED, Alexander AL, Lazar M, DuBray MB, Chung MK, et al. Diffusion tensor imaging of white matter in the superior temporal gyrus and temporal stem in autism. Neuroscience Letters. 2007;424(2):127–132. doi: 10.1016/j.neulet.2007.07.042. [DOI] [PubMed] [Google Scholar]
- Lentz MR, Kim JP, Westmoreland SV, Greco JB, Fuller RA, Ratai EM, et al. Quantitative neuropathologic correlates of changes in ratio of N-acetylaspartate to creatine in macaque brain. Radiology. 2005;235(2):461–468. doi: 10.1148/radiol.2352040003. http://dx.doi.org/10.1148/radiol.2352040003. [DOI] [PubMed] [Google Scholar]
- Libero LE, Kana RK. Advancing our understanding of the brain in autism: contribution of functional MRI and diffusion tensor imaging. Imaging in Medicine. 2013;5(5):453–465. [Google Scholar]
- Loh WY. Classification and regression trees. Data Mining and Knowledge Discovery. 2011;1:14–23. [Google Scholar]
- Lord C, Risi S, Lambrecht L, Cook EH, Jr, Leventhal BL, DiLavore PC, et al. The Autism diagnostic observation Scheduled—Generic: a standard measure of social and communication deficits associated with the spectrum of autism. Journal of Autism and Developmental Disorders. 2000;30(3):205–223. [PubMed] [Google Scholar]
- Maddock RJ, Buonocore MH. Brain Imaging in Behavioral Neuroscience. Springer; 2012. MR spectroscopic studies of the brain in psychiatric disorders; pp. 199–251. [DOI] [PubMed] [Google Scholar]
- Mak-Fan KM, Taylor MJ, Roberts W, Lerch JP. Measures of cortical grey matter structure and development in children with autism spectrum disorder. Journal of Autism and Developmental Disorders. 2012;42(3):419–427. doi: 10.1007/s10803-011-1261-6. [DOI] [PubMed] [Google Scholar]
- Maximo JO, Cadena EJ, Kana RK. The implications of brain connectivity in the neuropsychology of autism. Neuropsychology Review. 2014;24(1):16–31. doi: 10.1007/s11065-014-9250-0. [DOI] [PMC free article] [PubMed] [Google Scholar]
- Meyerhoff DJ, MacKay S, Bachman L, Poole N, Dillon W, Weiner M, et al. Reduced brain N-acetylaspartate suggests neuronal loss in cognitively impaired human immunodeficiency virus-seropositive individuals in vivo 1H magnetic resonance spectroscopic imaging. Neurology. 1993;43(3 Part 1):509–509. doi: 10.1212/wnl.43.3_part_1.509. [DOI] [PubMed] [Google Scholar]
- Murdaugh DL, Shinkareva SV, Deshpande HR, Wang J, Pennick MR, Kana RK. Differential deactivation during mentalizing and classification of autism based on default mode network connectivity. PLoS One. 2012;7(11):e50064. doi: 10.1371/journal.pone.0050064. [DOI] [PMC free article] [PubMed] [Google Scholar]
- Nair S, Tan L, Mohd Ramli N, Lim S, Rahmat K, Mohd Nor H. A decision tree for differentiating multiple system atrophy from Parkinson's disease using 3-T MR imaging. European Radiology. 2013;23(6):1459–1466. doi: 10.1007/s00330-012-2759-9. [DOI] [PubMed] [Google Scholar]
- Naressi A, Couturier C, Devos J, Janssen M, Mangeat C, De Beer R, et al. Java-based graphical user interface for the MRUI quantitation package. Magnetic Resonance Materials in Physics, Biology and Medicine. 2001;12(2–3):141–152. doi: 10.1007/BF02668096. [DOI] [PubMed] [Google Scholar]
- Nichols TE, Holmes AP. Nonparametric permutation tests for functional neuroimaging: a primer with examples. Human Brain Mapping. 2002;15(1):1–25. doi: 10.1002/hbm.1058. [DOI] [PMC free article] [PubMed] [Google Scholar]
- Nickl-Jockschat T, Habel U, Maria Michel T, Manning J, Laird AR, Fox PT, et al. Brain structure anomalies in autism spectrum disorder—a meta-analysis of VBM studies using anatomic likelihood estimation. Human Brain Mapping. 2012;33(6):1470–1489. doi: 10.1002/hbm.21299. [DOI] [PMC free article] [PubMed] [Google Scholar]
- Oldfield RC. The assessment and analysis of handedness: the Edinburgh inventory. Neuropsychologia. 1971;9(1):97–113. doi: 10.1016/0028-3932(71)90067-4. [DOI] [PubMed] [Google Scholar]
- Pijnappel W, Van den Boogaart A, De Beer R, Van Ormondt D. SVD-based quantification of magnetic resonance signals. Journal of Magnetic Resonance (1969) 1992;97(1):122–134. [Google Scholar]
- Quinlan J. Induction of decision trees. Machine Learning. 1986;1:81–106. [Google Scholar]
- Rakic P. Specification of cerebral cortical areas. Science. 1988;241(4862):170–176. doi: 10.1126/science.3291116. [DOI] [PubMed] [Google Scholar]
- Raznahan A, Toro R, Daly E, Robertson D, Murphy C, Deeley Q, et al. Cortical anatomy in autism spectrum disorder: an in vivo MRI study on the effect of age. Cerebral Cortex. 2010;20(6):1332–1340. doi: 10.1093/cercor/bhp198. [DOI] [PubMed] [Google Scholar]
- Ritvo RA, Ritvo ER, Guthrie D, Ritvo MJ, Hufnagel DH, McMahon W, et al. The Ritvo Autism asperger diagnostic scale-revised (RAADS-R): a scale to assist the diagnosis of Autism spectrum disorder in adults: an international validation study. Journal of Autism and Developmental Disorders. 2011;41(8):1076–1089. doi: 10.1007/s10803-010-1133-5. [DOI] [PMC free article] [PubMed] [Google Scholar]
- Rohde GK, Barnett AS, Basser PJ, Marenco S, Pierpaoli C. Comprehensive approach for correction of motion and distortion in diffusion-weighted MRI. Magnetic Resonance in Medicine. 2004;51(1):103–114. doi: 10.1002/mrm.10677. http://dx.doi.org/10.1002/mrm.10677. [DOI] [PubMed] [Google Scholar]
- Rosas H, Liu A, Hersch S, Glessner M, Ferrante R, Salat D, et al. Regional and progressive thinning of the cortical ribbon in Huntington's disease. Neurology. 2002;58(5):695–701. doi: 10.1212/wnl.58.5.695. [DOI] [PubMed] [Google Scholar]
- Rutter M, Le Couteur A, Lord C. Autism diagnostic interview-revised. Los Angeles, CA: Western Psychological Services; 2003. [Google Scholar]
- Salat DH, Buckner RL, Snyder AZ, Greve DN, Desikan RS, Busa E, et al. Thinning of the cerebral cortex in aging. Cerebral Cortex. 2004;14(7):721–730. doi: 10.1093/cercor/bhh032. [DOI] [PubMed] [Google Scholar]
- Scheel C, Rotarska-Jagiela A, Schilbach L, Lehnhardt FG, Krug B, Vogeley K, et al. Imaging derived cortical thickness reduction in high-functioning autism: key regions and temporal slope. NeuroImage. 2011;58(2):391–400. doi: 10.1016/j.neuroimage.2011.06.040. [DOI] [PubMed] [Google Scholar]
- Schiffmann R, van der Knaap M. Invited article: an MRI-based approach to the diagnosis of white matter disorders. Neurology. 2009;72(8):750–759. doi: 10.1212/01.wnl.0000343049.00540.c8. [DOI] [PMC free article] [PubMed] [Google Scholar]
- Schipul SE, Keller TA, Just MA. Inter-regional brain communication and its disturbance in autism. Frontiers in Systems Neuroscience. 2011;5(10):7. doi: 10.3389/fnsys.2011.00010. [DOI] [PMC free article] [PubMed] [Google Scholar]
- Ségonne F, Dale A, Busa E, Glessner M, Salat D, Hahn H, et al. A hybrid approach to the skull stripping problem in MRI. NeuroImage. 2004;22(3):1060–1075. doi: 10.1016/j.neuroimage.2004.03.032. [DOI] [PubMed] [Google Scholar]
- Ségonne F, Pacheco J, Fischl B. Geometrically accurate topology-correction of cortical surfaces using nonseparating loops. IEEE Transactions on Medical Imaging. 2007;26(4):518–529. doi: 10.1109/TMI.2006.887364. [DOI] [PubMed] [Google Scholar]
- Shukla DK, Keehn B, Lincoln AJ, Muller RA. White matter compromise of callosal and subcortical fiber tracts in children with autism spectrum disorder: a diffusion tensor imaging study. Journal of the American Academy of Child & Adolescent Psychiatry. 2010;49(12):1269–1278. e1262. doi: 10.1016/j.jaac.2010.08.018. [DOI] [PMC free article] [PubMed] [Google Scholar]
- Sled JG, Zijdenbos AP, Evans AC. A nonparametric method for automatic correction of intensity nonuniformity in MRI data. IEEE Transactions on Medical Imaging. 1998;17(1):87–97. doi: 10.1109/42.668698. [DOI] [PubMed] [Google Scholar]
- Sowell ER, Thompson PM, Leonard CM, Welcome SE, Kan E, Toga AW. Longitudinal mapping of cortical thickness and brain growth in normal children. The Journal of Neuroscience. 2004;24(38):8223–8231. doi: 10.1523/JNEUROSCI.1798-04.2004. [DOI] [PMC free article] [PubMed] [Google Scholar]
- Spencer M, Holt R, Chura L, Suckling J, Calder A, Bullmore E, et al. A novel functional brain imaging endophenotype of autism: the neural response to facial expression of emotion. Translational Psychiatry. 2011;1(7):e19. doi: 10.1038/tp.2011.18. [DOI] [PMC free article] [PubMed] [Google Scholar]
- Stanfield AC, McIntosh AM, Spencer MD, Philip R, Gaur S, Lawrie SM. Towards a neuroanatomy of autism: a systematic review and meta-analysis of structural magnetic resonance imaging studies. European Psychiatry. 2008;23(4):289–299. doi: 10.1016/j.eurpsy.2007.05.006. [DOI] [PubMed] [Google Scholar]
- Stanley JA. In vivo magnetic resonance spectroscopy and its application to neuropsychiatric disorders. Canadian Journal of Psychiatry Revue canadienne de psychiatrie. 2002;47(4):315–326. doi: 10.1177/070674370204700402. [DOI] [PubMed] [Google Scholar]
- Stoner R, Chow ML, Boyle MP, Sunkin SM, Mouton PR, Roy S, et al. Patches of disorganization in the neocortex of children with autism. New England Journal of Medicine. 2014;370(13):1209–1219. doi: 10.1056/NEJMoa1307491. [DOI] [PMC free article] [PubMed] [Google Scholar]
- Stork C, Renshaw P. Mitochondrial dysfunction in bipolar disorder: evidence from magnetic resonance spectroscopy research. Molecular Psychiatry. 2005;10(10):900–919. doi: 10.1038/sj.mp.4001711. [DOI] [PubMed] [Google Scholar]
- Suzuki K, Nishimura K, Sugihara G, Nakamura K, Tsuchiya KJ, Matsumoto K, et al. Metabolite alterations in the hippocampus of high-functioning adult subjects with autism. The International Journal of Neuropsychopharmacology. 2010;13(04):529–534. doi: 10.1017/S1461145709990952. [DOI] [PubMed] [Google Scholar]
- Tadayonnejad R, Yang S, Kumar A, Ajilore O. Multimodal brain connectivity analysis in unmedicated late-life depression. PLoS One. 2014;9(4):e96033. doi: 10.1371/journal.pone.0096033. [DOI] [PMC free article] [PubMed] [Google Scholar]
- Travers BG, Adluru N, Ennis C, Tromp do PM, Destiche D, Doran S, et al. Diffusion tensor imaging in autism spectrum disorder: a review. Autism Research. 2012;5(5):289–313. doi: 10.1002/aur.1243. http://dx.doi.org/10.1002/aur.1243. [DOI] [PMC free article] [PubMed] [Google Scholar]
- Uddin LQ, Menon V, Young CB, Ryali S, Chen T, Khouzam A, et al. Multivariate searchlight classification of structural magnetic resonance imaging in children and adolescents with autism. Biological Psychiatry. 2011;70(9):833–841. doi: 10.1016/j.biopsych.2011.07.014. [DOI] [PMC free article] [PubMed] [Google Scholar]
- Vanhamme L, van den Boogaart A, Van Huffel S. Improved method for accurate and efficient quantification of MRS data with use of prior knowledge. Journal of Magnetic Resonance. 1997;129(1):35–43. doi: 10.1006/jmre.1997.1244. [DOI] [PubMed] [Google Scholar]
- Wakana S, Caprihan A, Panzenboeck MM, Fallon JH, Perry M, Gollub RL, et al. Reproducibility of quantitative tractography methods applied to cerebral white matter. NeuroImage. 2007;36(3):630–644. doi: 10.1016/j.neuroimage.2007.02.049. http://dx.doi.org/10.1016/j.neuroimage.2007.02.049. [DOI] [PMC free article] [PubMed] [Google Scholar]
- Wallace GL, Dankner N, Kenworthy L, Giedd JN, Martin A. Age-related temporal and parietal cortical thinning in autism spectrum disorders. Brain. 2010;133(12):3745–3754. doi: 10.1093/brain/awq279. [DOI] [PMC free article] [PubMed] [Google Scholar]
- Wechsler D. Wechsler abbreviated scale of intelligence. Psychological Corporation; 1999. [Google Scholar]
- Wonderlick J, Ziegler DA, Hosseini-Varnamkhasti P, Locascio J, Bakkour A, Van Der Kouwe A, et al. Reliability of MRI-derived cortical and subcortical morphometric measures: effects of pulse sequence, voxel geometry, and parallel imaging. NeuroImage. 2009;44(4):1324–1333. doi: 10.1016/j.neuroimage.2008.10.037. [DOI] [PMC free article] [PubMed] [Google Scholar]
- Yeatman JD, Dougherty RF, Myall NJ, Wandell BA, Feldman HM. Tract profiles of white matter properties: automating fiber-tract quantification. PLoS One. 2012;7(11):e49790. doi: 10.1371/journal.pone.0049790. [DOI] [PMC free article] [PubMed] [Google Scholar]
- Zhang W, Olivi A, Hertig SJ, van Zijl P, Mori S. Automated fiber tracking of human brain white matter using diffusion tensor imaging. NeuroImage. 2008;42(2):771–777. doi: 10.1016/j.neuroimage.2008.04.241. http://dx.doi.org/10.1016/j.neuroimage.2008.04.241. [DOI] [PMC free article] [PubMed] [Google Scholar]
Associated Data
This section collects any data citations, data availability statements, or supplementary materials included in this article.