

Abstract
Objective:
To compare 2 digital methods to determine median sagittal plane of three-dimensional facial data—the interactive closest point algorithm and Procrustes analysis.
Methods:
The three-dimensional facial data of the 30 volunteers were got by the Face Scan 3D optical sensor (3D-Shape GmbH, Erlangen, Germany), and then were input to the reverse engineering software Imageware 13.0 (Siemens, Plano, TX) and Geomagic 2012 (Cary, NC). Their mirrored data were acquired and superimposed with the original data by the methods of interactive closest points and Procrustes analysis. The median sagittal planes of the 2 methods were extracted from the original and mirrored facial data respectively, 3 asymmetry indices were measured for comparison. Differences between the facial asymmetry indices of the 2 methods were evaluated using the paired sample t-test.
Results:
In terms of the 3 asymmetry indices, there were no significant differences between interactive closest points and Procrustes analysis for extracting median sagittal plane from three-dimensional facial data.(t = 0.0.060, P = 0.953 for asymmetry index (AI) 1, t = −0.926, P = 0.362 for AI 2, t = 1.1172, P = 0.0.251 for AI 3).
Conclusions:
In this evaluation of 30 subjects, the Procrustes analysis and the interactive closest point median-sagittal planes were similar in terms of the 3 asymmetry indices. Thus, Procrustes analysis and interactive closest point can both be used to abstract median sagittal plane from three-dimensional facial data.
Keywords: Face scan, interactive closest point, median sagittal plane, Procrustes analysis, three-dimensional facial data
Symmetry is a significant factor influencing the attractiveness of human faces. It is always a concern of patients as well as doctors, especially orthodontists and surgeons. The classic definition of facial symmetry refers to a state of equilibrium1: in which there is a correspondence in size, shape, and arrangement of facial landmarks on the opposite sides of the median sagittal plane. Hence, it is considerably important to determine the median-sagittal plane (MSP) for every patient prior surgery.
Landmark-dependent methods have traditionally been the mainstream approach for the assessment of facial asymmetry.2,3 These methods, however, have been questioned because of unreliable identification of landmarks. The landmarks are often not exactly in the middle of the face, thus resulting in the unreliable MSP. Furthermore, landmark-dependent methods are also incapable of depicting asymmetries in regions where landmarks are few and far between.4,5
Most research on facial symmetry has been conducted using two-dimensional (2D) methods. Posterior–anterior radiographs1 and the panoramic6 are 2 traditional methods used for the analysis of hard-tissue asymmetry. Anthropometry7 and photography8 have been used to evaluate soft-tissue asymmetry. Clearly, the perception of three-dimensional structure at a two-dimensional level can lead to the loss of some data.
With the rapid advent of three-dimensional scanning, holography and stereo photogrammetry, we can get a three-dimensional review of facial asymmetry. The interactive closest point algorithm (ICP)9 was already widely used to compute MSP for three-dimensional facial data, and Procrustes analysis (PA)10 was also reported for three-dimensional data. It is a morphometric approach to determine the MSP by using visually intact regions unaffected by the asymmetry as the reference.
Both the ICP and the PA11 methods have already been reported for determining the MSP for normal subjects with no obvious facial asymmetry, but there were few articles for comparison between the 2 methods. The aim of this article is to compare the 2 digital methods for extracting MSP from three-dimensional facial data.
MATERIALS AND METHODS
Patients and Data Samples
Thirty patients at the Peking University School and Hospital of Stomatology were recruited as volunteers for our study. The inclusion criteria were age 20 to 40 years, Chinese, and in good overall health; whereas the exclusion criteria were a history of previous craniofacial trauma, surgery, congenital anomalies, and significant clinical facial asymmetry. An ongoing orthodontic treatment was not a reason for exclusion.
Image Acquisition and Processing
A Face Scan optical 3D sensor was used to acquire the facial surface data of every volunteer. The equipment was supplied by the company 3D-Shape GmbH (Erlangen, Germany) and is based on a phase-measuring triangulation method.12 We obtained the facial data in only 0.3 milliseconds with high trueness in the z-direction (0.2 mm), and the entire process was contact less. There was no need for special safety precautions to protect subjects because the light intensity was low and there was no ionizing radiation. The 30 subjects were scanned at a distance of 135 cm from the scanner in natural head position, which was proven to be clinically reliable.13 The procedure was repeated if the subject moved during the scanning. Matlab 2010 (Natick, MA), reverse engineering software Imageware 13.0 (Siemens, Plano, TX) and Geomagic 2012 (Cary, NC) were used for image processing and facial MSP computation. Image processing included removing extra data, smoothing the shells, filling small holes, and registering.14
Abstracting of the Median Sagittal Plane
The process of both the ICP and PA methods for determining the MSP of three-dimensional facial data includes the following steps:
Step 1: the removal of extra facial data, such as the neck and the ear, etc.
Step 2: the mirror of the original face by the Y–Z plane.
Step 3: the superimposition of the original and mirrored face.
Step 4: the extracting of the MSP by the software from the superimposed faces.
The detailed process for PA is as following (Fig. 1): We first created 21 facial anatomic landmarks (Table 1; Fig. 2) in Imageware13.0, and the process was repeated 3 times to get the mean coordinates of every landmark. The 21 landmarks and the original image were then mirrored in the Y–Z plane, and the centroid of the original and mirrored surface models were superimposed using the translation function of the software. The centroids of the 2 images were made to coincide with the original point. Following this, we input the 21 landmark coordinates into Matlab10.0 to obtain a three-dimensional rotation matrix that guarantees the minimization of the total distance between the 21 original points and its corresponding mirrored points. The mirror image is rotated by this matrix while preserving the shape and size of each configuration. The new image, which is composed of the original image and its mirror image, is deemed as a symmetry image, the MSP for which can be automatically computed using the Geomagic studio 2012. This plane is the MSP of the original image.
FIGURE 1.
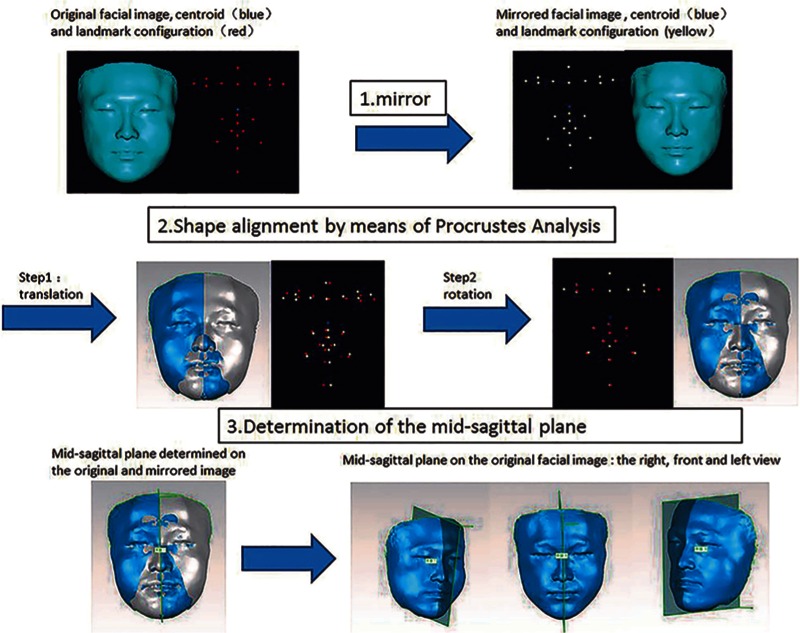
The registration of original and mirrored three-dimensional facial images by means of Procrustes analysis to derive the midsagittal plane from the three dimensional facial data. Step1: the mirror of the original facial data and landmarks along the Y–Z plane. Step2: the original and mirrored facial data were superimposed by the means of the Procrustes analysis method. Step3: the abstraction of the midsagittal plane from the superimposed facial data.
TABLE 1.
The Abbreviation and Definition of 21 Automatic Landmarks: 7 Medial Landmarks and 7 Pairs Bilateral al Landmarks (According to Farkas, 1994)
| Landmarks | Abbreviation | Definition |
| Medial Landmarks | ||
| 1 Glabella | g | The most prominent midpoint between the eyebrows |
| 2 Nasion | n | Midline point between the nasal root and naso frontal suture, above the line that connects the two inner canthi |
| 3 Pronasale | prn | The most protruded point of the apex nasi |
| 4 Subnasale | sn | The midpoint of the angle at the columella base where the lower border of the nasal septum and the surface of the upper lip meet |
| 5 Labiale superius | ls | The midpoint of the upper vermilion line |
| 6 Labiale inferius | li | The midpoint of the lower vermilion line |
| 7 Pogonion | pg | The most prominent midpoint of the chin |
| Bilateral landmarks | ||
| 8 Palpebrale superius | ps | The highest point in the midportion of the free margin of each upper eyelid |
| 9 Palpebrale inferius | pi | The lowest point in the midportion of the free margin of each lower eyelid |
| 10 Exocanthion | ex | The point at the outer commissure of the eye fissure |
| 11 Endocanthion | en | The point at the inner commissure of the eye fissure |
| 12 Alare | al | The most lateral point on each alar contour |
| 13 Crista philtri | Cph | The point on each elevated margin of the philtrum above the vermilion line |
| 14 Cheilion | ch | The point at each labial commissures |
FIGURE 2.
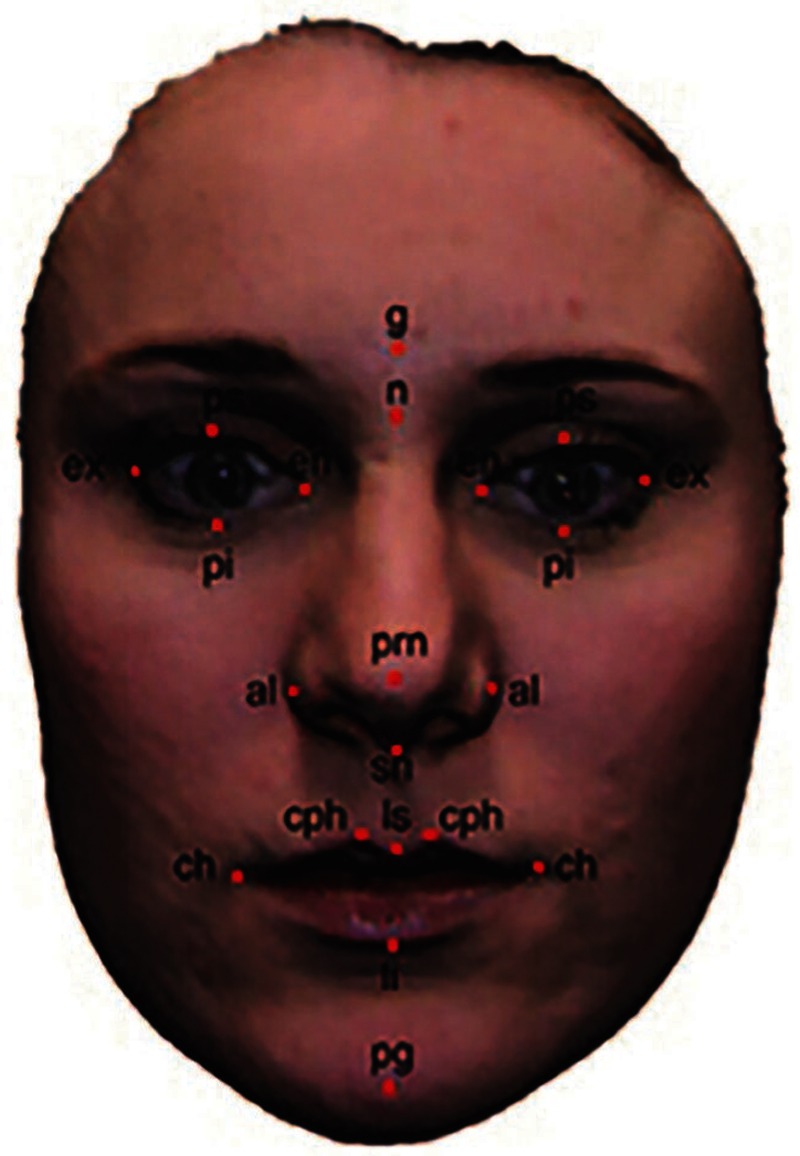
The 21 anatomic landmarks that are used in Procrustes analysis for the computation of midsagittal plane.
The ICP was developed by Benz et al15 and a description of the basic algorithm is found in the literature. The process of ICP method for extracting the MSP from the three-dimensional facial data is as following:
In the reverse engineering software Geomagic Studio 2012, the original facial data was mirrored along the Y–Z plane, while preserving the original data.
The original and mirrored facial data were first registered by 3 ordered landmarks, such as the bilateral cheilion and the nasion. Then the whole original and mirrored faces, 2000 points cloud, were registered according to the minimum distance between the closest points after times of iterative computation.
Using the function “alliance of polygon”, the registered original and mirrored faces were allied to a new symmetry data, then the symmetry plane, which can be seen as the median sagittal plane was easy to get by the software.
Calculation of Asymmetry Index
There are altogether 3 indices that can be used to evaluate the asymmetry of face.
Asymmetry Index 1
The asymmetry index 1 can be seen as a tendency toward the concentration of all landmarks to the MSP, and can be expressed as the average distance between the medial landmarks and midpoints of bilateral landmarks. For a perfectly symmetric face, the medial points and the midpoints of the bilateral points are within the MSP, and thus the AI is zero. In general, the greater symmetry in a face, lower the AI value.
Asymmetry Index 2 and Asymmetry Index 3
The surface-to-surface average distance between the PA-registered and ICP-registered original and mirrored images (ADom)16 (AI1) was measured for the whole face, and the distance between the 2 images within 0.5 mm of tolerance (Fig. 3)16 (AI2) was expressed as a percentage. We depicted these distances graphically as color maps and quantitatively through histograms. They are both indicators of the degree of facial asymmetry and were computed for every subject. The lower the ADom, higher the facial symmetry. The lower the percentage, lower the facial symmetry.
FIGURE 3.
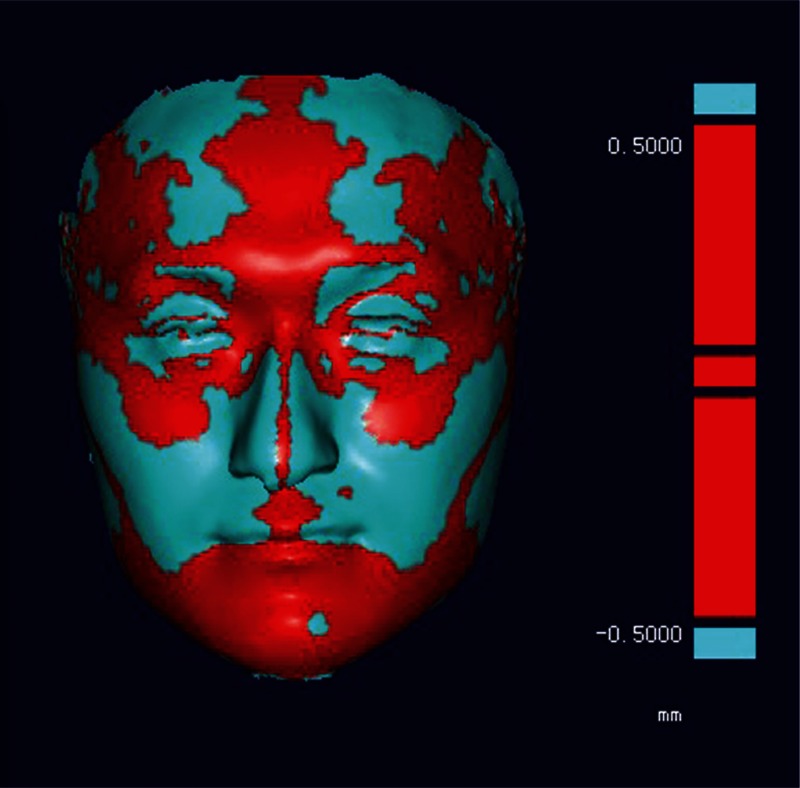
Asymmetry index 3: the distance between the 2 images within 0.5 mm of tolerance was expressed in red and as the percentage of the whole face.
RESULT
The AIs values of every subject can be seen in Table 2. Paired t-tests were used to detect the differences between the 2 planes by means of the 3 AI values. P values of less than 0.05 were considered significant. The results of the paired-t test showed that t = 0.0.060, P = 0.953 for AI1; t = −0.926, P = 0.362 for AI2; and t = 1.1172, P = 0.0.251 for AI3. All calculations were performed using a standard statistical software package (SPSS Version 17). There were no statistical differences among the AI values (P = 0.05). We can conclude that the PA can compute the three-dimensional facial data for MSP with a high agreement with the ICP.
TABLE 2.
The Result of Each Subject for the 3 Asymmetry Index by the Interactive Closest Point and Procrustes Analysis Method Respectively, and the First Column S Represents Every Subject
| AI 1 (mm) | AI 2 (mm) | AI 3 (%) | ||||
| Subjects | ICP | PA | ICP | PA | ICP | PA |
| S1 | 0.34 | 0.36 | 0.89 | 0.9 | 0.36 | 0.37 |
| S2 | 0.28 | 0.19 | 1.31 | 1.3 | 0.63 | 0.61 |
| S3 | 0.63 | 0.32 | 0.73 | 0.8 | 0.16 | 0.17 |
| S4 | 0.7 | 0.4 | 0.83 | 0.8 | 0.16 | 0.17 |
| S5 | 0.13 | 0.09 | 0.94 | 0.9 | 0.63 | 0.61 |
| S6 | 0.26 | 0.21 | 0.79 | 0.8 | 0.76 | 0.72 |
| S7 | 0.42 | 0.37 | 0.93 | 0.9 | 0.57 | 0.55 |
| S8 | 0.1 | 0.11 | 1.01 | 1.1 | 0.45 | 0.42 |
| S9 | 0.41 | 0.37 | 0.99 | 1 | 0.39 | 0.37 |
| S10 | 0.31 | 0.22 | 0.77 | 0.8 | 0.31 | 0.32 |
| S11 | 0.18 | 0.2 | 0.91 | 0.9 | 0.62 | 0.58 |
| S12 | 0.35 | 0.17 | 0.87 | 0.9 | 0.71 | 0.72 |
| S13 | 0.3 | 0.26 | 0.68 | 0.7 | 0.31 | 0.16 |
| S14 | 0.44 | 1.35 | 0.79 | 0.8 | 0.39 | 0.44 |
| S15 | 0.69 | 0.86 | 0.97 | 0.9 | 0.09 | 0.11 |
| S16 | 1.37 | 1.29 | 1.25 | 1.2 | 0.31 | 0.29 |
| S17 | 0.6 | 0.64 | 0.82 | 0.8 | 0.66 | 0.61 |
| S18 | 0.31 | 0.2 | 1.08 | 1 | 0.4 | 0.41 |
| S19 | 0.38 | 0.52 | 1.12 | 1.1 | 0.32 | 0.3 |
| S20 | 0.42 | 0.39 | 0.74 | 0.7 | 0.42 | 0.44 |
| S21 | 0.29 | 0.28 | 0.63 | 0.6 | 0.64 | 0.61 |
| S22 | 0.55 | 0.5 | 0.87 | 0.9 | 0.41 | 0.44 |
| S23 | 0.38 | 0.42 | 0.71 | 0.8 | 0.39 | 0.36 |
| S24 | 0.47 | 0.34 | 0.47 | 0.8 | 0.3 | 0.31 |
| S25 | 0.53 | 0.53 | 0.8 | 0.7 | 0.51 | 0.46 |
| S26 | 0.57 | 0.41 | 0.89 | 0.9 | 0.28 | 0.29 |
| S27 | 0.38 | 0.29 | 0.7 | 0.8 | 0.58 | 0.6 |
| S28 | 0.39 | 0.36 | 0.81 | 0.9 | 0.22 | 0.21 |
| S29 | 0.53 | 0.69 | 0.89 | 0.85 | 0.41 | 0.5 |
| S30 | 0.41 | 0.71 | 0.69 | 0.73 | 0.41 | 0.39 |
| Mean | 0.44 | 0.44 | 0.86 | 0.88 | 0.43 | 0.42 |
AI, asymmetry index; ICP, Interactive Closest Point; PA, Procrustes analysis
DISCUSSION
Facial asymmetry is so common a phenomenon in population. There is no need at all to treat for these with only slight asymmetry that may be seen as something personalized. But for these people who have severe asymmetry, facial symmetry has always been the goal of patients and surgeons for decades. There are so many factors which may bring about facial asymmetry, such as previous craniofacial trauma, unilateral chewing habits, temporomandibular joint dysfunction syndrome, tumor, and congenital defect. Whatever the reason for facial asymmetry, it's determining the medial sagittal plane for the asymmetry face that is always a first step before surgery.
The midline or midsagittal plane of a face had always been constructed using 3 or 3 automatic medial landmarks into a straight line or plane. Although it is easy to implement, minor error in the selection of landmarks may lead to major deflection of the final midline or midsagittal plane. At the same time, this method is invalid when there is the missing of some key landmarks.
Theoretically, a face is perfectly symmetric if it is identical to its mirror image. But there is no perfect symmetry face in the world. So the original and mirrored images may not be the same, and the more asymmetry in the original face, more are the differences between the original and mirrored images. The mirror-image method is not novel for facial asymmetry analysis. It has already been applied in two-dimensions by Zaidel and Cohen17 years ago, they composited photographs consisting of left–left and right–right facial halves, so that they can investigate the effects of asymmetry on human faces. To further improve diagnosis of facial symmetry, it is important to analysis faces objectively in 3 dimensions. Progress of science and technology such as laser scanning enable us to percept facial asymmetry in three-dimensional level.
The iterative closest points (ICP) algorithm had become the mainstream for facial asymmetry analysis in three-dimensional level. It calculates the distance between the closet point of the original and mirrored data. After many times of iterative computation, a minimum distance between the closet point of the original and mirrored data were acquired. And the superimposition of the original and mirror image were based on this situation. Instead of using so many points in the face, the PA chose some points selectively in the regions with no visible asymmetry. It calculated the minimum distance between the corresponding 2 sets of points. As for the location and number of the landmarks that can be used for the PA computing, it is very flexible. If the patient has a left chin or a hollow eye, we can just not select landmarks in the regions mentioned above.
These 2 methods are based on the superimposition of the original and mirror data, and the difference lies in the algorithm while superimposing. First, the point cloud representing the face all participate in the calculation of MSP of the face for the ICP algorithm, whereas there are only a limited number of landmarks (21) that are used to calculate the MSP of the face for the PA. Second, although both PA and ICP are both based on the least squares principle, points of the original and mirrored face in ICP algorithm are unordered and involved in the operations in accordance with the principle of nearby, whereas the points of the original and mirrored face is a one-to-one relationship in the PA. Third, for the process of PA, a centroid is calculated based on the landmarks and the centroids of the original and mirrored face are both superimposed in the original point, while it is not necessary in the ICP algorithm.
Although for subjects with no obvious facial asymmetry the PA and ICP method can both compute the midsagittal plane from the three-dimensional facial data and the 2 midsagittal planes derived from the 2 methods shows no significant statistical difference. But for the subjects with obvious facial asymmetry, for the PA method, we can select landmarks in the relatively symmetric region, thus avoiding the unwanted landmarks that are out of the position for the calculation of the MSP. Whereas for the ICP method, the point clouds all participate in the calculation of the MSP evenly, without wiping off the point clouds in the asymmetry region. And these point clouds may lead to the inaccuracy of the median sagittal plane. So whether the ICP will be available for the asymmetric subjects remains a problem for further study. And the number and location of landmarks that can be seen as the most appropriate for MSP computing by PA method also remains to be studied.
CONCLUSIONS
We can safely come to the conclusion from the statistical analysis result of Table 2 that for the 30 subjects with no obvious facial asymmetry: the PA method and ICP method can both compute the midsagittal plane from the three-dimensional facial data and the 2 midsagittal planes derived from the 2 methods shows no significant statistical difference. But for the subjects with obvious facial asymmetry, whether the PA and ICP method will compute the ideal midsagittal plane remains a question.
Footnotes
Financial assistance for this research was provided by Scientific Research Innovation Foundation for Youth Doctors of Peking University School of Stomatology (YS020212), The National High Technology Research and Development Program (“863” Program) of China (30313032302), and The National Natural Science Foundation of China (303075920).
The authors report no conflicts of interest.
REFERENCES
- 1.Peck S, Peck L, Kataja M. Skeletal asymmetry in esthetically pleasing faces. Angle Orthod 1991; 61:43–48. [DOI] [PubMed] [Google Scholar]
- 2.Ferrario VF, Sforza C, Serrao G, et al. A three-dimensional evaluation of human facial asymmetry. J Anat 1995; 186:103–110. [PMC free article] [PubMed] [Google Scholar]
- 3.Ferrario VF, Sforza C, Poggio CE. Distance from symmetry: a three-dimensional evaluation of facial asymmetry. J Oral Maxillofac Surg 1994; 1126–1132. [DOI] [PubMed] [Google Scholar]
- 4.Hartmann J, Meyer-Marcotty P, Benz M, et al. Reliability of a method for computing facial symmetry plane and degree of asymmetry based on 3D-data. J Orofac Orthop 2007; 68:477–490. [DOI] [PubMed] [Google Scholar]
- 5.Stauber I, Vairaktaris E, Holst A, et al. Three-dimensional analysis of facial symmetry in cleft lip and palate patients using optical surface data. J Orofac Orthop 2008; 69:268–282. [DOI] [PubMed] [Google Scholar]
- 6.Kambylafkas P, Murdock EE, Kyrkanides S, et al. Validity of panoramic radiographs for measuring mandibular asymmetry. Angle Orthod 2006; 76:388–393. [DOI] [PubMed] [Google Scholar]
- 7.Farkas LGC. Facial asymmetry in healthy North American Caucasians. An anthropometrical study. Angle Orthod 1981; 51:70–77. [DOI] [PubMed] [Google Scholar]
- 8.Ercan I, Ozdemir ST, Abdullah E, et al. Facial asymmetry in young healthy subjects evaluated by statistical shape analysis. J Anat 2008; 213:663–669. [DOI] [PMC free article] [PubMed] [Google Scholar]
- 9.Besl PJM. A method for registration of 3-D shapes. IEEE Trans Pattern Anal Mach Intell 1992; 14:239–256. [Google Scholar]
- 10.Goodall C. Procrutes methods in the statistical analysis of shape. J Roy Stat Soc Series B (Methodological) 1991; 53:285–339. [Google Scholar]
- 11.Damstra J, Fourie Z, Wit MD, et al. A three-dimensional comparison of a morphometric and conventional cephalometric midsagittal planes for craniofacial asymmetry. Clin Oral Investig 2012; 16:285–294. [DOI] [PMC free article] [PubMed] [Google Scholar]
- 12.Gruber M, Häusler G. Simple, robust and accurate phase-measuring triangulation. Optik 1992; 118–122. [Google Scholar]
- 13.Kau CH, Zhurov AI, Knox J, et al. Reliability of measuring facial morphology with a 3-dimensional laser scanning system. Am J Orthod Dentofacial Orthop 2005; 128:424–430. [DOI] [PubMed] [Google Scholar]
- 14.Middleton J, Shrive MG, Jones ML. Computer methods for measuring 3D facial morphology [J]. Proceedings of CMBBE2004. Antibes, France: First Numerics Ltd; 2005. [Google Scholar]
- 15.Benz M. The Symmetry of Faces. 2002; Amsterdam, The Netherlands: IOS Press, 332-9. [Google Scholar]
- 16.Djordjevic J, et al. Three-dimensional quantification of facial symmetry in adolescents using laser surface scanning. Eur J Orthod 2011; 125–132. [DOI] [PMC free article] [PubMed] [Google Scholar]
- 17.Zaidel DW, Cohen JA. The face, beauty, and symmetry: perceiving asymmetry in beautiful faces. Int J Neurosci 2005; 115:1165–1173. [DOI] [PubMed] [Google Scholar]