

Summary
Background
To assess semiquantitative parameters of dynamic contrast-enhanced perfusion MR imaging (DCE) in differentiation of subtypes of renal cell carcinoma (RCC).
Material/Methods
Prospective study conducted upon 34 patients (27 M, 7 F, aged 25–72 ys: mean 45 ys) with RCC. Abdominal dynamic contrast-enhanced gradient-recalled echo MR sequence after administration of gadopentetate dimeglumine was obtained. The time signal intensity curve (TIC) of the lesion was created with calculation of enhancement ratio (ER), and washout ratio (WR).
Results
The subtypes of RCC were as follows: clear cell carcinomas (n=23), papillary carcinomas (n=6), and chromophobe carcinomas (n=5). The mean ER of clear cell, papillary and chromophobe RCC were 188±49.7, 35±8.9, and 120±41.6 respectively. The mean WR of clear cell, papillary and chromophobe RCCs were 28.6±6.8, 47.6±5.7 and 42.7±10, respectively. There was a significant difference in ER (P=0.001) and WR (P=0.001) between clear cell RCC and other subtypes of RCC. The threshold values of ER and WR used for differentiating clear cell RCC from other subtypes of RCC were 142 and 38 with areas under the curve of 0.937 and 0.895, respectively.
Conclusions
We concluded that ER and WR are semiquantitative perfusion parameters useful in differentiation of clear cell RCC from chromophobe and papillary RCCs.
MeSH Keywords: Carcinoma, Renal Cell; Cell Differentiation; Magnetic Resonance Imaging
Background
Renal cell carcinoma (RCC) accounts for about 3% of all adult cancers and 85% to 90% of all renal malignancies. RCC most often occurs in patients aged 50–70 years. Approximately 20–30% of patients with RCC have a metastatic disease at presentation and nearly 50% of patients with an advanced disease die within 5 years of diagnosis. Global incidence of RCC continues to grow steadily with the increase in incidentally discovered lesions during imaging studies [1–4]. The 2004 World Health Organization (WHO) taxonomic schemata recognizes that RCC is a clinicopathologically heterogeneous malignant tumor that can be classified into clear cell, papillary, chromophobe, collecting duct, medullary carcinoma, and unclassified categories [5]. The subtypes of RCC differ in their histopathological features, genetic expression pattern, and clinical behavior. The clear cell, papillary, and chromophobe tumors account for 65–70%, 15–20%, and 6–11% of RCCs, respectively [6,7].
Dynamic contrast-enhanced CT scan has promising results in differentiation, but, it is associated with radiation exposure and contrast medium injection [8–10]. Metabolic imaging with positron emission tomography (PET)-CT has been used in subtyping of RCC but it is less available, expensive and has low-spatial resolution [1–3]. Routine T1- and T2-weighted imaging [11], chemical shift imaging [12] and diffusion-weighted MR imaging [4,13,14] have been used for characterization of subtypes of RCC but their values are overlapping. Percutaneous biopsy of renal masses can provide a preoperative pathological diagnosis. However, biopsy is associated with procedural complications and the potential for sampling error or inaccurate tumor subtyping [2,3].
Dynamic contrast-enhanced perfusion MR imaging (DCE) has been used for characterization of tumors at different regions of the body such as salivary glands [15,16], and breast [17] as well as in the assessment of different renal diseases [18]. Also, it has been used for characterization of renal masses [19–22] and subtypes of RCC [4,23–25] based upon morphological appearance of the curve and calculation of signal intensity. There is an overlap in the morphological assessment of time signal intensity curve (TIC) character of subtypes of RCC. The TICs contain valuable diagnostic information. Kinematic assessment of TIC with calculation of semiquantitative parameters has been applied for characterization of parotid and other tumors [15,16]. Analysis of semiquantitative parameters of TIC may further improve the accuracy of imaging-based classification of RCC subtypes.
Purpose
To evaluate semiquantitative parameters of DCE in differentiation of subtypes of RCC.
Material and Methods
Prospective study was carried out on 40 consecutive patients with a renal mass suspected to be RCC. The inclusion criterion was solid renal masses based upon US or CT scan suggested to be RCC. We excluded 6 cases proved to be benign masses. We finally included in this study 34 patients (27 male and 7 female with age range from 25 to 72 years; mean age was 45 years) with RCC. The patients presented with hematuria (n=25), loin pain (n=15) and flank swelling (n=10). We obtained institutional review board approval and informed consent from the patients before the study.
MR imaging was performed using a 1.5-T MR scanner (Signa horizon-LX echo speed - General Electric medical systems) with a phased-array surface coil. Axial, sagittal and coronal localizers were performed. Then the following sequences were applied: axial TI-weighted images (TR/TE: 600/14 ms, field of view: 38–42 cm, slice thickness: 5–7 mm, intersectional gap: 1–2 mm, matrix: 192×256), axial and coronal FSE (TR/TE: 5000–7000/85 ms, field of view: 38–42 cm, slice thickness: 5–7 mm, intersectional gap: 1–2 mm and matrix: 192×256).
Sequential spoiled gradient-echo images were obtained before and after intravenous administration of gadolinium dimeglumine (Magnevist; Bayer HealthCare Pharmaceuticals, Wayne, NJ, USA) in a dose of 0.1 mmol/kg body weight. The contrast medium was injected by an automatic injector at a rate of 3 mL/s and followed by a 10–20-mL saline flush injected at 1 mL/sec. Post-contrast serial breath-hold acquisitions were obtained by considering the start of the bolus injection to be the zero point. The imaging was performed at 30, 60, 90, 120, 150, 180, and 210 seconds. Imaging was performed with the following parameters: TR/TE=60/1.3 ms, flip angle=60, field of view=38–42 cm, slice thickness=10 mm, intersectional gap=2 mm and matrix=134×256. Post-contrast axial FSE T1 WI with fat suppression with the following parameters: TR/TE: 750/15 ms, field of view: 42 cm, slice thickness: 5 mm, intersectional gap: 2 mm, matrix: 160/256. The serial acquisitions were transferred to the workstation. The serial acquisitions were merged together at a workstation to obtain one reconstructed image.
MR image analysis was done by 2 uroradiologists (EA, NN) not aware of the clinical findings or histopathological results. A region of interest (ROI) was defined by both observers in consensus within the margin of the tumor at a reconstructed image (Figure 1). When the tumor had a heterogeneous pattern, ROI was placed around the solid enhanced part of the tumor with avoidance of the cystic part. From ROI, the time-signal intensity curve (TIC) was automatically constructed.
Figure 1.
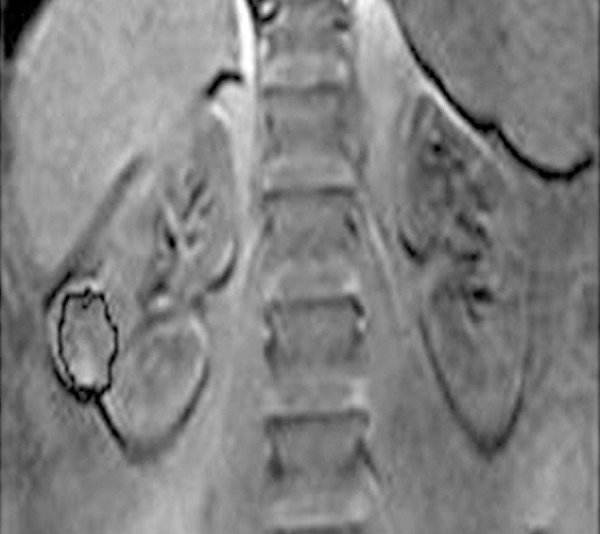
Region of interest localization: Coronal contrast T1-weighted reconstructed image shows region of interest of the right RCC.
The semiquantitative parameters derived from TICs were the enhancement ratio (ER) and washout ratio (WR). The enhancement ratio (ER) was defined as (SImax–SIpre)/SIpre, while the washout ratio (WR) was defined as [(SImax–SIend)/(SImax–SIpre)] ×100, where SIpre was precontrast signal intensity, SImax was signal intensity at maximal contrast enhancement and SIend was SI at end of the study after 5 minutes of contrast material administration [16] (Figure 2).
Figure 2.
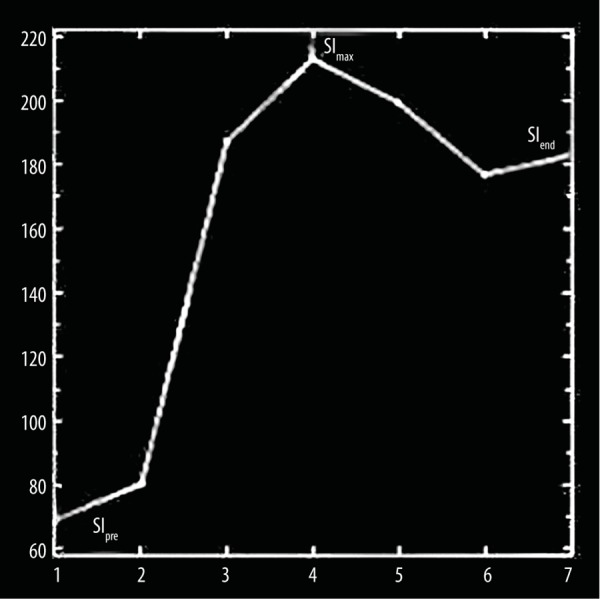
Parameters of time signal intensity curve (TIC): Enhancement ratio (ER)=(SImax–SIpre)/SIpre and washout ratio (WR)=(SImax–SIend)/(SImax–SIpre) ×100 where SIpre was precontrast signal intensity, SImax was signal intensity at maximal contrast enhancement and SIend was SI after 210 seconds of contrast material administration.
Histopathological diagnosis was obtained from radical nephrectomy (n=25), partial nephrectomy (n=9), and percutaneous CT-guided tissue biopsy (n=6). Surgery or biopsy was performed 2–7 days after MR examination. The histopathological subtypes of RCC were recognized according to 2004 WHO classification [5].
The statistical analysis of data was done by using Statistical Package for Social Science version 16.0 (SPSS Inc., Chicago, IL, USA). First, the data were presented in the form of mean ±SD. The second part was to test the statistically significant difference. One-way ANOVA test was used to compare more than 2 groups and Student’s t-test to compare between two groups. A P value was significant if ≤0.05 at confidence interval of 95%. The receiver operating characteristic (ROC) curve was drawn to determine the cut-off value of perfusion parameters used for differentiating clear cell RCC from other subtypes with calculation of sensitivity, specificity, accuracy and area under the curve (AUC).
Results
The final pathological subtypes of RCC were clear cell carcinomas (n=23) (Figure 3), papillary carcinomas (n=6), and chromophobe carcinomas (n=5). The mean and standard deviation of ER and WR for subtypes of RCC are illustrated in Table 1. The cut-off of ER and WR used to differentiate clear cell RCC from other subtypes with calculation of sensitivity, specificity, accuracy and AUC.
Figure 3.

Clear cell RCC. (A) Reconstructed fat suppressed contrast-enhanced T1-weighted image shows heterogeneously enhancing mass involving the lower pole of the right kidney. Note there is a non-enhancing cyst in the middle part of the left kidney. (B) The TIC shows ER of clear cell RCC to be 212 and WR 24.2.
Table 1.
Parameters of time intensity curve of the clear cell, papillary and chromophobe subtypes of renal cell carcinoma.
| Tumors | ER | WR |
|---|---|---|
| Clear cell RCC (n=23) | 188±49.7 | 28.6±6.8 |
| Papillary RCC (n=6) | 35±8.9 | 47.6±5.7 |
| Chromophobe RCC (n=5) | 120±41.6 | 42.7±9.9 |
The mean ER of clear cell, papillary and chromophobe RCC were 188±49.7, 35±8.9 and 120±41.6, respectively. There was significant difference in ER between clear cell RCC and other subtypes (papillary and chromophobe RCC) (P=0.001) and a significant difference in ER between papillary and chromophobe RCC (P=0.001). The selection of 142 as a threshold value of ER was used for differentiating clear cell RCC from other subtypes of RCC revealed sensitivity of 93%, specificity of 93%, accuracy of 94%, and AUC of 0.937 (Figure 4A).
Figure 4.

Receiver operating characteristic (ROC) curve of ER and WR parameters of TIC. (A) The threshold value of ER used for differentiating clear cell carcinoma from other subtypes of RCC was 142; it showed accuracy of 94% and AUC of 0.937. (B) The threshold of WR used for differentiating clear cell carcinomas from other subtypes of RCC was 38 and had accuracy of 99% and AUC of 0.895.
The mean WR of clear cell RCC was 28.6±6.8 and of papillary and chromophobe subtypes of RCC 47.6±5.7 and 42.7±10, respectively. There was a significant difference in WR between clear cell RCC and other subtypes of RCC (P=0.001). The selection of 38 as a threshold of WR for differentiating clear cell carcinomas from other subtypes of RCC revealed sensitivity of 90%, specificity of 90%, accuracy of 99% and AUC of 0.895 (Figure 4B).
Discussion
Pretreatment determination of subtypes of RCC is particularly important for patients who are either poor surgical candidates or who have a metastatic disease, although knowledge of the tumor subtype may also be helpful for surgical planning in patients who are surgical candidates. Clear cell RCC, which accounts for about 65–70% of all RCCs, has generally worse outcomes than other RCC types in part because of its high metastatic potential [1–3]. Differentiation of these subtypes is a well-known challenge for imaging modalities. This obstacle may be overcome when taking different enhancement patterns of RCC subtypes into account, as reported by contrast-enhanced CT [8,9] and MR imaging studies [23,24]. These investigations report a hyper-enhancement of clear cell RCCs whereas papillary or chromophobe RCCs provide lower enhancement patterns. Differentiation of papillary from chromophobe RCCs seems more problematic where papillary RCCs provide higher enhancement than chromophobe RCCs as reported by some researches [10], whereas others [24] report the contrary.
In this study, the clear cell RCC showed the highest ER (188%) followed by chromophobe RCC which showed a moderate ER (120%) while papillary RCCs demonstrated the lowest ER (35%). One study reported mean percentage signal intensity change of clear cell, papillary, and chromophobe RCCs of 205.6%, 32.1%, and 109.9%, respectively (clear cell versus papillary RCCs, P=0.0001; papillary versus chromophobe RCCs, P=0.02; clear cell versus chromophobe RCCs, P=0.01) [24]. Another study added that those papillary RCCs provide higher enhancement than chromophobe RCCs [10]. Another study added significant differences between papillary RCCs and other renal tumors at arterial wash-in (P≤0.001) and initial wash-out (P=0.006) [4].
The WR reflects the cellularity-stromal grade. The WR depends on the difference in the amount of contrast material between intravascular and extravascular phases within the tumor. A large extracellular space with fibrous stroma reportedly retains contrast material for a certain period. Therefore, tumors with a high cellularity-stromal grade will retain less contrast material and have a high WR, whereas those with a low cellularity-stromal grade will have a low WR [16]. In the present study, clear cell RCCs had a low WR compared to the other subtypes.
Non-contrast arterial spin labeling MR imaging enables subtyping of RCC on the basis of their perfusion level. Papillary RCCs exhibit lower perfusion levels than other RCC subtypes. The mean and peak perfusion levels of papillary RCC (27.0 mL/min/100 g ±15.1 and 78.2 mL/min/100 g ±39.7, P=0.001 for both) and chromophobe RCC (152.9 mL/min/100 g ±80.7 and 260.9 mL/min/100 g ±61.9; P=0.001 and P=0.02, respectively) [26].
In this study, we used dynamic contrast-enhanced MR imaging for characterization of subtypes of RCC. Application of non-contrast arterial spin labeling [26] or dynamic susceptibility contrast-enhanced MR imaging [27,28] may improve the results. Arterial spin labeling is not associated with contrast effect. Non-contrast perfusion MR techniques may be preferable due to the risk of nephrogenic systemic fibrosis associated with gadolinium-based contrast agents in patients with renal insufficiency [26].
There are a few limitations of this study. First, there is a small number of chromophobe and papillary RCCs compared to clear cell RCCs. Multicenter studies upon large number of patients may improve the results. Second, there was no subtyping of papillary cell RCCs due to the small number of patients. Third, we applied semiquantitative parameters for subtyping of RCCs. Further studies with multiparametric imaging and quantitative analysis using pharmacokinetic models to produce physiological quantitative perfusion parameters such as blood flow, blood volume and endothelial permeability coefficient and histogram analysis of whole-lesion enhancement are recommended [29–32].
Conclusions
We concluded that ER and WR are semiquantitative perfusion parameters helpful in differentiation of clear cell RCC from chromophobe and papillary RCCs.
Footnotes
Conflict of interest
The authors declare that they have no conflict of interest.
References
- 1.Campbell N, Rosenkrantz A, Pedrosa I. MRI phenotype in renal cancer is it clinically relevant? Top Magn Reson Imaging. 2014;23:95–115. doi: 10.1097/RMR.0000000000000019. [DOI] [PMC free article] [PubMed] [Google Scholar]
- 2.Chapin B, Delacroix S, Jr, Wood C. Renal cell carcinoma: What the surgeon and treating physician need to know. Am J Roentgenol. 2011;196:1255–62. doi: 10.2214/AJR.10.6249. [DOI] [PubMed] [Google Scholar]
- 3.Krajewski KM, Giardino AA, Zukotynski K, et al. Imaging in renal cell carcinoma. Hematol Oncol Clin North Am. 2011;25:687–715. doi: 10.1016/j.hoc.2011.04.005. [DOI] [PubMed] [Google Scholar]
- 4.Cornelis F, Tricaud E, Lasserre A, et al. Routinely performed multiparametric magnetic resonance imaging helps to differentiate common subtypes of renal tumours. Eur Radiol. 2014;24:1068–80. doi: 10.1007/s00330-014-3107-z. [DOI] [PubMed] [Google Scholar]
- 5.Eble J, Sauter G, Epstein JI, Sesterhenn IA, editors. Tumors of the genitourinary and male genital organs. Lyon: France IARC Press; 2004. WHO classification of tumors; p. 10. [Google Scholar]
- 6.Compérat E, Camparo P. Histological classification of malignant renal tumours at a time of major diagnostic and therapeutic changes. Diagn Interv Imaging. 2012;93:221–31. doi: 10.1016/j.diii.2012.01.015. [DOI] [PubMed] [Google Scholar]
- 7.Prasad S, Humphrey P, Catena J, et al. Common and uncommon histologic subtypes of renal cell carcinoma: Imaging spectrum with pathologic correlation. Radiographics. 2006;26:1795–810. doi: 10.1148/rg.266065010. [DOI] [PubMed] [Google Scholar]
- 8.Young JR, Margolis D, Sauk S, et al. Clear cell renal cell carcinoma: discrimination from other renal cell carcinoma subtypes and oncocytoma at multiphasic multidetector CT. Radiology. 2013;267:444–53. doi: 10.1148/radiol.13112617. [DOI] [PubMed] [Google Scholar]
- 9.Shebel H, Elsayes K, Sheir K, et al. Quantitative enhancement washout analysis of solid cortical renal masses using multidetector computed tomography. J Comput Assist Tomogr. 2011;35:337–42. doi: 10.1097/RCT.0b013e318219f92b. [DOI] [PubMed] [Google Scholar]
- 10.Zokalj I, Marotti M, Kolarić B. Pretreatment differentiation of renal cell carcinoma subtypes by CT: The influence of different tumor enhancement measurement approaches. Int Urol Nephrol. 2014;46:1089–100. doi: 10.1007/s11255-013-0631-8. [DOI] [PubMed] [Google Scholar]
- 11.Oliva M, Glickman J, Zou K, et al. Renal cell carcinoma: T1 and T2 Signal Intensity Characteristics Of Papillary And Clear Cell Types Correlated With Pathology. Am J Roentgenol. 2009;192:1524–30. doi: 10.2214/AJR.08.1727. [DOI] [PubMed] [Google Scholar]
- 12.Karlo C, Donati O, Burger I, et al. MR imaging of renal cortical tumours: qualitative and quantitative chemical shift imaging parameters. Eur Radiol. 2013;23:1738–44. doi: 10.1007/s00330-012-2758-x. [DOI] [PubMed] [Google Scholar]
- 13.Mytsyk Y, Borys Y, Komnatska I, et al. Value of the diffusion-weighted MRI in the differential diagnostics of malignant and benign kidney neoplasms – our clinical experience. Pol J Radiol. 2014;79:290–95. doi: 10.12659/PJR.890604. [DOI] [PMC free article] [PubMed] [Google Scholar]
- 14.Abdel Razek AA, Farouk A, Mousa A, Nabil N. Role of diffusion weighted MR imaging in characterization of renal tumors. J Comput Assist Tomogr. 2011;35:332–36. doi: 10.1097/RCT.0b013e318219fe76. [DOI] [PubMed] [Google Scholar]
- 15.Furukawa M, Parvathaneni U, Maravilla K, et al. Dynamic contrast-enhanced MR perfusion imaging of head and neck tumors at 3 Tesla. Head Neck. 2013;35:923–29. doi: 10.1002/hed.23051. [DOI] [PubMed] [Google Scholar]
- 16.Yabuuchi H, Fukuya T, Tajima T, et al. Salivary gland tumors: Diagnostic value of gadolinium-enhanced dynamic MR imaging with histopathologic correlation. Radiology. 2003;226:345–54. doi: 10.1148/radiol.2262011486. [DOI] [PubMed] [Google Scholar]
- 17.Schmitz AC, Peters NH, Veldhuis WB, et al. Contrast-enhanced 3.0-T breast MRI for characterization of breast lesions: increased specificity by using vascular maps. Eur Radiol. 2008;18:355–64. doi: 10.1007/s00330-007-0766-z. [DOI] [PubMed] [Google Scholar]
- 18.Notohamiprodjo M, Reiser M, Sourbron S. Diffusion and perfusion of the kidney. Eur J Radiol. 2010;76:337–47. doi: 10.1016/j.ejrad.2010.05.033. [DOI] [PubMed] [Google Scholar]
- 19.Attenberger UI, Sourbron SP, Schoenberg SO, et al. Comprehensive MR evaluation of renal disease: Added clinical value of quantified renal perfusion values over single MR angiography. J Magn Reson Imaging. 2010;31:125–33. doi: 10.1002/jmri.21994. [DOI] [PubMed] [Google Scholar]
- 20.Ho VB, Allen SF, Hood MN, Choyke PL. Renal masses: Quantitative assessment of enhancement with dynamic MR imaging. Radiology. 2002;224:695–700. doi: 10.1148/radiol.2243011048. [DOI] [PubMed] [Google Scholar]
- 21.Hecht EM, Israel GM, Krinsky GA, et al. Renal masses: quantitative analysis of enhancement with signal intensity measurements versus qualitative analysis of enhancement with image subtraction for diagnosing malignancy at MR imaging. Radiology. 2004;232:373–78. doi: 10.1148/radiol.2322031209. [DOI] [PubMed] [Google Scholar]
- 22.Palmowski M, Schifferdecker I, Zwickd S, et al. Tumor perfusion assessed by dynamic contrast-enhanced MRI correlates to the grading of renal cell carcinoma: Initial results. Eur J Radiol. 2010;74:e176–80. doi: 10.1016/j.ejrad.2009.05.042. [DOI] [PubMed] [Google Scholar]
- 23.Vargas HA, Chaim J, Lefkowitz RA, et al. Renal cortical tumors: use of multiphasic contrast-enhanced MR imaging to differentiate benign and malignant histologic subtypes. Radiology. 2012;264:779–88. doi: 10.1148/radiol.12110746. [DOI] [PMC free article] [PubMed] [Google Scholar]
- 24.Sun MR, Ngo L, Genega EM, et al. Renal cell carcinoma: Dynamic contrast-enhanced MR imaging for differentiation of tumor subtypes – correlation with pathologic findings. Radiology. 2009;250:793–802. doi: 10.1148/radiol.2503080995. [DOI] [PubMed] [Google Scholar]
- 25.Palmowski M, Schifferdecker I, Zwickd S, et al. Tumor perfusion assessed by dynamic contrast-enhanced MRI correlates to the grading of renal cell carcinoma: Initial results. Eur J Radiol. 2010;74:e176–80. doi: 10.1016/j.ejrad.2009.05.042. [DOI] [PubMed] [Google Scholar]
- 26.Lanzman RS, Robson PM, Sun MR, et al. Arterial spin-labeling MR imaging of renal masses: Correlation with histopathologic findings. Radiology. 2012;265:799–808. doi: 10.1148/radiol.12112260. [DOI] [PMC free article] [PubMed] [Google Scholar]
- 27.Abdel Razek AA, Elsorogy L, Soliman N, Nada N. Dynamic susceptibility contrast perfusion MR imaging in distinguishing malignant from benign head and neck tumors: A pilot study. Eur J Radiol. 2011;77:73–79. doi: 10.1016/j.ejrad.2009.07.022. [DOI] [PubMed] [Google Scholar]
- 28.Abdel Razek AA, Gaballa G. Role of perfusion MR imaging in cervical lymphadenopathy. J Comput Assist Tomogr. 2011;35:21–25. doi: 10.1097/RCT.0b013e3181ff9143. [DOI] [PubMed] [Google Scholar]
- 29.Sourbron S. Technical aspects of MR perfusion. Eur J Radiol. 2010;76:304–13. doi: 10.1016/j.ejrad.2010.02.017. [DOI] [PubMed] [Google Scholar]
- 30.Notohamiprodjo M, Sourbron S, Staehler M, et al. Measuring perfusion and permeability in renal cell carcinoma with dynamic contrast-enhanced MRI: A pilot study. J Magn Reson Imaging. 2010;31:490–501. doi: 10.1002/jmri.22028. [DOI] [PubMed] [Google Scholar]
- 31.Chandarana H, Rosenkrantz A, Mussi T, et al. Histogram analysis of whole-lesion enhancement in differentiating clear cell from papillary subtype of renal cell cancer. Radiology. 2012;265:790–800. doi: 10.1148/radiol.12111281. [DOI] [PubMed] [Google Scholar]
- 32.Ramamurthy NK, Moosavi B, McInnes MD, et al. Multiparametric MRI of solid renal masses: pearls and pitfalls. Clin Radiol. 2015;70:304–16. doi: 10.1016/j.crad.2014.10.006. [DOI] [PubMed] [Google Scholar]