Supplemental Digital Content is available in the text
Abstract
Clinical significance of diametrically polarized tumor-associated macrophages in gastric cancer has been elucidated in our previous study, whereas the role of cytokines that orchestrate tumor-associated macrophages polarization in gastric cancer remains elusive. The study aims to evaluate the prognostic value of colony-stimulating factor-1 expression in patients with gastric cancer.
We examined the colony-stimulating factor-1 expression in tumor tissues by immunohistochemical staining in retrospectively enrolled 365 patients with gastric cancer undergoing gastrectomy at Zhongshan Hospital during 2008. Kaplan–Meier analysis and Cox regression models were used to evaluate the prognostic value of colony-stimulating factor-1 expression and its association with clinicopathological factors. A predictive nomogram by integrating colony-stimulating factor-1 expression with the TNM staging system was generated for overall survival evaluation of the patients.
High colony-stimulating factor-1 expression predicted an unfavorable outcome in gastric cancer. The colony-stimulating factor-1 expression in tumor tissue could give a further discrimination for the prognosis of gastric cancer patients. Cox multivariate analysis identified the colony-stimulating factor-1 expression as an independent prognostic factor. The generated nomogram performed well in predicting the 3- and 5-year overall survival of gastric cancer patients.
The colony-stimulating factor-1 is a potential independent adverse prognosticator for gastric cancer patients, which could be integrated with the tumor-associated macrophages staging system to improve the predictive accuracy for overall survival, especially in advanced tumors.
INTRODUCTION
Gastric cancer remains to be the fourth most common malignancy and responsible for the third leading cause of cancer-related death worldwide, despite its steadily decreasing incidence and mortality since 1930s.1,2 Currently, the widely used UICC/AJCC TNM staging system is mainly based on the histopathological score,3 with the underlying molecular and cellular processes during carcinogenesis of gastric cancer being ignored. As those patients with the same TNM stage could have divergent clinical outcomes, illumination of the involved molecules and the underlying mechanisms in the development and progression of the disease might give a further risk stratification for the patients and provide the guidance for a more precise treatment.
Many studies have unraveled the crucial role of immune cells in the tumor microenvironment during carcinogenesis of tumors.4,5 As the most abundant cells infiltrated in tumor microenvironment, macrophages have entered the sight for its protumoral role in facilitating neoangiogenesis in the primary tumor and promoting metastasis,6–9 including gastric cancer.10,11 Recent studies revealed that the macrophages involved in the pathogen response appeared to come from circulating monocytes, as well as the ones associated with tumors.12 Colony-stimulating factor-1 (CSF-1), also called macrophage colony-stimulating factor (M-CSF), is the essential orchestrator of monocyte infiltration and macrophage polarization during infection and carcinogenesis.13 Previous study proved the recruitment of macrophages by CSF-1 in the mouse model of breast cancer.14 Furthermore, many studies reported that CSF-1 was involved in the M2-polarization of macrophage, which usually favors neovascularization and tumor progression.15 High CSF-1 expression was associated with a poor survival in several tumors, including endometrial carcinoma,16 leiomyosarcoma,17 clear cell renal cell carcinoma, 18 and breast cancer.19 However, the clinical significance of the expression of CSF-1 and its prognostic value in gastric cancer remain obscure.
Our previous work has identified the prognostic role of diametrically polarized tumor-associated macrophages (TAMs) in gastric cancer.20 Here in the study, we aimed to investigate the expression of CSF-1 in gastric cancer and its correlation with the clinicopathological characteristics as well as clinical outcomes. Furthermore, a predictive nomogram was generated to evaluate the 3- and 5-year overall survival for the patients with gastric cancer after surgery.
PATIENTS AND METHODS
Clinical Specimens
The study enrolled 365 patients diagnosed with gastric cancer at Zhongshan Hospital, Fudan University (Shanghai, China) in 2008. All the patients underwent a radical resection (R0) from the same surgical team and anticancer therapy naïve before surgery. The clinicopathological and baseline demographic characteristics of the patients, including age, gender, tumor size, tumor differentiation, Lauren's classification, and tumor stage were retrospectively collected. Two independent gastroenterology pathologists from Department of Pathology, Zhongshan Hospital gave their reassessments for the tumor stage according to the 7th Edition of the UICC/AJCC TNM Staging System. Overall survival was defined as the time from the date of surgery to the date of death or last visit. Written informed consent from each patient was achieved and the use of human specimens was approved by the Clinical Research Ethics Committee of Zhongshan Hospital.
Tissue Microarray and Immunohistochemical Staining
The construction of tissue microarray and the immunohistochemical protocols were as previously described.21 Antimacrophage colony-stimulating factor antibody (Abcam, Cambridge, MA) was used as the primary antibody in the immunohistochemical analysis. A computerized image system composed of an Olympus CCD camera connected to a Nikon eclipse Ti-s microscope was used to measure the density of positive staining. The stained sections were scanned at × 200 magnification and 3 independent microscopic fields with the strongest staining were captured by NIS-Element F3.2 software to ensure representativeness and homogeneity. Each photo used an identical setting. Image-Pro Plus version 6.0 software (Media Cybernetics Inc, Bethesda, MD) was used to measure the density of the staining. Integrated optical density (IOD) of all the positive staining in the captured photo was measured to give a quantitative assessment for the staining. The mean IOD of the 3 captured microscopic fields was regarded as the density of CSF-1 expression in the represented tissue. Two independent gastroenterology pathologists who were blinded to the patient outcomes and clinicopathological characteristics gave the evaluation of the immunostaining. The cut-off point for the definition of high/low expression subgroups were determined by X-tile software.22
Statistical Analysis
SPSS 19.0 (SPSS Inc, Chicago, IL) and R software version 3.0.2 with the “rms” package (R Foundation for Statistical Computing, Vienna, Austria) were used to perform the analyses. Pearson χ2 test or Kruskal–Wallis test was used to compare categorical variables. Continuous variables were analyzed by Student's t test. Overall survival functions were compared using Kaplan–Meier estimates, and statistical significance was determined using the log-rank test. Multivariable Cox proportional hazards models were used to identify the independent prognosticator. Nomogram was generated by R software with “rms” package. Calibration plots for 3- and 5-year overall survival were constructed to examine the performance characteristics of the generated nomogram. The prognostic accuracy was measured by calculating Harrell's concordance indices (c-indices). All statistical analyses were 2-sided and P < 0.05 was regarded as statistically significant.
RESULTS
Immunohistochemical Findings
The positive staining of CSF-1 was observed in the cytoplasm and/or on the membrane of neoplastic epithelia and in the stroma (Figure 1A–D). The integrated optical density (IOD) of the immunostaining in each specimen varied greatly in tumor tissues. The measured IOD of the staining in tumor tissue was 237.0 ± 235.1 (median 144.9; range from 0.7 to 1185.9). With the X-tile software, the cut-off point was 236.3, which was determined using the method of minimum P value. Thus, the CSF-1 low expression subgroup included 231 (63.3%) patients whereas the high expression subgroup included 134 (36.7%) patients.
FIGURE 1.
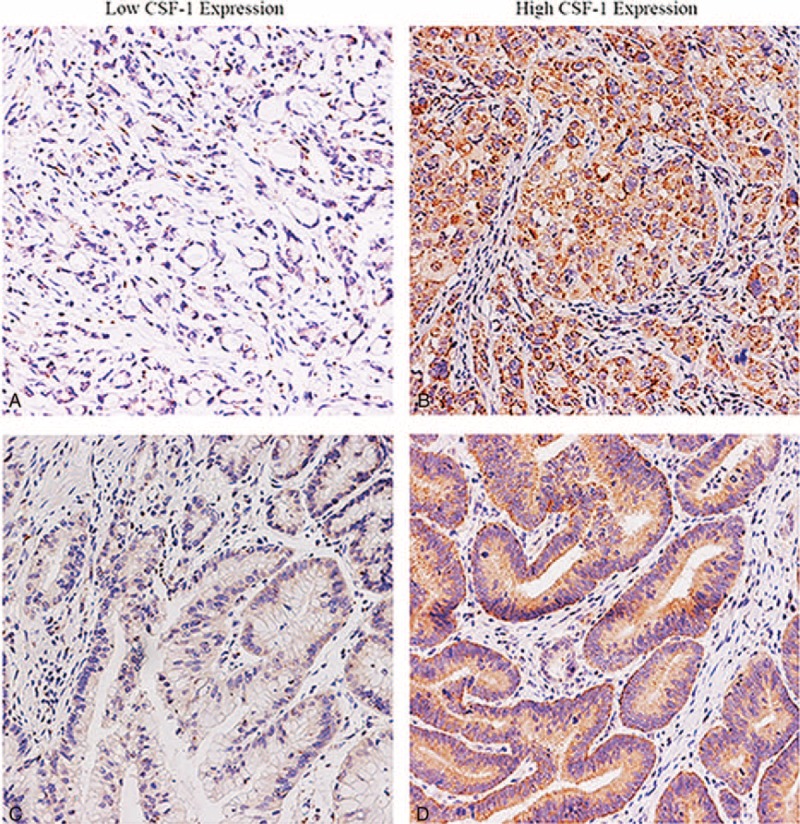
Representative images for CSF-1 expression in gastric cancer. Gastric cancer tissue with low CSF-1 expression (A, C) and high CSF-1 expression (B, D). Magnification 200 × . CSF-1 = colony-stimulating factor-1.
Correlations Between CSF-1 Expression and the Clinicopathological Features
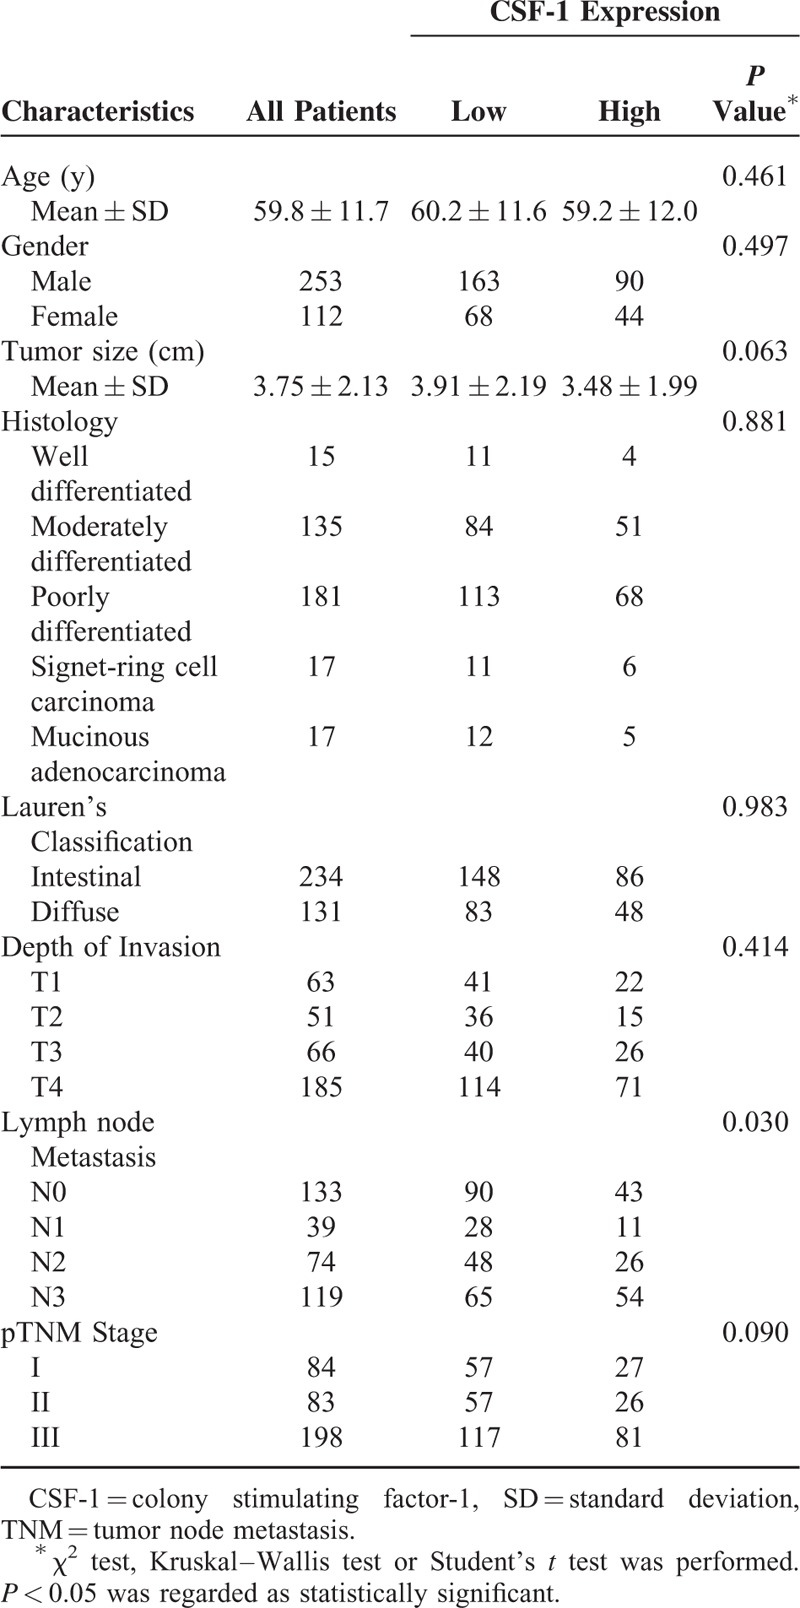
Table 1 showed clinicopathological features. All the patients were followed up until April 2014 with a median follow-up time of 43.3 months, ranging from 2 to 79 months. A total of 69.3% (253) of the patients were men. The average age of the patients was 59.8 ± 11.7 years old, ranging from 27 to 88. 64.1% (234) are of Lauren's intestinal type and the rest are of the diffuse type. The majority histological type (of 331 patients) was tubular adenocarcinoma and there were both 17 patients for signet-cell carcinoma and mucinous adenocarcinoma. Totally 232 (63.6%) of the patients had lymph node metastasis. Of all the patients, 84 were in the TNM I stage; 83 were in the TNM II stage; 198 were in the TNM III stage. The relationship between clinical pathological characteristics and CSF-1 expression is also shown in Table 1. CSF-1 expression in tumor tissue was only significantly associated with lymph node metastasis (P = 0.030). No significant association was found between CSF-1 expression and the other clinical pathological characteristics.
TABLE 1.
Correlations Between CSF-1 Expression and Clinical Pathological Features in Patients With Gastric Cancer (n = 365)
Prognostic Value of CSF-1 Expression in Gastric Cancer
Kaplan–Meier analysis was used to determine the overall survival in the 2 subgroups mentioned above. Statistical significance was determined using the log-rank test. As shown in Figure 2A, high expression of CSF-1 was associated with poor overall survival (P < 0.001). The average survival time for CSF-1 low expression subgroup was 56.3 ± 1.95 months whereas that for the high expression subgroup was only 46.16 ± 2.67 months. Kaplan–Meier analysis was also applied to compare overall survival according to CSF-1 expression in different TNM stages and Lauren's classification in tumor tissues, respectively. Significances were found in TNM III stage tumor, Lauren's intestinal-type tumor according to CSF-1 expression (Figure 2B and C) whereas in TNM I, TNM II or Lauren's diffuse-type, no significant differences were found between the 2 subgroups (Figure S1). As significances were found only in TNM III tumors, we gave a further stratified analysis in different depth of tumor invasion and lymph node metastasis status. Significant differences were found in pT3, pT4, and pN3 stage tumors (Figure 2D–F) whereas no significant differences were found in pT1, pT2, and pN0–2 stage tumors (Figure S1).
FIGURE 2.
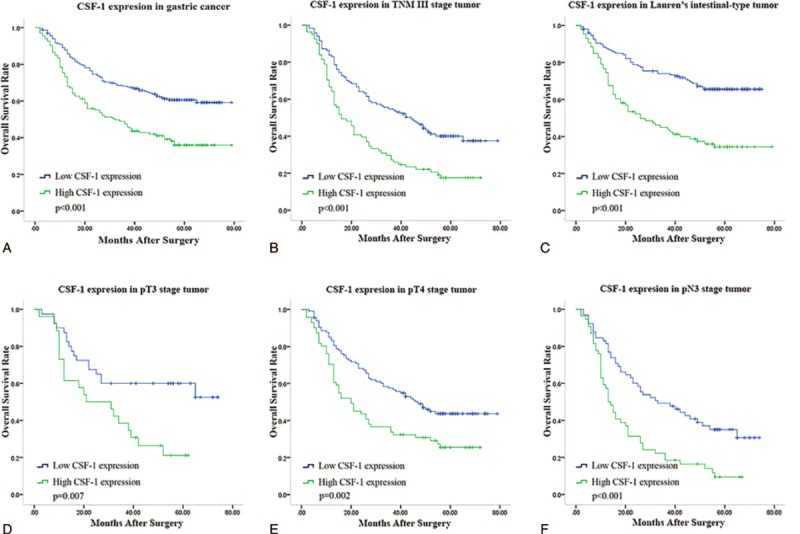
Kaplan–Meier analysis for overall survival of patients with gastric cancer according to CSF-1 expression. Kaplan–Meier analysis for overall survival according to CSF-1 expression in all patients (A); in patients with TNM III stage tumor (B); in patients with Lauren's intestinal-type tumor (C); in patients with pT3 stage tumor (D); in patients with pT4 stage tumor (E); in patients with pN3 stage tumor (F). P value, calculated by log-rank test, < 0.05 was regarded as statistically significant. CSF-1 = colony-stimulating factor-1, TNM = tumor node metastasis.
As the majority of histological type of the tumors was tubular adenocarcinoma, we gave a stratified analysis in this type of tumor according to the differentiation (Figure 3). Significant differences were found in the moderately differentiated tumor (P = 0.011) and poorly differentiated tumor (P < 0.001) whereas no difference was found in well-differentiated tumor (P = 0.858).
FIGURE 3.
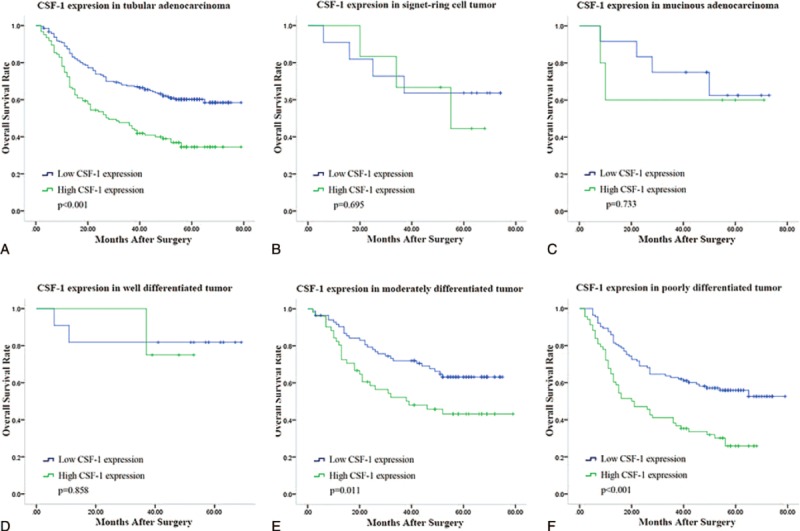
Kaplan–Meier analysis for overall survival of patients with different histological type of gastric cancer according to CSF-1 expression. Kaplan–Meier analysis for overall survival according to CSF-1 expression in patients with gastric tubular adenocarcinoma (A); gastric signet-ring cell tumor (B); gastric mucinous adenocarcinoma (C); well-differentiated tubular adenocarcinoma (D); in moderately differentiated tubular adenocarcinoma (E); in poorly differentiated tubular adenocarcinoma (F). P value, calculated by log-rank test, < 0.05 was regarded as statistically significant. CSF-1 = colony-stimulating factor-1.
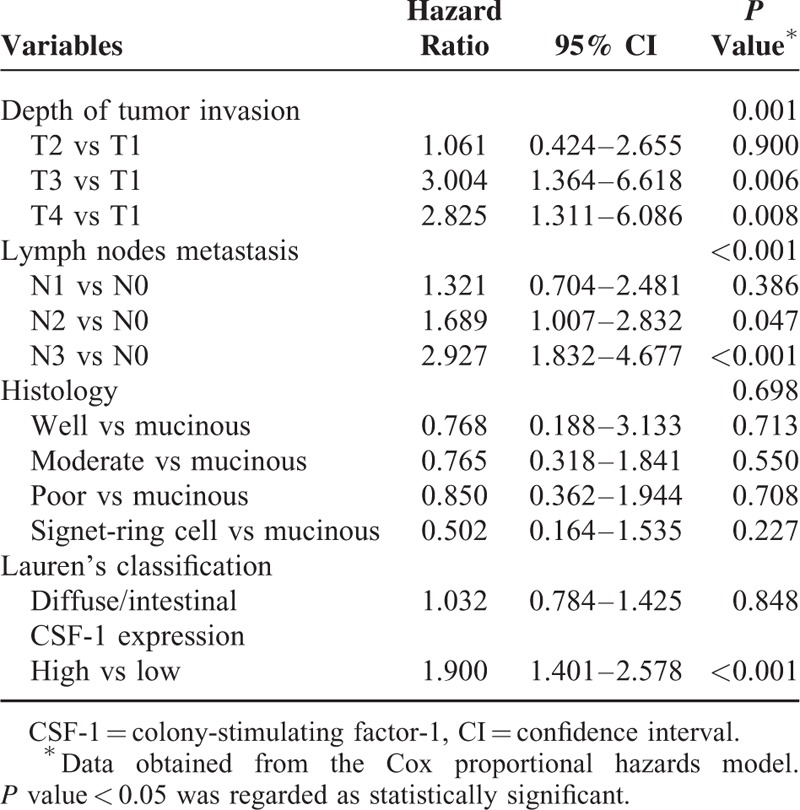
In the univariate Cox regression analysis of overall survival, CSF-1 expression was defined as a prognostic factor (P < 0.001). Multivariable Cox proportional hazards models including depth of tumor invasion, lymph node metastasis, CSF-1 expression, Lauren's classification, and histological subtype as covariables were built. Depth of tumor invasion (P = 0.003), lymph node metastasis (P < 0.001), and CSF-1 expression (P = 0.002) were found to be independent prognostic factors for overall survival for patients with gastric cancer (Table 2).
TABLE 2.
Multivariate Analysis for Survival in Gastric Cancer Patients (n = 302)
Predictive Nomogram for Overall Survival in Gastric Cancer Patients
A quantitative nomogram was built to provide a more sensitive prognostic model for outcomes of patients with gastric cancer (Figure 4A). The factors incorporated in the nomogram were independent factors for overall survival selected after multivariate analysis. A higher total point predicts a worse prognosis. The total point was raised by the addition of the score of depth of tumor invasion, lymph node metastasis, and CSF-1 expression for each patients correspondingly. For internal validation, calibration curves for nomogram predicted 3- and 5-year survival rates were built and performed well with the ideal model (Figure 4B and C). Harrell's c-index for the generated nomogram was higher (0.711; 95% CI, 0.673–0.749) than that of TNM stage (0.689; 95% CI, 0.650–0.728), indicating the nomogram performed better in predicting the overall survival for the patients.
FIGURE 4.
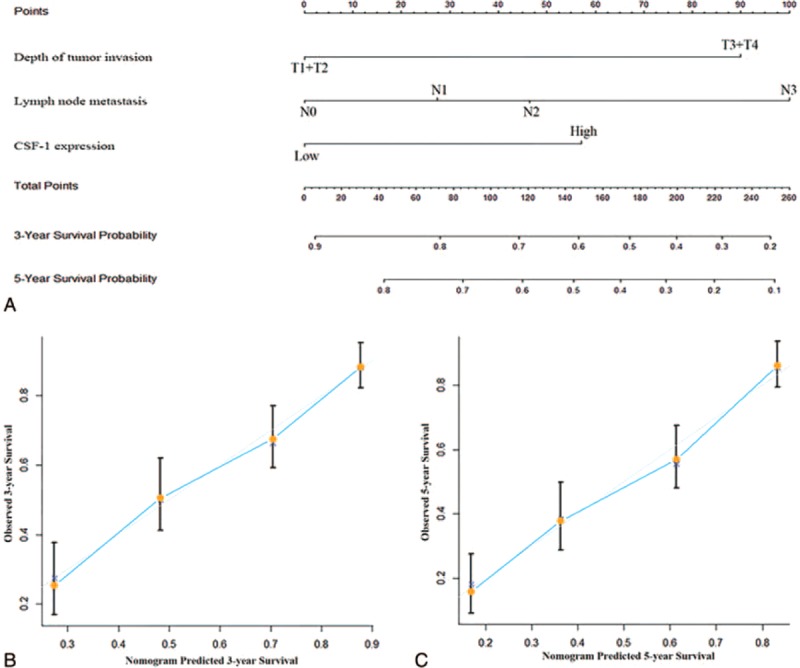
Nomogram for predicting 3- and 5-year overall survival in patients with gastric cancer. (A) Nomogram for predicting clinical outcomes integrated CSF-1 expression (low/high) with tumor depth (T1 + T2/ T3 + T4) and lymph nodes metastasis (N0/N1/N2/N3). In the nomogram, higher total point predicts worse prognosis. Addition of the scores of tumor invasion depth, lymph node metastasis status, and CSF-1 expression for each patients correspondingly gives the total point. (B) Calibration plot for nomogram predicted and observed 3-year overall survival rate. (C) Calibration plot for nomogram predicted and observed 5-year overall survival rate. Calibration curves for nomogram predicted 3- and 5-year overall survival performed well with the ideal model. Line of dashes: ideal model; vertical bars, 95% confidence interval. CSF-1 = colony-stimulating factor-1.
DISCUSSION
Studies on CSF-1 expression in various tumors have proved that CSF-1 played an important role in carcinogenesis and served as an adverse prognosticator in some tumors.16–19 However, studies on the expression of CSF-1 and its prognostic value in gastric cancer were rare. Here, we demonstrated the prognostic value of CSF-1 expression in gastric cancer and defined CSF-1 expression as an independent prognosticator for overall survival of the patients. The generated nomogram gave a better risk stratification for the overall survival of the patients than the TNM staging system.
Tumor-associated macrophages (TAM) gains increasing interest of researchers for its important role in tumor initiation, progression, and metastasis.8,23 Ishigami et al found TAMs associated with an adverse prognosis in gastric cancer 24 whereas Ohno et al revealed that the aggregation of TAMs within tumor nest had a beneficial effect.25 Divergences existed partially because these studies ignored the differences in the phenotypes of TAM. By interaction with the tumor microenvironment, macrophages change their activation states, usually defined as M1- and M2-TAM.26 Increasing evidence suggested that M2-TAMs facilitated the progression of tumors.6 Our previous work proved the prognostic significance of M1/M2 phenotypes using combined analysis of CD11c and CD206 in gastric cancer.20 As the essential regulator of macrophage homeostasis and chemotaxis, CSF-1 was reported to induce transformation of macrophages from M1 to M2 phenotype relayed by NF-κB.27 Furthermore, by blockade of CSF1/CSF1R could functionally reprogram macrophage responses that enhanced antigen presentation and productive antitumor T-cell responses.28 Thus, it is conceivable that increased expression of CSF-1 would promote M1 to M2 polarized macrophages that infiltrated and invaded favorably of the primary tumor.
In the study, CSF-1 was found to be associated with depth of tumor invasion and lymph node metastasis. Tumor gains the nutrition from the host that facilitates its development and progression via dispersion at the early stage. When tumor becomes advanced, dispersion could not provide enough nutrition. Therefore, tumor-derived growth factors that promote neoangiogenesis and lymphangiogenesis to facilitate nutrition supply and metabolite excretion emerge. It is reported that TAM could promote angiogenesis and lymphangiogenesis in gastric cancer by elevated VEGF and VEGF-C.10 Furthermore, the previous study has identified that CSF-1 could lead to the activation of signal transducer and activator of transcription-3 (Stat3), which promotes cell survival and proliferation as well as immune responses associated with tumor progression.29 These could give a possible explanation for our finding that the overall survival of the 2 subgroups differed significantly in more advanced tumors (in TNM III, pT3, pT4, and pN3 stage tumors).
Although tumor size is an important prognostic factor in many malignances, its prognostic value and relation with clinicopathological factors in gastric cancer have not been well defined. Contradictory results have been obtained about its prognostic significance and its relation with lymph node metastasis.30–32 Using tumor size as a continuous variable in our study, we found that patients with high expression of CSF-1 had a negative correlation trend with tumor size (P = 0.063) while had a positive correlation with lymph node metastasis (P = 0.030). Univariate Cox regression analysis found tumor size was not a prognostic factor for OS, making the relation between CSF-1 expression and tumor size still unclear. Therefore, relation between CSF-1 expression and tumor size need to be validated in a lager, prospective study.
Here, we unraveled the prognostic value of CSF-1 expression in gastric cancer. By different CSF-1 expression in tumor tissue, we could give a simple risk stratification for the patients. Further, CSF-1 expression yielded as an independent adverse prognostic factor for overall survival in gastric cancer patients. Stratification analyses revealed CSF-1 expression could give some additional prognostic information in tumors of different stages, especially in advanced tumors. A nomogram by integrating CSF-1 expression, depth of tumor invasion, and lymph node metastasis status was built to give a quantitative prediction for the 3- and 5-year overall survival of the patients. Calibration plots and c-indices for the generated nomogram indicated a better performance than the TNM staging system in discrimination for the patients of different outcomes.
Accumulating evidence indicated that anticancer therapies, including cytotoxic drugs, radiotherapy, and targeted agents depended on the activation of anticancer immune responses.33 Studies on the reversion of M1/M2 polarization, as well as the prognostic value of TAMs 34,35 and CSF-1 expression given, raised the possibility that by targeting the reversion of TAM polarization could open a new avenue for the treatment of gastric cancer.
In conclusion, we have identified aberrant expression of CSF-1 in gastric cancer as an independent prognostic factor, which could be integrated with depth of tumor invasion and lymph node metastasis status to generate a nomogram to give a better risk stratification for gastric cancer patients with different prognosis, especially in advanced stages.
Supplementary Material
Footnotes
Abbreviations: CSF-1 = colony-stimulating factor-1, CSF-1R = colony-stimulating factor-1 receptor, IOD = integrated optical density, M-CSF = macrophage colony-stimulating factor, NF-κB = Nuclear factor-kappa B, Stat3 = signal transducer and activator of transcription-3, TAM = tumor-associated macrophages, TNM = tumor node metastasis, VEGF = vascular endothelial growth factor.
HL, HZ, ZS contributed equally to this study.
Funding: this study was funded by grants from National Basic Research Program of China (2012CB822104), National Key Projects for Infectious Diseases of China (2012ZX10002-012), National Natural Science Foundation of China (31100629, 31270863, 31300671, 81372755, 31470794, 81401988, 81402082, 81402085, 81471621, 81472227, 81472376, 31570803 and 81572352), Program for New Century Excellent Talents in University (NCET-13–0146) and Shanghai Rising-Star Program (13QA1400300). All these study sponsors have no roles in the study design, in the collection, analysis, and interpretation of data.
The authors have no conflicts of interest to disclose.
REFERENCES
- 1.Torre LA, Bray F, Siegel RL, et al. Global cancer statistics, 2012. CA Cancer J Clin 2015; 65:87–108. [DOI] [PubMed] [Google Scholar]
- 2.Mayer RJ, Venook AP, Schilsky RL. Progress against GI cancer during the American Society of Clinical Oncology's first 50 years. J Clin Oncol 2014; 32:1521–1530. [DOI] [PubMed] [Google Scholar]
- 3.Washington K. 7th edition of the AJCC cancer staging manual: stomach. Ann Surg Oncol 2010; 17:3077–3079. [DOI] [PubMed] [Google Scholar]
- 4.Grivennikov SI, Greten FR, Karin M. Immunity, inflammation, and cancer. Cell 2010; 140:883–899. [DOI] [PMC free article] [PubMed] [Google Scholar]
- 5.Kitamura T, Qian BZ, Pollard JW. Immune cell promotion of metastasis. Nat Rev Immunol 2015; 15:73–86. [DOI] [PMC free article] [PubMed] [Google Scholar]
- 6.Sica A, Schioppa T, Mantovani A, et al. Tumour-associated macrophages are a distinct M2 polarised population promoting tumour progression: potential targets of anti-cancer therapy. Eur J Cancer 2006; 42:717–727. [DOI] [PubMed] [Google Scholar]
- 7.Mantovani A, Sica A. Macrophages, innate immunity and cancer: balance, tolerance, and diversity. Curr Opin Immunol 2010; 22:231–237. [DOI] [PubMed] [Google Scholar]
- 8.Pollard JW. Tumour-educated macrophages promote tumour progression and metastasis. Nat Rev Cancer 2004; 4:71–78. [DOI] [PubMed] [Google Scholar]
- 9.Pollard JW. Trophic macrophages in development and disease. Nat Rev Immunol 2009; 9:259–270. [DOI] [PMC free article] [PubMed] [Google Scholar]
- 10.Wu H, Xu JB, He YL, et al. Tumor-associated macrophages promote angiogenesis and lymphangiogenesis of gastric cancer. J Surg Oncol 2012; 106:462–468. [DOI] [PubMed] [Google Scholar]
- 11.Okita Y, Tanaka H, Ohira M, et al. Role of tumor-infiltrating CD11b + antigen-presenting cells in the progression of gastric cancer. J Surg Res 2014; 186:192–200. [DOI] [PubMed] [Google Scholar]
- 12.Wynn TA, Chawla A, Pollard JW. Macrophage biology in development, homeostasis and disease. Nature 2013; 496:445–455. [DOI] [PMC free article] [PubMed] [Google Scholar]
- 13.Chitu V, Stanley ER. Colony-stimulating factor-1 in immunity and inflammation. Curr Opin Immunol 2006; 18:39–48. [DOI] [PubMed] [Google Scholar]
- 14.Lin EY, Pollard JW. Tumor-associated macrophages press the angiogenic switch in breast cancer. Cancer Res 2007; 67:5064–5066. [DOI] [PubMed] [Google Scholar]
- 15.Gordon S, Martinez FO. Alternative activation of macrophages: mechanism and functions. Immunity 2010; 32:593–604. [DOI] [PubMed] [Google Scholar]
- 16.Smith HO, Stephens ND, Qualls CR, et al. The clinical significance of inflammatory cytokines in primary cell culture in endometrial carcinoma. Mol Oncol 2013; 7:41–54. [DOI] [PMC free article] [PubMed] [Google Scholar]
- 17.Espinosa I, Beck AH, Lee CH, et al. Coordinate expression of colony-stimulating factor-1 and colony-stimulating factor-1-related proteins is associated with poor prognosis in gynecological and nongynecological leiomyosarcoma. Am J Pathol 2009; 174:2347–2356. [DOI] [PMC free article] [PubMed] [Google Scholar]
- 18.Yang L, Wu Q, Xu L, et al. Increased expression of colony stimulating factor-1 is a predictor of poor prognosis in patients with clear-cell renal cell carcinoma. BMC Cancer 2015; 15:67. [DOI] [PMC free article] [PubMed] [Google Scholar]
- 19.Richardsen E, Uglehus RD, Johnsen SH, et al. Macrophage-colony stimulating factor (CSF1) predicts breast cancer progression and mortality. Anticancer Res 2015; 35:865–874. [PubMed] [Google Scholar]
- 20.Zhang H, Wang X, Shen Z, et al. Infiltration of diametrically polarized macrophages predicts overall survival of patients with gastric cancer after surgical resection. Gastric Cancer 2014. [DOI] [PubMed] [Google Scholar]
- 21.Zhu XD, Zhang JB, Zhuang PY, et al. High expression of macrophage colony-stimulating factor in peritumoral liver tissue is associated with poor survival after curative resection of hepatocellular carcinoma. J Clin Oncol 2008; 26:2707–2716. [DOI] [PubMed] [Google Scholar]
- 22.Camp RL, Dolled-Filhart M, Rimm DL. X-tile: a new bio-informatics tool for biomarker assessment and outcome-based cut-point optimization. Clin Cancer Res 2004; 10:7252–7259. [DOI] [PubMed] [Google Scholar]
- 23.Okazaki T, Ebihara S, Takahashi H, et al. Macrophage colony-stimulating factor induces vascular endothelial growth factor production in skeletal muscle and promotes tumor angiogenesis. J Immunol 2005; 174:7531–7538. [DOI] [PubMed] [Google Scholar]
- 24.Ohno S, Inagawa H, Dhar DK, et al. The degree of macrophage infiltration into the cancer cell nest is a significant predictor of survival in gastric cancer patients. Anticancer Res 2003; 23 (6D):5015–5022. [PubMed] [Google Scholar]
- 25.Ishigami S, Natsugoe S, Tokuda K, et al. Tumor-associated macrophage (TAM) infiltration in gastric cancer. Anticancer Res 2003; 23 (5A):4079–4083. [PubMed] [Google Scholar]
- 26.Murray PJ, Allen JE, Biswas SK, et al. Macrophage activation and polarization: nomenclature and experimental guidelines. Immunity 2014; 41:14–20. [DOI] [PMC free article] [PubMed] [Google Scholar]
- 27.Yang Y, Qin J, Lan L, et al. M-CSF cooperating with NFkappaB induces macrophage transformation from M1 to M2 by upregulating c-Jun. Cancer Biol Ther 2014; 15:99–107. [DOI] [PMC free article] [PubMed] [Google Scholar]
- 28.Zhu Y, Knolhoff BL, Meyer MA, et al. CSF1/CSF1R blockade reprograms tumor-infiltrating macrophages and improves response to T-cell checkpoint immunotherapy in pancreatic cancer models. Cancer Res 2014; 74:5057–5069. [DOI] [PMC free article] [PubMed] [Google Scholar]
- 29.Komohara Y, Hasita H, Ohnishi K, et al. Macrophage infiltration and its prognostic relevance in clear cell renal cell carcinoma. Cancer Sci 2011; 102:1424–1431. [DOI] [PubMed] [Google Scholar]
- 30.Saito H, Osaki T, Murakami D, et al. Macroscopic tumor size as a simple prognostic indicator in patients with gastric cancer. Am J Surg 2006; 192:296–300. [DOI] [PubMed] [Google Scholar]
- 31.Liu X, Xu Y, Long Z, et al. Prognostic significance of tumor size in T3 gastric cancer. Ann Surg Oncol 2009; 16:1875–1882. [DOI] [PubMed] [Google Scholar]
- 32.Zu H, Wang F, Ma Y, et al. Stage-stratified analysis of prognostic significance of tumor size in patients with gastric cancer. PLoS One 2013; 8:e54502. [DOI] [PMC free article] [PubMed] [Google Scholar]
- 33.Galluzzi L, Senovilla L, Zitvogel L, et al. The secret ally: immunostimulation by anticancer drugs. Nat Rev Drug Discov 2012; 11:215–233. [DOI] [PubMed] [Google Scholar]
- 34.Saccani A, Schioppa T, Porta C, et al. p50 nuclear factor-kappaB overexpression in tumor-associated macrophages inhibits M1 inflammatory responses and antitumor resistance. Cancer Res 2006; 66:11432–11440. [DOI] [PubMed] [Google Scholar]
- 35.Guiducci C, Vicari AP, Sangaletti S, et al. Redirecting in vivo elicited tumor infiltrating macrophages and dendritic cells towards tumor rejection. Cancer Res 2005; 65:3437–3446. [DOI] [PubMed] [Google Scholar]
Associated Data
This section collects any data citations, data availability statements, or supplementary materials included in this article.


