

Abstract
Although reducing dietary salt consumption is the most cost-effective strategy for preventing progression of cardiovascular and renal disease, policy-based approaches to monitor sodium intake accurately and the understanding factors associated with excessive sodium intake for the improvement of public health are lacking.
We investigated factors associated with high sodium intake based on the estimated 24-hour urinary sodium excretion, using data from the 2009 to 2011 Korea National Health and Nutrition Examination Survey (KNHANES).
Among 21,199 adults (≥19 years of age) who participated in the 2009 to 2011 KNHANES, 18,000 participants (weighted n = 33,969,783) who completed urinary sodium and creatinine evaluations were analyzed in this study. The 24-hour urinary sodium excretion was estimated using Tanaka equation.
The mean estimated 24-hour urinary sodium excretion level was 4349 (4286–4413) mg per day. Only 18.5% (weighted n = 6,298,481/3,396,973, unweighted n = 2898/18,000) of the study participants consumed less the 2000 mg sodium per day. Female gender (P < 0.001), older age (P < 0.001), total energy intake ≥50 percentile (P < 0.005), and obesity (P < 0.001) were associated with high sodium intake, even after adjusting for potential confounders. Senior high school/college graduation in education and managers/professionals in occupation were associated with lower sodium intake (P < 0.001). According to hypertension management status, those who had hypertension without medication consumed more sodium than those who were normotensive. However, those who receiving treatment for hypertension consumed less sodium than those who were normotensive (P < 0.001). The number of family members, household income, and alcohol drinking did not affect 24-hour urinary sodium excretion. The logistic regression analysis for the highest estimated 24-hour urinary sodium excretion quartile (>6033 mg/day) using the abovementioned variables as covariates yielded identical results.
Our data suggest that age, sex, education level, occupation, total energy intake, obesity, and hypertension management status are associated with excessive sodium intake in Korean adults using nationally representative data. Factors associated with high sodium intake should be considered in policy-based interventions to reduce dietary salt consumption and prevent cardiovascular disease as a public health target.
INTRODUCTION
Excessive sodium intake is a risk factor for hypertension and related cardiovascular disease, renal disease, osteoporosis, and stomach cancer.1 Both a meta-analysis and a prospective cohort study indicated that high sodium intake was associated with an increased risk of stroke and cardiovascular mortality.2,3 Based on the accumulating evidence of the beneficial effects of salt reduction, the World Health Organization (WHO) recommends a reduction in sodium intake to <2.0 g per day (5 g per day salt) to reduce blood pressure and the risk of cardiovascular disease, stroke, and coronary heart disease in adults.4 However, the mean level of consumption of sodium worldwide is 3.95 g per day and 99.2% of the adult population globally has estimated mean levels of sodium intake exceeding the WHO recommendation of 2.0 g per day.5 According to the 2012 Korea National Health and Nutrition Examination Survey (KNHANES), which used a 24 hour dietary recall questionnaire to estimate salt intake, the daily sodium intake among Koreans is 4.5 g, which exceeds the average levels of sodium intake worldwide as well as the WHO recommendation.6
Estimates suggest that 3 g/day reduction in salt intake in the US population would decrease the annual number of new cases of coronary heart disease by up to 120,000, stroke by 66,000, and myocardial infarction by 99,000, and decrease the annual number of deaths from any cause by up to 92,000.7 Although reducing dietary salt consumption is the most cost-effective strategy for preventing progression of cardiovascular and renal disease, policy-based approaches to monitor sodium intake accurately and the understanding factors associated with excessive sodium intake for the improvement of public health are lacking.
In this study, we investigated factors associated with high sodium intake based on the estimated 24-hour urinary sodium excretion, using data from the 2009 to 2011 KNHANES.
METHODS
Study Population and Data Collection
This study is based on data from the 2009 to 2011 Korea KNHANES, a cross-sectional and nationally representative survey conducted by the Korean Centers for Disease Control for Health Statistics. The KNHANES has been conducted periodically since 1998 to assess the health and nutritional status of the civilian, noninstitutionalized population of Korea. Participants were selected using proportional allocation-systemic sampling with multistage stratification. A standardized interview was conducted in the homes of the participants to collect information on demographic variables, family history, medical history, medications used, and a variety of other health-related variables. The health interview included an established questionnaire to determine the demographic and socioeconomic characteristics of the subjects including age, education level, occupation, household income, marital status, smoking habit, alcohol consumption, exercise, previous and current diseases, and family disease history. Total energy intake was obtained from the nutrition survey.
Alcohol consumption was assessed by questioning the subjects about their drinking behavior during the month before the interview. Hypertension was defined as systolic blood pressure ≥140 mmHg, diastolic blood pressure ≥90 mmHg, or use of antihypertensive medications irrespective of blood pressure. Obesity was defined as a body mass index (BMI) ≥25 kg/m2 according to the Asia-Pacific obesity classification.8
Height and weight were obtained using standardized techniques and equipment. Height was measured to the nearest 0.1 cm using a portable stadiometer (Seriter, Bismarck, ND). Weight was measured to the nearest 0.1 kg using a Giant-150N calibrated balance-beam scale (Hana, Seoul, Korea). BMI was calculated by dividing weight by the square of the height (kg/m2). Systolic and diastolic blood pressure was measured by standard methods using a sphygmomanometer while the patient was seated. Three measurements were recorded for all subjects at 5 minutes intervals, and the average of the second and third measurements was used in the analysis.
Estimating the 24-Hour Urinary Sodium Excretion
The 24-hour urinary sodium excretion was estimated from the sodium and creatinine of random urine samples using Tanaka equation: 24-hour urinary Na excretion (mmol/day) = 21.98 × UNa/UCr × (–2.04 × age+ 14.89 × weight [kg] + 16.14 × height [cm] – 2244.45)0.392.9
Ethics Statement
The Institutional Review Board of Ilsan Paik Hospital, Republic of Korea, approved this study. The KNHANES dataset was made available at the request of the investigator. Because the dataset did not include personal information and participant consent had already been given for the KNHANES, our study was exempt from the requirement for participant consent.
Statistical Analyses
The KNHANES participants were not randomly sampled. The survey was designed using a complex, stratified, multistage probability-sampling model; thus, individual participants were not equally representative of the Korean population. To obtain representative prevalence rates from the dataset, it was necessary to consider the power of each participant (sample weight) as representative of the Korean population. Following approval from the Korea Centers for Disease Control and Prevention, we received a survey dataset that included information regarding the survey location, strata by age, sex, and various other factors, and the sample weight for each participant. The survey sample weights, which were calculated by taking into account the sampling rate, response rate, and age/sex proportions of the reference population (2005 Korean National Census Registry), were used in all of the analyses to provide representative estimates of the noninstitutionalized Korean civilian population.
To compare the weighted unadjusted and adjusted estimated 24-hour urinary sodium excretion according to several socioeconomic and clinical parameters, an analysis of covariance (ANCOVA) was used. A logistic regression analysis was used to evaluate the odds ratios for an estimated 24-hour urinary sodium excretion >2000 mg/day or the highest estimated 24-hour urinary sodium excretion quartile (>6033 mg/day) with covariates that showed significant differences in previous univariate analysis. The covariates were categorized as follows.
Age was classified into 6 groups (19–29, 30–39, 40–49, 50–59, 60–69, and ≥70), the number of family members into 4 groups (1, 2, 3, and ≥4), household income into 4 groups (≤24th percentile, 25–49th percentile, 50–74th percentile, and ≥75th percentile), education level into 4 groups (elementary school graduation, junior high school graduation, senior high school graduation, and college graduation), occupation into 7 groups (managers and professionals, clerical support workers, service and sales workers, skilled agricultural, forestry and fishery workers, craft, plant, or machine operators and assemblers, laborers, and unemployed including students and house wives), total energy intake into 4 groups (≤24th percentile (−1380 kcal/day), 25–49th percentile (1381–1800 kcal/day), 50–74th percentile (1801–2330 kcal/day), and ≥75th percentile (≥2331 kcal/day)), alcohol drinking into 3 groups (none, 1–3/week, and ≥4/week), BMI into 2 groups (<25 and ≥25 kg/m2), and hypertension into 3 groups (normotensive, hypertension without medication, hypertension with medication).
All of the tests were 2-sided, and P-values <0.05 were considered to indicate statistical significance. Statistical analyses were performed using SPSS software (ver. 21.0 for Windows; SPSS, Chicago, IL).
RESULTS
Weighted Demographic and Clinical Characteristics of the Study Population
The demographic and clinical characteristics of the study population are shown in Table 1. Among 21,199 adult participants (≥19 years of age) who participated in the 2009 to 2011 KNHANES, 18,000 participants (weighted n = 33,969,783) who completed urinary sodium and creatinine evaluations were analyzed in this study.
TABLE 1.
Weighted Demographic and Clinical Characteristics of the Study Population

The weighted mean age of the study population was 45.4 ± 0.2 years, and 47.78% of the participants were female. The distribution of daily sodium intake in Korean men and women are shown in Figure 1. The mean estimated 24-hour urinary sodium excretion level was 4349 (4286–4413) mg per day. Only 18.5% (weighted n = 6,298,481/3,396,973, unweighted n = 2898/18,000) of the study participants consumed less than 2000 mg sodium per day. The weighted average total energy intake was 2037 ± 11 kcal per day. The prevalence of hypertension and obesity was 28.45% and 32.18%, respectively.
FIGURE 1.
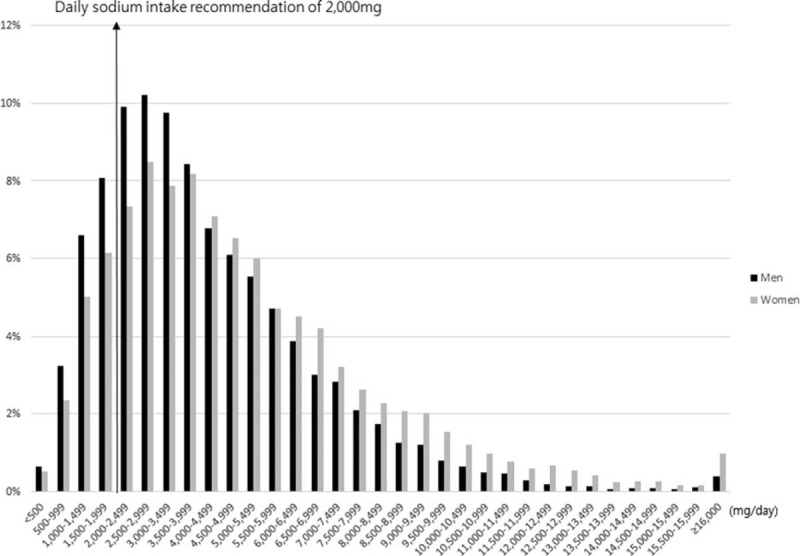
The distribution of daily sodium intake in Korean men and women.
Adjusted Weighted Mean Estimated 24-Hour Urinary Sodium Excretion According to Sociodemographic and Health Status Factors
We assessed sodium intake using weighted mean estimated 24-hour urinary sodium excretion according to sociodemographic and health status factors, after adjusting for age, sex, education level, number of family members, household income, occupation, total energy intake, alcohol drinking, BMI, and hypertension (Table 2).
TABLE 2.
Weighted Mean Estimated 24-h Urinary Sodium Excretion According to the Sociodemographic and Health Status Factors

The mean 24-hour urinary sodium excretion level in females was higher than in males (P < 0.001). Mean sodium intake was highest in individuals aged 60 to 69 years and lowest in those aged 19 to 29 years (Figure 2). Having an education level of senior high school/college graduation and being a manager/professional were associated with lower sodium intake. Participants with higher total energy intake and BMI consumed more salt. According to hypertension management status, those who had hypertension without medication had the highest sodium intake, while those who were receiving treatment for hypertension had the lowest sodium intake. The number of family members, household income, and alcohol drinking did not affect 24-hour urinary sodium excretion.
FIGURE 2.
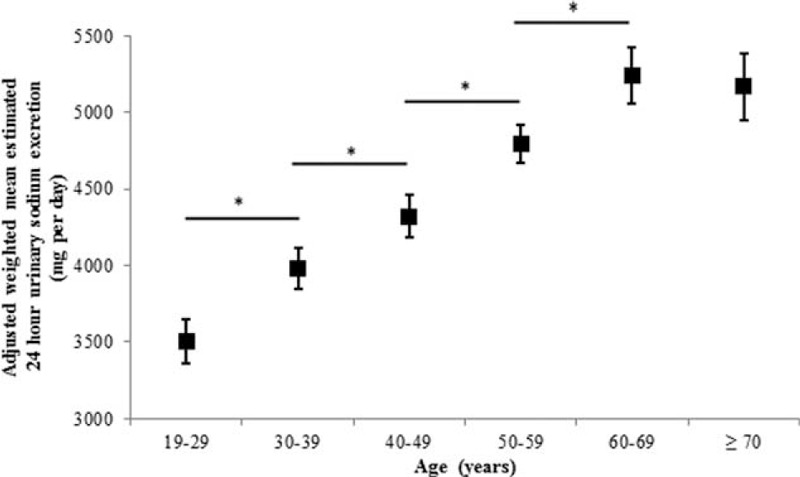
Adjusted weighted mean estimated 24-hour urinary sodium excretion according to age (∗P < 0.001). Sex, education level, number of family members, household income, occupation, total energy intake, alcohol drinking, body mass index, and hypertension were adjusted. Bars indicate 95% confidence intervals of an analysis of covariance (ANCOVA).
Factors Associated With High Sodium Intake
A logistic regression analysis for estimated 24-hour urinary sodium excretion >2000 mg per day using sex, age, education level, the number of family members, household income, occupation, total energy intake, alcohol drinking, BMI, and hypertension as covariates was performed (Table 3).
TABLE 3.
Logistic Regression Analyses for Estimated 24-h Urinary Sodium >2000 mg/d or the Highest Estimated 24-h Urinary Sodium Quartile (>6033 mg/d)

Female showed an increased risk of the estimated 24-hour urinary sodium excretion >2000 mg per day (OR 1.56, 95% CI: 1.37–1.78, P < 0.001) compared to males. Sodium intake significantly increased with age. Using subject aged 19 to 29 years as a control, adults aged 60 to 69 and older than 70 years had 5.85- (95% CI: 4.52–7.58, P < 0.001) and 7.04- (95% CI: 5.28–9.38, P < 0.001) fold, greater risks, respectively, of an estimated 24-hour urinary sodium excretion >2000 mg per day.
Regarding occupation, using managers and professionals as a control, skilled agricultural, forestry, and fishery workers; craft, plant or machine operators and assemblers; and laborers were associated with increased risk of the estimated 24-hour urinary sodium excretion >2000 mg per day. High energy intake and obesity were associated with increased risk of the estimated 24-hour urinary sodium excretion >2000 mg per day. According to hypertension management status, using subjects without hypertension as a control, adjusted ORs for an estimated 24-hour urinary sodium excretion >2000 mg per day were 1.22 (95% CI: 1.02–1.45, P = 0.031) and 0.55 (95% CI: 0.47–0.64, P < 0.001) in those with hypertension without medication and those with hypertension on medication, respectively. Education level, number of family members, household income, and alcohol drinking showed no significantly increased risk of an estimated 24-hour urinary sodium excretion >2000 mg per day.
We performed an additional logistic regression analysis for the highest estimated 24-hour urinary sodium excretion quartile (>6033 mg per day) using the abovementioned variables as covariates. Age, sex, obesity, total energy intake, and hypertension management status were significant factors associated with the highest estimated 24-hour urinary sodium excretion quartile; that is, an estimated 24-hour urinary sodium excretion >2000 mg per day. The number of family members, household income, and alcohol drinking did not show an increased risk of the highest estimated 24-hour urinary sodium excretion quartile.
However, using elementary school graduation as a control, senior high school graduation (OR 0.78, 95% CI: 0.67–0.91, P = 0.002) and college graduation (OR 0.66, 95% CI: 0.55–0.80, P < 0.001) were associated with a decreased risk of the highest estimated 24-hour urinary sodium excretion quartile, respectively.
Concerning occupation, using managers and professionals as a control, clerical support workers and service and sales workers showed an increased risk of the highest estimated 24-hour urinary sodium excretion quartile, which did not show the statistical difference in the risk of the estimated 24-hour urinary sodium excretion >2000 mg per day.
DISCUSSION
Using data from the KNHANES 2009 to 2011 study, we reported that the mean estimated 24-hour-urinary sodium excretion in the Korean population aged ≥19 years is 4349 (4286–4413) mg per day. This estimate is higher than the global mean sodium intake 3.95 g published by the Global Burden of Disease Nutrition and Chronic Disease Expert Group.10 A previous study reported that Asian regions had the highest sodium intake of 4.80 g per day (95% CI: 4.59–5.02); this was particularly so for high-income Asia Pacific countries (mainly Japan and South Korea), which had a mean sodium intake of 5.00 g per day (95% CI: 4.85–5.16).10 This exceeds the average levels of sodium intake worldwide as well as the WHO recommendation. It is assumed that Koreans consume excessive levels of sodium in traditional foods, such as kimchi, soy sauce and paste, salt-fermented seafood, and soups. In Japan, daily salt intake was also associated with the frequency of intake of miso soup and Japanese pickles in all age groups.11
Our study suggests that sociodemographic factors, including age, sex, education level, and occupation as well as total energy intake, obesity, and hypertension management status are associated with excessive sodium intake in Korean adults. On the other hand, the number of family members, household income, and alcohol drinking may not affect salt consumption.
Age was the most powerful factor influencing the sodium intake in this study. Adults older than 70 years had sevenfold greater risk of an estimated 24-hour urinary sodium excretion >2000 mg per day than did adults aged 19 to 29 years. Losses of taste and smell in the elderly might lead to a preference for a salty taste hence greater consumption of sodium.12
The mean level of 24-hour urinary sodium excretion in females was higher than that in males, which contradicts previous reports.2,6,13,14 This result can be explained by differences in dietary sources of sodium and in the methods of measuring total energy and sodium intake among countries. In European and North American countries, sodium intake is dominated by sodium added to manufactured foods eaten away from the home. In contrast, salt and soy sauce added at home are the largest sources in Asian countries, such as Japan and China.15 Higher proportion of females in Korea compared to male eat at home, where they consume sodium. Furthermore, the significant difference between genders in sodium intake might disappear after adjustment for total energy intake, which is a strong determinant of a high sodium intake.
Socioeconomic status (SES) is usually defined based both on head of household occupation and educational attainment, and contributes to health inequalities.16 Previous studies have shown that low SES is associated with salt consumption and hypertension.16,17 Pechey et al18 reported that lower SES is associated with purchasing a greater proportion of less-healthy food and sodium in an analysis of >25,000 British households. In a Japanese occupational cohort (the J-HOPE Study), years of education and household income significantly affected salt intake and hypertension.19 Our study also showed that high SES, including having an educational levels of senior high school/college graduation and being a managers/professionals, was associated with lower sodium intake.
It is feasible to think that the positive association between sodium intake and body weight is caused by high consumption of high-calorie, sugar-sweetened beverages and salty foods, such as cheese and junk food. However, several previous studies have reported that sodium intake is positively associated with obesity independent of total energy intake, which is consistent with our finding.20–23 The mechanism of the direct link between dietary sodium intake and body weight is unclear. It is possible that high sodium intake alters body fat metabolism and directly increases body fat in an unknown way. The Danish Monitoring Trends in Cardiovascular Disease (MONICA) study reported a significant increase in body fat of 0.24 kg and decreased in free fat mass of 0.21 kg per 100 mmol increase in urinary sodium, after adjusting for potential confounders.20 In the UK National Diet and Nutrition Survey 2008/2009 to 2011/2012, a 1 g per day increase in salt was associated with an increase of 26% in the risk of obesity and 0.91 kg in body fat mass in adults, after adjusting for age, sex, ethnic group, household income, physical activity, total energy intake, and diet misreporting.21 A high sodium intake could also be an indicator of an overall unhealthy lifestyle, characterized by imbalances between energy intake and expenditure.21,22
Hypertension management status also significantly affected sodium intake. As expected, those who had hypertension without medication consumed more sodium than those who were normotensive. However, those who were receiving treatment for hypertension consumed less sodium than those who were normotensive. A possible reason for this is that patients with hypertension under medication would make effort to eat less salt with insight into disease. However, we cannot exclude the possibility of a reverse causality.
The major strength of our study is the large, nationally representative sample of adult Koreans analyzed by measuring estimated from 24-hour urinary sodium excretion. Salt intake can be estimated indirectly from a dietary recall questionnaire or directly by measuring urine sodium. Estimation via dietary recalls or interviews had disadvantage of not being able to accurately determine the amount of sodium intake in the processing of data, including subjective reporting of dietary intakes, difficulty to estimate the amount of salt added during cooking and at the table and variation in the sodium content of manufactured foods.6
Nevertheless, our study had several limitations. One is that the method of estimating sodium intake used a formula-derived estimate of 24-hour urinary excretion and not actual 24-hour urinary collection. The analysis of urine collected during a 24-hour period reflects up to 95% of the ingested sodium and is considered to be the gold standard method for measuring sodium intake.24 However, collecting 24-hour urine without loss from the general population is difficult, and imposes a high burden on the participants. Therefore, use of spot urine samples to estimate sodium intake in the general population has been suggested.6 Second, although we adjusted for multiple confounding factors, the effects of residual or hidden confounding variables cannot be excluded, similar to other cross-sectional studies. Third, we cannot draw an inference as to causality due to the cross-sectional design of the study. Nonsociodemographic variables which were examined in this study, such as hypertension, total energy intake, and BMI, are not free from a reverse-causality issue. There could be also some other factors, for example, genetic component, which affect both high sodium intake and health status variables.
In conclusion, we found that age, sex, education level, occupation, total energy intake, obesity, and hypertension management status were associated with excessive sodium intake in Korean adults using nationally representative data. Factors associated with high sodium intake should be considered in policy-based interventions to reduce dietary salt consumption and prevent cardiovascular disease as a public health target. Reducing dietary salt consumption should be emphasized, especially on old people, female, and individuals with low SES.
Footnotes
Abbreviations: ANCOVA, analysis of covariance, BMI, body mass index, CI, confidence interval, KNHANES, Korea National Health and Nutrition Examination Survey, OR, odds ratio, SES, socioeconomic status.
The authors have no conflicts of interest to disclose.
REFERENCES
- 1.He FJ, MacGregor GA. Reducing population salt intake worldwide: from evidence to implementation. Prog Cardiovasc Dis 2010; 52:363–382. [DOI] [PubMed] [Google Scholar]
- 2.O’Donnell M, Mente A, Rangarajan S, et al. Urinary sodium and potassium excretion, mortality, and cardiovascular events. N Engl J Med 2014; 371:612–623. [DOI] [PubMed] [Google Scholar]
- 3.Aburto NJ, Ziolkovska A, Hooper L, et al. Effect of lower sodium intake on health: systematic review and meta-analyses. BMJ 2013; 346:f1326. [DOI] [PMC free article] [PubMed] [Google Scholar]
- 4.WHO Guidelines Approved by the Guidelines Review Committee. Guideline: Sodium Intake for Adults and Children. Geneva: World Health Organization; 2012. [PubMed] [Google Scholar]
- 5.Mozaffarian D, Fahimi S, Singh GM, et al. Global sodium consumption and death from cardiovascular causes. N Engl J Med 2014; 371:624–634. [DOI] [PubMed] [Google Scholar]
- 6.Kim HJ, Oh K. Methodological issues in estimating sodium intake in the Korea National Health and Nutrition Examination Survey. Epidemiol Health 2014; 36:e2014033. [DOI] [PMC free article] [PubMed] [Google Scholar]
- 7.Bibbins-Domingo K, Chertow GM, Coxson PG, et al. Projected effect of dietary salt reductions on future cardiovascular disease. N Engl J Med 2010; 362:590–599. [DOI] [PMC free article] [PubMed] [Google Scholar]
- 8.WHO Expert Consultation. Appropriate body-mass index for Asian populations and its implications for policy and intervention strategies. Lancet (London, England) 2004; 363:157–163. [DOI] [PubMed] [Google Scholar]
- 9.Tanaka T, Okamura T, Miura K, et al. A simple method to estimate populational 24-h urinary sodium and potassium excretion using a casual urine specimen. J Hum Hypertens 2002; 16:97–103. [DOI] [PubMed] [Google Scholar]
- 10.Powles J, Fahimi S, Micha R, et al. Global, regional and national sodium intakes in 1990 and 2010: a systematic analysis of 24 h urinary sodium excretion and dietary surveys worldwide. BMJ Open 2013; 3:e003733. [DOI] [PMC free article] [PubMed] [Google Scholar]
- 11.Wakasugi M, James Kazama J, Narita I. Associations between the intake of miso soup and Japanese pickles and the estimated 24-hour urinary sodium excretion: a population-based cross-sectional study. Intern Med 2015; 54:903–910. [DOI] [PubMed] [Google Scholar]
- 12.Schiffman SS. Taste and smell losses in normal aging and disease. JAMA 1997; 278:1357–1362. [PubMed] [Google Scholar]
- 13.Lee WJ, Kim HC, Oh SM, et al. Factors associated with a low-sodium diet: the Fourth Korean National Health and Nutrition Examination Survey. Epidemiol Health 2013; 35:e2013005. [DOI] [PMC free article] [PubMed] [Google Scholar]
- 14.Pfeiffer CM, Hughes JP, Cogswell ME, et al. Urine sodium excretion increased slightly among U.S. adults between 1988 and 2010. J Nutr 2014; 144:698–705. [DOI] [PMC free article] [PubMed] [Google Scholar]
- 15.Brown IJ, Tzoulaki I, Candeias V, et al. Salt intakes around the world: implications for public health. Int J Epidemiol 2009; 38:791–813. [DOI] [PubMed] [Google Scholar]
- 16.Ji C, Cappuccio FP. Socioeconomic inequality in salt intake in Britain 10 years after a national salt reduction programme. BMJ Open 2014; 4:e005683. [DOI] [PMC free article] [PubMed] [Google Scholar]
- 17.Colhoun HM, Hemingway H, Poulter NR. Socio-economic status and blood pressure: an overview analysis. J Hum Hypertens 1998; 12:91–110. [DOI] [PubMed] [Google Scholar]
- 18.Pechey R, Jebb SA, Kelly MP, et al. Socioeconomic differences in purchases of more vs. less healthy foods and beverages: analysis of over 25 000 British households in 2010. Soc Sci Med 2013; 92:22–26. [DOI] [PMC free article] [PubMed] [Google Scholar]
- 19.Miyaki K, Song Y, Taneichi S, et al. Socioeconomic status is significantly associated with dietary salt intakes and blood pressure in Japanese workers (J-HOPE Study). Int J Environ Res Public Health 2013; 10:980–993. [DOI] [PMC free article] [PubMed] [Google Scholar]
- 20.Larsen SC, Angquist L, Sorensen TI, et al. 24 h urinary sodium excretion and subsequent change in weight, waist circumference and body composition. PLoS ONE 2013; 8:e69689. [DOI] [PMC free article] [PubMed] [Google Scholar]
- 21.Ma Y, He FJ, MacGregor GA. High salt intake: independent risk factor for obesity? Hypertension 2015; 66:843–849. [DOI] [PubMed] [Google Scholar]
- 22.Libuda L, Kersting M, Alexy U. Consumption of dietary salt measured by urinary sodium excretion and its association with body weight status in healthy children and adolescents. Public Health Nutr 2012; 15:433–441. [DOI] [PubMed] [Google Scholar]
- 23.Yoon YS, Oh SW. Sodium density and obesity; the Korea National Health and Nutrition Examination Survey 2007–2010. Eur J Clin Nutr 2013; 67:141–146. [DOI] [PubMed] [Google Scholar]
- 24.Ji C, Sykes L, Paul C, et al. Systematic review of studies comparing 24-hour and spot urine collections for estimating population salt intake. Rev Panam Salud Publica 2012; 32:307–315. [DOI] [PubMed] [Google Scholar]