

Supplemental Digital Content is available in the text
Abstract
We evaluated the association between weight change in middle-aged adults and papillary thyroid cancer (PTC) based on a large-scale case-control study.
Our study included data from 1551 PTC patients (19.3% men and 80.7% women) who underwent thyroidectomy at the 3 general hospitals in Korea and 15,510 individually matched control subjects. The subjects’ weight history, epidemiologic information, and tumor characteristics confirmed after thyroidectomy were analyzed. Odds ratios (ORs) and 95% confidence intervals (95% CIs) were determined for the annual average changes in weight and obesity indicators (body mass index (BMI), body surface area, and body fat percentage (BF%) in subjects since the age of 35 years.
Subjects with a total weight gain ≥10 kg after age 35 years were more likely to have PTC (men, OR, 5.39, 95% CI, 3.88–7.49; women, OR, 3.36, 95% CI, 2.87–3.93) compared with subjects with a stable weight (loss or gain <5 kg). A marked increase in BMI since age 35 years (annual average change of BMI ≥0.3 kg/m2/yr) was related to an elevated PTC risk, and the association was more pronounced for large-sized PTC risks (<1 cm, OR, 2.34, 95% CI, 1.92–2.85; ≥1 cm, OR, 4.00, 95% CI, 2.91–5.49, P heterogeneity = 0.005) compared with low PTC risks.
Weight gain and annual increases in obesity indicators in middle-aged adults may increase the risk of developing PTC.
INTRODUCTION
The thyroid cancer incidence rate has increased markedly throughout the world in recent years, and most of that increase is accounted for by papillary thyroid cancer (PTC).1 Although the increased incidence of small-sized thyroid cancers may be related to medical practices and diagnostic imaging factors, increases in the incidence of large and advanced-stage tumors may be related to lifestyle and environmental factors.2,3 A parallel increase in the incidence of obesity has been associated with the increase in thyroid cancer;4 however, evidence to support this connection is limited. One previous study's results indicated that adult weight changes can contribute to the development of thyroid cancer,5 while another study reported no such association.6
The body mass index (BMI) at a certain age has been used as an indicator of obesity, and weight gain during adulthood reflects an accumulation of body fat.7 Because early and marked weight gain in young and middle-aged adults has been associated with a high risk of obesity-related diseases across all BMI categories,8 weight gain can be a specific surrogate marker of obesity, which can contribute to cancer development. Weight gain during adulthood has been linked to unfavorable fat distribution, reduced metabolic efficiency, and an increased risk of adiposity-related cancers.6 Under the assumption that maintaining a healthy weight through mid-life can be important for PTC prevention, increases in weight or BMI over the long term should considered when assessing PTC risk.
To investigate the association between weight change in middle-aged adults and PTC risk, we assessed the data obtained by the Thyroid Cancer Longitudinal Study (T-CALOS) undertaken in Korea.9 In our subjects, annual average changes in weight and obesity indicators (BMI, body surface area (BSA), and body fat percentage (BF%)) after the age of 35 years were examined as predictors of the total PTC incidence and the incidence of PTC with a tumor size ≥1 cm. Additionally, we performed subgroup analyses to assess potential effect modifiers such as age, menopausal status, BMI at enrollment, and exercise status.
METHODS
Study Subjects
The cases in our study (T-CALOS) included thyroid cancer patients who had undergone thyroidectomy at the Seoul National University Hospital (SNUH), Seoul National University Bundang Hospital (SNUBH), and National Medical Center (NMC) between 2010 and 2013. The 3 hospitals are general hospitals, and the subjects came from regions throughout the country. Our study initially enrolled 1576 patients with histologically confirmed PTC. However, because of missing body size and weight history data, 25 PTC patients were excluded. Thus, 1551 subjects (300 men and 1251 women) were included in our PTC case group. For our subgroup analysis of thyroid tumor diameter (<1 cm vs. ≥1 cm), 15 subjects without tumor size information were excluded. For our assessment of clinicopathological characteristics in men and women, PTC patients without information on lymph node metastasis (n = 116), TNM stage (n = 132), multifocality (n = 25), BRAF (V600E) mutation (n = 248), and chronic lymphocytic thyroiditis (n = 385) were excluded. The control group data were obtained from the Korean Health Examinees study (HEXA), a subset of subjects within the ongoing Korean Genome and Epidemiology Study.10 The HEXA enrolled subjects from at least 20 centers throughout the country in an effort to obtain a sample of the general population of Koreans aged between 40 and 70 years who participate in the national health screening program; thus, the source population of HEXA is the same as that of T-CALOS.
The principal protocols of T-CALOS and HEXA had the same design as followings: the standardized protocol for both T-CALOS and HEXA at enrollment included informed consent; an interview-based core questionnaire including demographic factors, medical history, lifestyle, dietary factors; and the collection of biospecimens, such as blood and urine. In addition to the principal protocol, the thyroid cancer patients underwent interviews to provide additional information, including their history of exposure to radiation and environmental toxicants. A further detailed description of the study (T-CALOS) was published previously.9
From the 173,422 HEXA subjects, we selected subjects without a history of thyroid disease (n = 156,844). Subjects without a weight history were excluded, leaving 124,297 subjects as potential control group members. After applying the greedy matching algorithm of the GMATCH macro for SAS software,11 we individually matched control subjects at a 1:10 ratio (3000 men and 12,510 women), based on age at enrollment and sex.
Data Collection
Current weight (kg) and height (m) were measured at enrollment, and the subjects’ self-reported weight at the age of 35 years was recorded. We aimed to define intuitive and meaningful cut-off values for annual average changes in obesity-related indicators in addition to a statistically significant threshold for the outcomes. Among the total subject group, we found the value of 0.8 kg/yr for the highest quartile of annual average weight change. The number was rounded to yield the cutoff, 1 kg/yr in decreased or increased weight, and was doubled to yield the highest cutoff value, 2 kg/yr. Weight changes since the age of 35 years were classified into one of the 4 groups (weight loss of 5 kg or more; stable weight, with changes of less than 5 kg; weight gain between 5.0 kg and 9.9 kg; and weight gain of 10 kg or more). Because older subjects may exhibit greater weight changes than younger subjects, age at enrollment may influence the total absolute weight difference; therefore, we calculated each subject's annual average weight change by dividing the total weight change by the difference between the age at enrollment and 35 years. This has been interpreted as reflecting a subject's weight trajectory after the age of 35 years.12,13 Annual average weight changes were classified into 4 groups (decreased weight of 1.0 kg/yr or more; stable weight, with changes of less than 1.0 kg/yr, increased weight between 1.0 kg/yr and 1.9 kg/yr; and increased weight of 2.0 kg/yr or more).
Each subject's BMI (kg/m2) was calculated by dividing weight by height squared, while the BSA (m2) was calculated using the equation: 0.007184 × height (cm)0.725 × weight (kg)0.425.14,15 Body fat percentage (BF%) was calculated using the equation: (1.20 × BMI) + (0.23 × age) − (10.8 × sex (1 for men and 0 for women)) − 5.40.16 These prediction formulas for BSA and BF were validated for effective physiological parameters in general16–20 and specifically in Koreans.21,22 Under the assumption that middle-aged adult height is maintained, height at enrollment was used to calculate the BMI, BSA, and BF% at age 35 years. For each of these obesity indicators (BMI, BSA, and BF%), we calculated annual average changes using the following equation: obesity indicator value at enrollment − obesity indicator value at age 35 years)/difference between enrollment age and age 35 years. For the annual average BMI change, the subjects were assigned to one of the 4 groups (a decrease in BMI of 0.1 kg/m2/yr or more; stable BMI, with changes of less than 0.1 kg/m2/yr; an increase in BMI between 0.1 and 0.2 kg/m2/yr; and an increase in BMI of 0.3 kg/m2/yr or more). The annual average BSA changes were assigned to one of the 4 groups (a decrease in BSA of 0.005 m2/yr or more; stable BSA, with changes of less than 0.005 m2/yr; an increase in BSA of between 0.005 and 0.009 m2/year; and an increase in BSA of 0.010 m2/yr or more), as were the annual average BF% changes (a decrease in BF% of 0.1% per year or more; a stable BF%, with changes of less than 0.1% per year; an increase in BF% of between 0.1% per year and 0.2% per year; and an increase in BF% of 0.3% per year or more). We defined the cutoffs for the 3 indicators, the annual average change in BMI, BSA, and BF%; however, we used the median value to ensure a minimum of 5 subjects and the statistical power of the study. For our analysis of the associations between these indicators and the PTC incidence, the group with a stable average annual change (changed <0.1 kg/m2/yr for BMI; changed <0.005 m2/yr for BSA; and changed <0.1% per year for BF%) was used as the reference group.
A standardized questionnaire with items on demographic, environmental, lifestyle, and health-related factors was used to collect comprehensive epidemiologic data for our analysis of possible confounding factors. The variables assessed were age, sex, education (high-school graduation: yes or no), marital status (single or married), regular exercise (yes or no), smoking (400 cigarettes during lifetime: yes or no), drinking alcohol (yes or no), history of chronic disease (ever diagnosed with diabetes, hypertension, or dyslipidemia by a medical doctor), pregnancy (ever or never), and menopausal status (pre- or postmenopausal). To assess the clinicopathological characteristics of the PTC patients, we used data from the subjects’ medical charts including histological type, age at thyroidectomy, tumor size, lymph node metastasis, tumor multifocality, BRAF mutation, and chronic lymphocytic thyroiditis. Thyroid tumor staging was based on the American Joint Committee on Cancer/Union Internationale Contre le Cancer TNM Classification of Malignant Tumours (TNM) criteria (7th Edition, 2009). Genetic testing, fasting blood sample collection, deoxyribonucleic acid (DNA) extraction, and BRAF (V600E) mutation analysis were conducted as previously described.9,23
Statistical Analysis
The general and clinicopathological characteristics of the subjects are summarized as the means and standard deviations (SDs) for continuous variables and as percentages (%) for categorical variables. The differences between men and women were tested using Student t or χ2 tests. Conditional logistic regression was used to estimate the odds ratios (ORs) and 95% confidence intervals (CIs) of the PTC risk associated with body size at enrollment, total weight change, and annual average change in each of the obesity indicators. The ORs were calculated with both unadjusted and multivariable-adjusted models, and the models’ estimates and trends were consistent. The variables for model adjustment included education level (high-school graduation: yes, no, or unknown), marital status (single, married, or unknown), regular exercise (yes, no, or unknown), history of chronic diseases (diabetes, hypertension, and dyslipidemia), and ever pregnant (yes, no, or unknown). Probability trends were calculated for category-based scores by assigning the category as a continuous variable. Stratified analyses were conducted by age, sex, BMI at age 35 years, menopausal status, and regular exercise status. To reduce the possibility of distorted effects from PTC that existed prior to a weight change, all analyses were conducted after excluding patients who were diagnosed before the age of 40 years, considering a latent PTC development period of 5 years. We calculated the P values for heterogeneity to test ORs in stratified groups. The P values for interaction were derived from multiplicative interaction using a cross-product term for each obesity indicator and the menopausal status in logistic regression models. The P values presented are 2 tailed, and a P < 0.05 was considered statistically significant. All analyses were conducted using SAS version 9.4 (SAS Institute, Cary, NC).
Ethical Review
The entire data collection process was conducted using standard operating procedures, which followed the Declaration of Helsinki. All subjects signed an informed consent form approved by the Institutional Review Board of the SNUH (IRB; IRB Number: 0809-097-258, 1001-067-307, and 1202-088-398).
RESULTS
General Characteristics
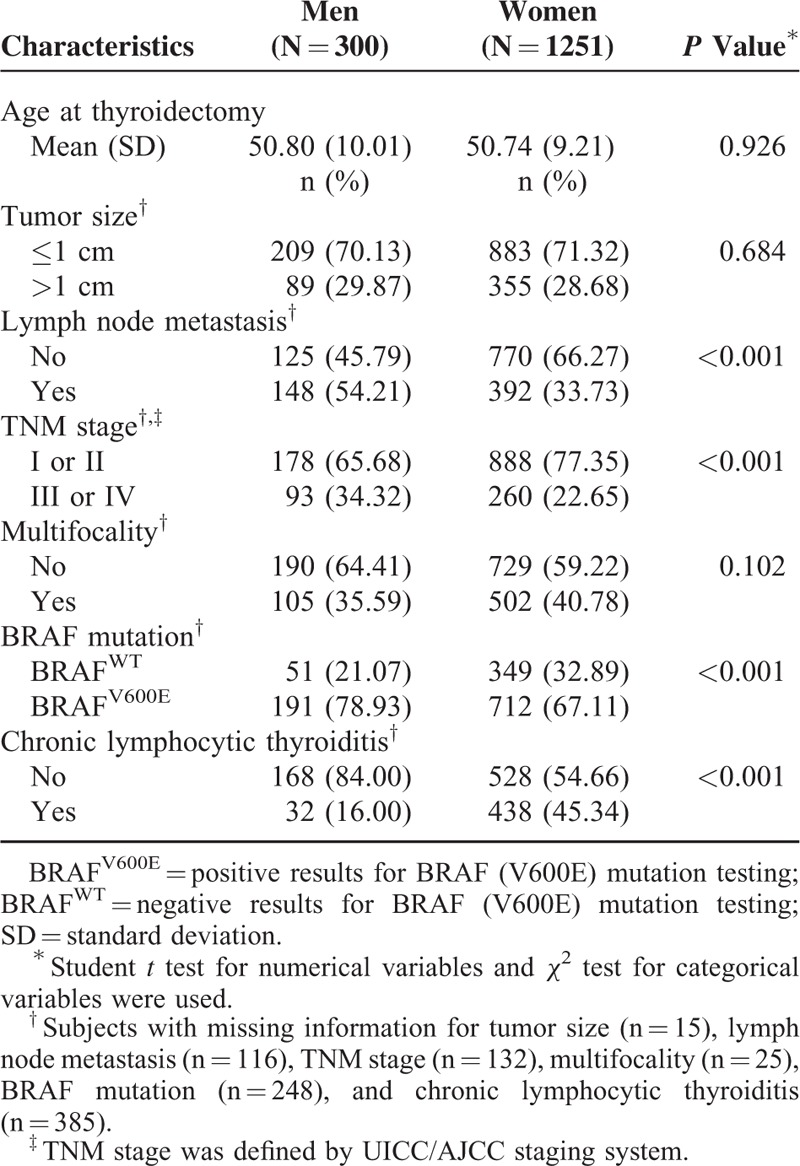
The subjects’ mean age at thyroidectomy and enrollment was 51 years (mean (SD): 50.80 (10.01) for men and 50.74 (9.21) for women; P = 0.93). Age group distributions (<45 years, 45–54 years, and ≥55 years) were consistent for cases and controls (men: 30.67%, 33.00%, and 36.33%; and women 29.66%, 37.65%, and 32.69%, respectively). Compared with the control group, the PTC case group had a higher proportion of subjects with an education level higher than high school graduation (cases vs. controls: 94.33 vs. 81.74% for men and 82.73% vs. 67.31% for women; both P < 0.05; Supplementary Table 1). Similarly, there was a significantly higher incidence of chronic diseases such as diabetes, hypertension, and dyslipidemia in the case group than in the control group (P < 0.05; Supplementary Table 1). Among the female subjects, the percentages that reported their marital status (married: 95.04% for cases and 97.25% for controls; P < 0.05), regular exercise status (yes: 41.92% for cases and 49.39% for controls; P < 0.05) and pregnancy status (ever: 93.51% for cases and 96.26% for controls; P < 0.05) are presented in Supplementary Table 1. There was no significant difference in ever smoking (men: 74.00% for cases and 73.02% for controls; women: 3.04% for cases and 3.97% for controls), ever drinking alcohol beverages (men: 83.67% for cases and 81.35% for controls; women: 34.13% for cases and 36.37 for controls), and menopausal status (postmenopausal: 52.33% for cases and 49.33% for controls) between the case and control groups (P > 0.10 for all comparisons). Compared with the female PTC patients, the male PTC patients were more likely to exhibit lymph node metastasis, BRAF mutation, chronic lymphocytic thyroiditis, and a higher TNM stage (III or IV; P < 0.05 for all comparisons; Table 1).
TABLE 1.
Clinicopathological Characteristics of 1551 Papillary Thyroid Cancer Patients With Thyroidectomy in Thyroid Cancer Longitudinal Study (T-CALOS), 2010 to 2013
Association of Obesity Indicators With PTC Risk
The multivariable-adjusted conditional logistic regression model results showed that height and weight at enrollment were significantly associated with PTC incidence (Table 2). The ORs for the association between height and PTC risk were 1.07 (95% CI, 1.04–1.09) for the men and 1.07 (95% CI, 1.06–1.08) for the women. For the weight and PTC risk association, the ORs were 1.03 (95% CI, 1.01–1.04) for the men and 1.01 (95% CI, 1.01–1.02) for the women (table not shown). Compared with subjects who maintained a stable total weight (<5 kg), the ORs for total weight gain since age 35 years in men were 2.01 (95% CI, 1.48–2.74) for those with a total weight gain of 5 to 9.9 kg and 5.39 (95% CI, 3.88–7.49) for those with a total weight gain ≥10 kg (P trend < 0.01). Similarly, the ORs for total weight gain since age 35 years in women were 1.68 (95% CI, 1.45–1.94) for those with a total weight gain of 5 to 9.9 kg and 3.36 (95% CI, 2.87–3.93) for those with a total weight gain of ≥10 kg (P trend <0.01), as Table 2 shows.
TABLE 2.
Changes in Height, Weight, and Obesity Indicators Since Age 35 Years and the Risk for Papillary Thyroid Cancer in the Thyroid Cancer Longitudinal Study (T-CALOS), 2010 to 2013
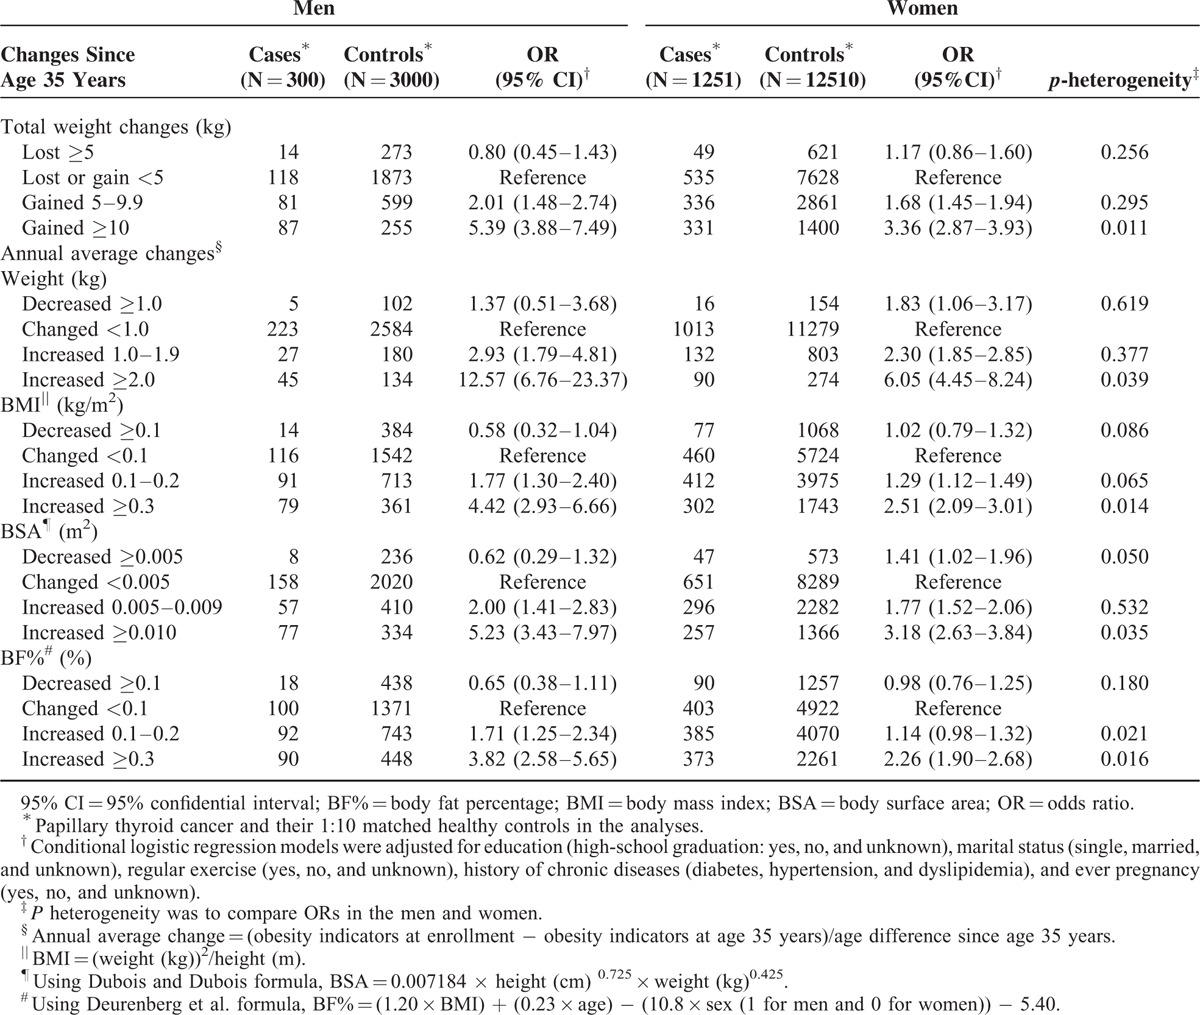
Table 2 also shows that compared with a stable weight, annual average increases in weight since age 35 years (increases of 1.0–1.9 kg/yr) were associated with an increased PTC risk in men (OR, 2.93, 95% CI, 1.79–4.81) and women (OR, 2.30, 95% CI, 1.85–2.85). The associations between weight increase and PTC risk were more pronounced when the annual average weight increase was equal to or greater than 2.0 kg/yr (men, OR, 12.57, 95% CI, 6.76–23.37; women, OR, 6.05, 95% CI, 4.45–8.24). Among the subjects with annual average increase in BMI > 0.3 kg/m2/yr, the PTC risk was elevated in both men (OR, 4.42, 95% CI, 2.93–6.66) and women (OR, 2.51, 95% CI, 2.09–3.01). There were similar trends in the associations between PTC risk and an annual average increase in BSA (increase ≥0.010 m2/yr) in men (OR, 5.23, 95% CI, 3.43–9.97) and women (OR, 3.18, 95% CI, 2.63–3.84) compared with those with a stable BSA and in BF% (increase ≥0.3% per year) in men (OR, 3.82, 95% CI, 2.58–5.65) and women (OR, 2.26, 95% CI, 1.90–2.68) compared with those with a stable BF%. In general, weight gain and increased obesity, including weight change (P heterogeneity = 0.011) and annual average change in obesity indicators (P heterogeneity <0.05), had a greater effect on PTC risk in men than in women.
Association of Obesity Indicators With Clinicopathological Aggressiveness
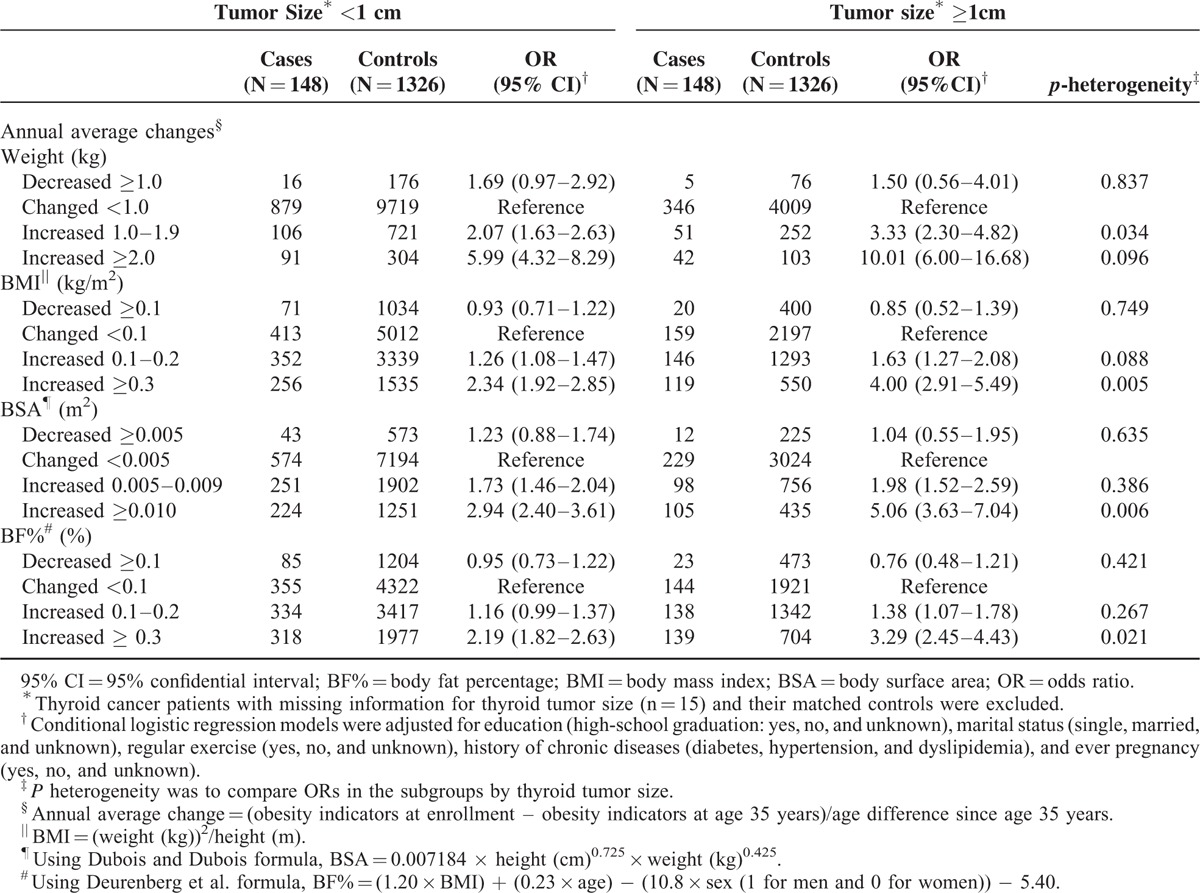
When stratified for thyroid tumor size, the effect of an increased annual average BMI (≥0.3 kg/m2/yr) for patients with large-sized PTC (tumors ≥1 cm) was greater than the effect for those with a relatively small tumor (tumor size ≥1 cm, OR, 4.00, 95% CI, 2.91–5.49; tumor size <1 cm, OR, 2.34, 95% CI, 1.92–2.85; P heterogeneity = 0.005; Table 3). The results for the annual average change in BSA and BF% were consistent (P heterogeneity <0.01), as Table 3 shows. We also investigated the association between the annual average change in obesity indicators and the PTC risk related to the clinicopathological features of lymph node metastasis, TNM stage, tumor multifocality, BRAF (V600E) mutation, and chronic lymphocytic thyroiditis; however, no significant difference in these associations was detected (data not shown).
TABLE 3.
Associations Between Changes in Weight and Obesity Indicators Since Age 35 Years and the Risk for Papillary Thyroid Cancer Stratified by Patients’ Tumor Size and Their Matched Controls in the Thyroid Cancer Longitudinal Study (T-CALOS), 2010 to 2013
Subgroup Analyses by Menopausal Status
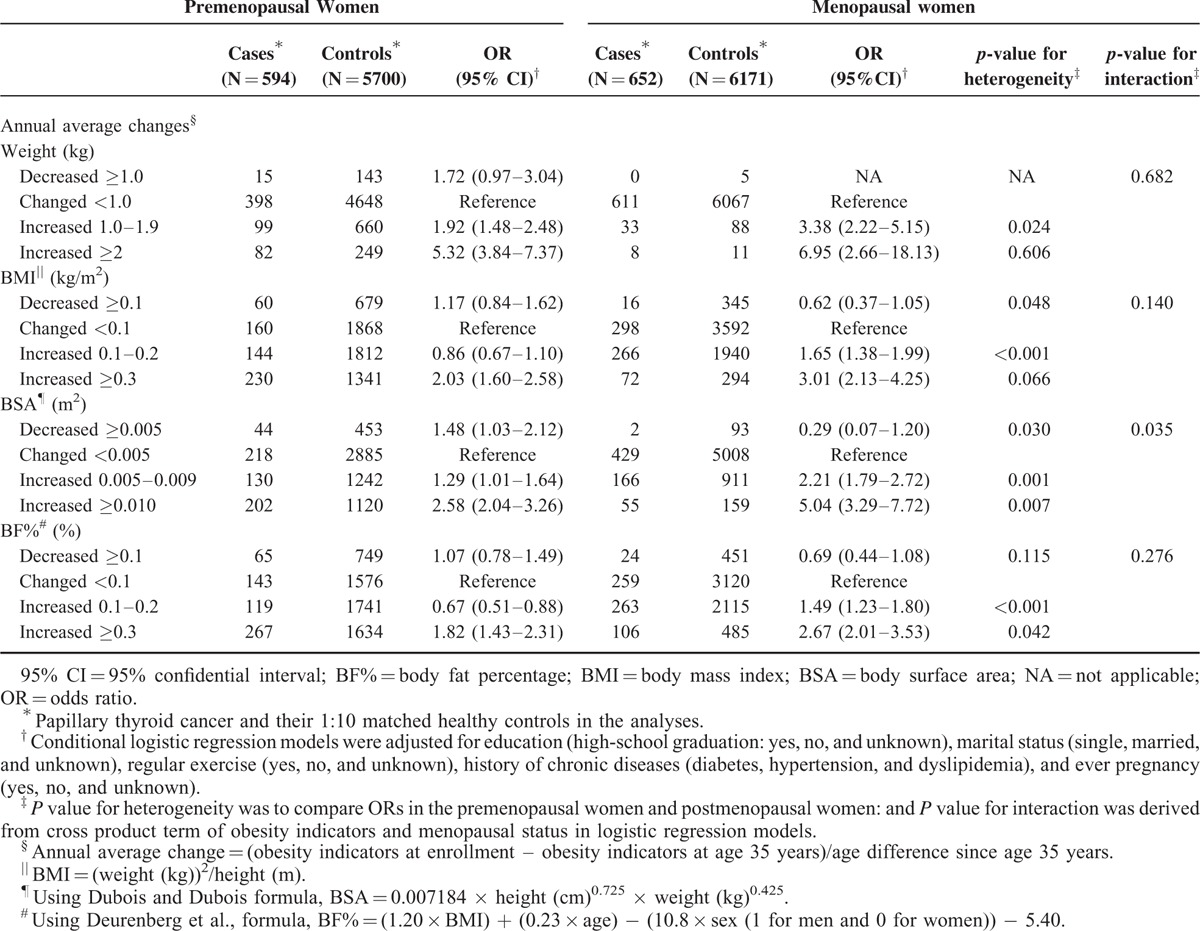
In Table 4, the associations between annual average BMI increases of 0.3 kg/m2 or greater and PTC risk in the women were estimated according to menopausal status (postmenopausal women, OR, 3.01, 95% CI, 2.13–4.25; premenopausal women, OR, 2.03, 95% CI, 1.60–2.58). We observed significant differences between the associations for the subgroups in terms of BSA (annual average increase ≥0.010: postmenopausal women, OR, 5.04, 95% CI, 3.29–7.72; premenopausal women, OR, 2.58, 95% CI, 2.04–3.26; P heterogeneity = 0.007) and BF% (annual average increase ≥0.3: postmenopausal women, OR, 1.82, 95% CI, 1.43–2.31; premenopausal women, OR, 2.67, 95% CI, 2.01–3.53; P heterogeneity = 0.042) compared with those who maintained stable obesity indicators. Menopausal status and annual average changes in BSA had significant interaction effects for the development of PTC (P value for interaction = 0.035). The results of our subgroup analyses by age group (<50 and ≥50 years), BMI at age 35 years (BMI <25 and ≥25 kg/m2), and exercise status (regular exercise: yes or no) consistently showed greater ORs for those whose obesity indicators increased compared with those who maintained stable obesity indicators (Supplementary Table 2). The magnitude of the association between the annual average change in BMI, BSA and BF% and PTC risk among those aged 50 years or older, the high BMI group (≥25 kg/m2), and the group without regular exercise were likely to be greater than the association for the younger age group (<50 years), the low BMI group (<25 kg/m2), and the group with regular exercise based on the P values for interaction (P value <0.05; Supplementary Tables 2, 3, and 4). These results were supported by the sensitivity analyses performed after excluding PTC cases diagnosed within 5 years of age 35 years (data not shown).
TABLE 4.
Associations Between Changes in Weight and Obesity Indicators Since Age 35 Years and the Risk for Papillary Thyroid Cancer Stratified by Menopausal Status in the Thyroid Cancer Longitudinal Study (T-CALOS), 2010 to 2013
DISCUSSION
This large-scale, 1:10 matched case-control study included 1551 PTC patients (300 men and 1251 women) and 15,510 healthy subjects (3000 men and 12,510 women). The results suggest that weight change in middle-aged adults is a significant risk factor for PTC risk in both men and women and that the risk is independent of age at PTC diagnosis, BMI at age 35 years, and other potential confounders, including lifestyle and health conditions related to chronic diseases. Compared with those who maintained their weight, the effects of weight and obesity indicators (BMI, BSA, and BF%) on PTC risk were greater in the subgroup with a tumor size greater than 1 cm. Additionally, a significant relationship between increased obesity and PTC risk was indicated in postmenopausal women.
Although obesity has been examined as a risk factor for thyroid cancer to a certain extent,24–26 few studies have included results regarding adult weight change over long-term period and PTC development.5,27–29 While a recent meta-analysis found that each 5-kg increase in adult weight gain was related to various cancers including breast, ovarian, colon, and kidney cancer,6 the impact of weight change during adulthood on elevated PTC risk has not been elucidated. Kitahara and colleagues assessed whether weight gains of more than 10 kg between the ages of 35 to 50 years could influence PTC development based on the NIH-AARP Diet and Health Study (NIH-AARP study) in the United States; however, the results were not statistically significant (men: hazard ratio (HR) 1.61, 95% CI, 0.91–2.43; women: HR, 0.83, 95% CI, 0.43–1.59).5 While Kabat et al.27 also found an insignificant association between weight gains of 50 lbs or more after the age of 18 years and PTC risk (HR, 1.09, 95% CI, 0.53–2.22) based on the Women's Health Initiative (WHI), the results were based on a study that included only postmenopausal women. One possible explanation for the insignificant associations in the previous studies is the different age distribution of the subjects. The more pronounced associations in our findings compared with previous results can be explained by our inclusion of younger study subjects (median age: 54 years for the men and 51 years for the women in our study; 63.8 years for men and 63.1 years for women in the NIH-AARP study,5 and 61.9 years for cases and 63.1 for noncases in the WHI study).27 Recruiting subjects who were more than 10 years older than the median age for thyroid cancer diagnosis (50-year old) at enrollment could lead to an underestimation of the actual effects of weight change on thyroid cancer risk because of information bias, such as memory decay regarding one's weight at age 35 years. Although the previous 2 studies had many strengths based on their prospective cohort study designs, it could be difficult to generalize the results to the general population (the NIH-AARP Diet and Health Study recruited members of the American Association of Retired Persons,5 and the WHI data included postmenopausal women).27 The insignificant difference may also indicate insufficient statistical power, as the samples included fewer than 200 PTC patients.28,29
An increased risk of thyroid cancer was observed among subjects who reported a “large” body shape at 35 to 40 years, based on the “lean” body shape as the reference, in a cohort of 91,909 French women (HR, 1.48, 95% CI, 1.10–1.99).30 The results were assessed according to self-evaluated body shape over the lifetime,30 which may account for the influence of weight at middle age on PTC development.
The potential mechanism underlying the interplay of weight gain and PTC risk has not been established. Inflammation, oxidative stress, adipokines, and a depressed immune system can be potential mechanisms and mediating pathways of the relationship between excess weight and thyroid cancer.24,31 In addition, a high prevalence of insulin resistance among thyroid cancer patients was demonstrated, from which we can hypothesize that thyroid tumorigenesis can be stimulated by insulin and insulin-like growth factor 1 (IFG-1).31,32 Elevated thyroid stimulating hormone (TSH) levels and unregulated thyroid function in obese subjects33 may accelerate PTC cells34 and interrelate with other growth factors35 and molecular alterations, such as BRAF mutations.36,37 Previous investigations have suggested that obesity is a potential inducer of PTC tall cell variants,38 changes in iodine uptakes, more frequent mutations in BRAF (V600E) genes, and the transformation of a normal phenotype to a malignant one in thyroid cells or more aggressive forms of PTC.38,39 More evidence is needed to determine the precise mechanisms of the link between weight change during adulthood and PTC risk, particularly regarding the risk of PTC with a more aggressive tumor presentation.
In general, we found stronger associations between weight change and PTC risk in men than in women. Although the difference was not statistically significant, the associations between weight change and thyroid cancer in previous studies were more pronounced in men.5,29 This sex difference may be due to hormone dimorphism, and differences in body fat distribution and related metabolic consequences.5,31 The rising prevalence of overweight and obesity has been more striking in males than in females in Korea,40 and the male PTC patients in our study presented more aggressive tumor features compared with the female patients, which may be 1 reason weight change had a more pronounced influence on the men than on the women. We observed different associations in the subgroups based on menopausal status. Menopause was related to total and abdominal adiposity,41 and different profiles of circulating estrogens and changed hormonal balances in sex steroids can promote cell differentiation and proliferation in thyroid tumors.31 Although there are inconsistent results regarding physical activity as an independent determinant of PTC,42–45 the reported inverse relationsships44,45 at least partially support the assumption that regular exercise can reduce the effects of weight gain on male PTC development. Further validation with longitudinal multicenter studies is warranted.
The first limitation of this study is the use of self-reported weight history information, which can introduce reporting errors and recall bias.46 Reasonably high correlations between self-reported information and direct measurements were reported during adulthood,47 and nondifferential misclassifications can affect the association toward the null.48 We tried to minimize the potential for recall bias by using standardized protocols, comprehensive questionnaires, and trained interviewers. The second limitation pertains to the likelihood of increased PTC detection in people who are obese, have chronic diseases, and undergo relatively more frequent health check-ups at clinics. Although we cannot completely exclude the possibility of detection bias, we observed consistent ORs even after controlling these factors. The third limitation is that the PTC cases and controls came from 2 cohort studies. However, the source population of both cohort studies was the same and was derived from regions throughout Korea, and the basic protocol was the same for both studies; therefore, any errors in measuring exposure are likely to be similar for cases and controls. Although we did not include the residential area as a matching variable because we used deidentified data without each subjects’ addresses, both the cases and controls came from regions throughout Korea. Finally, the lack of more detailed information about benign thyroid conditions, radiation exposure, and lifestyle variables could be a limitation, and may need to be considered as adjusting variables in multivariate models for the potential confounders.
Although there were inherent limitations related to the study's design and the results disagree with prior prospective literature, the first important strength of this study is its large number of thyroid cancer cases and matched controls. This large sample allowed us to conduct subgroup analyses for various indicators, such as age, sex, tumor size, and menopausal status, with the statistical power to determine associations. Second, while our study still contains potentially confounding residual issues, we aimed to collect comprehensive epidemiologic data based on a standardized protocol and clinicopathology information from reviews of the cases’ medical charts. Third, in addition to the absolute value of weight change, we suggest that annual average changes in individuals’ weight and obesity indicators can be considered potential indicators of PTC risk.
In summary, weight gain and an annual increase in obesity indicators in middle-aged adults have significant effects on PTC development. Our results indicate that the PTC risk increases with rapidly increased weight, BMI, BSA, and BF% compared with stable weight during the transition from middle-aged to late adulthood. In addition, the effects of increases in weight or obesity on the risk of developing PTC with a tumor size of 1 cm are evident, suggesting that environmental or nutritional factors, rather than improved screening strategies for small tumors, should be a focus. Postmenopausal women show increased PTC risks attributable to middle-aged weight gain, supporting the need for an intensive weight management. By considering modifiable aspects of weight change during adulthood, our results can provide important evidence for prioritizing the primary prevention of PTC in relation to weight gain and mid-life obesity.
Supplementary Material
Acknowledgments
We thank all of the participants, investigators, and staff members from the Thyroid Cancer Longitudinal Study (T-CALOS). The dataset was from the Korean Genome and Epidemiology Study (KoGES) of the Korea Centers for Disease Control and Prevention, Republic of Korea.
Footnotes
Abbreviations: 95%CI = confidence interval, BF% = body fat percentage, BMI = body mass index, BSA = body surface area, DNA = deoxyribonucleic acid, HEXA study = Korean Health Examinee study, HR = hazard ratio, IFG-1 = insulin-like growth factor 1, IRB = Institutional Review Board, KoGES = Korean Genome and Epidemiology Study, NMC = National Medical Center, OR = odds ratio, PTC = papillary thyroid cancer, SD = standard deviation, SNUBH = Seoul National University Bundang Hospital, SNUH = Seoul National University Hospital, T-CALOS = Thyroid Cancer Longitudinal Study, TNM = TNM Classification of Malignant Tumours, TSH = thyroid stimulating hormone.
This study was conducted with research grant from the Korean Foundation for Cancer Research (Grant Number: CB-2011-03-01), the Basic Research Laboratory program through the National Research Foundation of Korea funded by the Ministry of Education, Science and Technology (Grant Number: 2011-0001564), and the Education and Research Encouragement Fund of Seoul National University Hospital and the Brain Korea 21 PLUS Program.
The authors have no conflicts of interest to disclose.
REFERENCES
- 1.Kilfoy BA, Zheng T, Holford TR, et al. International patterns and trends in thyroid cancer incidence, 1973–2002. Cancer Causes Control 2009; 20:525–531. [DOI] [PMC free article] [PubMed] [Google Scholar]
- 2.Enewold L, Zhu K, Ron E, et al. Rising thyroid cancer incidence in the United States by demographic and tumor characteristics, 1980-2005. Cancer Epidemiol Biomarkers Prev 2009; 18:784–791. [DOI] [PMC free article] [PubMed] [Google Scholar]
- 3.Tufano RP, Noureldine SI, Angelos P. Incidental thyroid nodules and thyroid cancer: considerations before determining management. JAMA Otolaryngol Head Neck Surg 2015; 141:566–572. [DOI] [PubMed] [Google Scholar]
- 4.Pazaitou-Panayiotou K, Polyzos SA, Mantzoros CS. Obesity and thyroid cancer: epidemiologic associations and underlying mechanisms. Obes Rev 2013; 14:1006–1022. [DOI] [PubMed] [Google Scholar]
- 5.Kitahara CM, Platz EA, Park Y, et al. Body fat distribution, weight change during adulthood, and thyroid cancer risk in the NIH-AARP Diet and Health Study. Int J Cancer 2012; 130:1411–1419. [DOI] [PMC free article] [PubMed] [Google Scholar]
- 6.Keum N, Greenwood DC, Lee DH, et al. Adult weight gain and adiposity-related cancers: a dose-response meta-analysis of prospective observational studies. J Natl Cancer Inst 2015; 107: [DOI] [PubMed] [Google Scholar]
- 7.Willett WC, Dietz WH, Colditz GA. Guidelines for healthy weight. N Engl J Med 1999; 341:427–434. [DOI] [PubMed] [Google Scholar]
- 8.Malhotra R, Ostbye T, Riley CM, et al. Young adult weight trajectories through midlife by body mass category. Obesity (Silver Spring) 2013; 21:1923–1934. [DOI] [PubMed] [Google Scholar]
- 9.Lee KE, Park YJ, Cho B, et al. Protocol of a thyroid cancer longitudinal study (T-CALOS): a prospective, clinical and epidemiological study in Korea. BMJ Open 2015; 5:e007234. [DOI] [PMC free article] [PubMed] [Google Scholar]
- 10.Health Examinees Study Group. The Health Examinees (HEXA) study: rationale, study design and baseline characteristics. Asian Pac J Cancer Prev 2015; 16:1591–1597. [DOI] [PubMed] [Google Scholar]
- 11.Kosanke J, Bergstralh E. %GMATCH macro by Jon L. Kosanke and Erik E. Bergstralh. 2004. Available at: http://www.mayo.edu/research/documents/gmatchsas/doc-10027248 Accessed April 19, 2015. [Google Scholar]
- 12.Aleksandrova K, Pischon T, Buijsse B, et al. Adult weight change and risk of colorectal cancer in the European Prospective Investigation into Cancer and Nutrition. Eur J Cancer 2013; 49:3526–3536. [DOI] [PubMed] [Google Scholar]
- 13.Resnick HE, Valsania P, Halter JB, et al. Relation of weight gain and weight loss on subsequent diabetes risk in overweight adults. J Epidemiol Community Health 2000; 54:596–602. [DOI] [PMC free article] [PubMed] [Google Scholar]
- 14.Du Bois D, Du Bois EF. A formula to estimate the approximate surface area if height and weight be known. Nutrition (Burbank) 1989; 5:303–311. [PubMed] [Google Scholar]
- 15.Du BD, Du BE. Clinical calorimetry: tenth paper a formula to estimate the approximate surface area if height and weight be known. Arch Internal Med 1916; XVII:863–871. [Google Scholar]
- 16.Deurenberg P, Weststrate JA, Seidell JC. Body mass index as a measure of body fatness: age- and sex-specific prediction formulas. Br J Nutr 1991; 65:105–114. [DOI] [PubMed] [Google Scholar]
- 17.Verbraecken J, Van de Heyning P, De Backer W, et al. Body surface area in normal-weight, overweight, and obese adults. A comparison study. Metabolism Clin Exp 2006; 55:515–524. [DOI] [PubMed] [Google Scholar]
- 18.Sardinha LB, Silva AM, Minderico CS, et al. Effect of body surface area calculations on body fat estimates in non-obese and obese subjects. Physiol Meas 2006; 27:1197–1209. [DOI] [PubMed] [Google Scholar]
- 19.Yu CY, Lo YH, Chiou WK. The 3D scanner for measuring body surface area: a simplified calculation in the Chinese adult. Appl Ergon 2003; 34:273–278. [DOI] [PubMed] [Google Scholar]
- 20.Liu X, Sun Q, Sun L, et al. The development and validation of new equations for estimating body fat percentage among Chinese men and women. Br J Nutr 2015; 113:1365–1372. [DOI] [PubMed] [Google Scholar]
- 21.Hyun-Soo K. Validation study of body composition evaluation in obese subjects (Korean). J Korean Soc Living Environ Syst 2009; 16:110–116. [Google Scholar]
- 22.Lee JY, Choi JW, Kim H. Determination of body surface area and formulas to estimate body surface area using the alginate method. J Physiol Anthropol 2008; 27:71–82. [DOI] [PubMed] [Google Scholar]
- 23.Kim SJ, Lee KE, Myong JP, et al. BRAF V600E mutation is associated with tumor aggressiveness in papillary thyroid cancer. World J Surg 2012; 36:310–317. [DOI] [PubMed] [Google Scholar]
- 24.Marcello MA, Cunha LL, Batista FA, et al. Obesity and thyroid cancer. Endocr Relat Cancer 2014; 21:T255–271. [DOI] [PubMed] [Google Scholar]
- 25.Ma J, Huang M, Wang L, et al. Obesity and risk of thyroid cancer: evidence from a meta-analysis of 21 observational studies. Med Sci Monit 2015; 21:283–291. [DOI] [PMC free article] [PubMed] [Google Scholar]
- 26.Renehan AG, Tyson M, Egger M, et al. Body-mass index and incidence of cancer: a systematic review and meta-analysis of prospective observational studies. Lancet 2008; 371:569–578. [DOI] [PubMed] [Google Scholar]
- 27.Kabat GC, Kim MY, Thomson CA, et al. Anthropometric factors and physical activity and risk of thyroid cancer in postmenopausal women. Cancer Causes Control 2012; 23:421–430. [DOI] [PubMed] [Google Scholar]
- 28.Iribarren C, Haselkorn T, Tekawa IS, et al. Cohort study of thyroid cancer in a San Francisco Bay area population. Int J Cancer 2001; 93:745–750. [DOI] [PubMed] [Google Scholar]
- 29.Suzuki T, Matsuo K, Hasegawa Y, et al. Anthropometric factors at age 20 years and risk of thyroid cancer. Cancer Causes Control 2008; 19:1233–1242. [DOI] [PubMed] [Google Scholar]
- 30.Clavel-Chapelon F, Guillas G, Tondeur L, et al. Risk of differentiated thyroid cancer in relation to adult weight, height and body shape over life: the French E3N cohort. Int J Cancer 2010; 126:2984–2990. [DOI] [PubMed] [Google Scholar]
- 31.Pappa T, Alevizaki M. Obesity and thyroid cancer: a clinical update. Thyroid 2014; 24:190–199. [DOI] [PubMed] [Google Scholar]
- 32.Rezzonico JN, Rezzonico M, Pusiol E, et al. Increased prevalence of insulin resistance in patients with differentiated thyroid carcinoma. Metab Syndr Relat Disord 2009; 7:375–380. [DOI] [PubMed] [Google Scholar]
- 33.Fox CS, Pencina MJ, D’Agostino RB, et al. Relations of thyroid function to body weight: cross-sectional and longitudinal observations in a community-based sample. Arch Intern Med 2008; 168:587–592. [DOI] [PubMed] [Google Scholar]
- 34.Cho YA, Kong SY, Shin A, et al. Biomarkers of thyroid function and autoimmunity for predicting high-risk groups of thyroid cancer: a nested case-control study. BMC Cancer 2014; 14:873. [DOI] [PMC free article] [PubMed] [Google Scholar]
- 35.Takada K, Amino N, Tada H, et al. Relationship between proliferation and cell cycle-dependent Ca2+ influx induced by a combination of thyrotropin and insulin-like growth factor-I in rat thyroid cells. J Clin Investig 1990; 86:1548–1555. [DOI] [PMC free article] [PubMed] [Google Scholar]
- 36.Kleiman DA, Buitrago D, Crowley MJ, et al. Thyroid stimulating hormone increases iodine uptake by thyroid cancer cells during BRAF silencing. J Surg Res 2013; 182:85–93. [DOI] [PMC free article] [PubMed] [Google Scholar]
- 37.Xing M. Molecular pathogenesis and mechanisms of thyroid cancer. Nat Rev Cancer 2013; 13:184–199. [DOI] [PMC free article] [PubMed] [Google Scholar]
- 38.Harari A, Endo B, Nishimoto S, et al. Risk of advanced papillary thyroid cancer in obese patients. Arch Surg 2012; 147:805–811. [DOI] [PubMed] [Google Scholar]
- 39.Kim SH, Park HS, Kim KH, et al. Correlation between obesity and clinicopathological factors in patients with papillary thyroid cancer. Surg Today 2015; 45:723–729. [DOI] [PubMed] [Google Scholar]
- 40.Kang HT, Shim JY, Lee HR, et al. Trends in prevalence of overweight and obesity in Korean adults, 1998–2009: the Korean National Health and Nutrition Examination Survey. J Epidemiol 2014; 24:109–116. [DOI] [PMC free article] [PubMed] [Google Scholar]
- 41.Toth MJ, Tchernof A, Sites CK, et al. Effect of menopausal status on body composition and abdominal fat distribution. Int J Obes Relat Metab Disord 2000; 24:226–231. [DOI] [PubMed] [Google Scholar]
- 42.Leitzmann MF, Brenner A, Moore SC, et al. Prospective study of body mass index, physical activity and thyroid cancer. Int J Cancer 2010; 126:2947–2956. [DOI] [PMC free article] [PubMed] [Google Scholar]
- 43.Kitahara CM, Platz EA, Beane Freeman LE, et al. Physical activity, diabetes, and thyroid cancer risk: a pooled analysis of five prospective studies. Cancer Causes Control 2012. [DOI] [PMC free article] [PubMed] [Google Scholar]
- 44.Cash SW, Ma H, Horn-Ross PL, et al. Recreational physical activity and risk of papillary thyroid cancer among women in the California Teachers Study. Cancer Epidemiol 2013; 37:46–53. [DOI] [PMC free article] [PubMed] [Google Scholar]
- 45.Rossing MA, Remler R, Voigt LF, et al. Recreational physical activity and risk of papillary thyroid cancer (United States). Cancer Causes Control 2001; 12:881–885. [DOI] [PubMed] [Google Scholar]
- 46.Rothman KJ. BMI-related errors in the measurement of obesity. Int J Obes 2008; 32 Suppl 3:S56–S59. [DOI] [PubMed] [Google Scholar]
- 47.Casey VA, Dwyer JT, Berkey CS, et al. Long-term memory of body weight and past weight satisfaction: a longitudinal follow-up study. Am J Clin Nutr 1991; 53:1493–1498. [DOI] [PubMed] [Google Scholar]
- 48.Dosemeci M, Wacholder S, Lubin JH. Does nondifferential misclassification of exposure always bias a true effect toward the null value? Am J Epidemiol 1990; 132:746–748. [DOI] [PubMed] [Google Scholar]
Associated Data
This section collects any data citations, data availability statements, or supplementary materials included in this article.