

A three-dimensional cell culture model of syncytiotrophoblasts recapitulates their secretory, morphological, and microbial resistance phenotypes.
Keywords: Placenta, trophoblast, Toxoplasma gondii, RWV bioreactor, 3-D cell culture
Abstract
In eutherians, the placenta acts as a barrier and conduit at the maternal-fetal interface. Syncytiotrophoblasts, the multinucleated cells that cover the placental villous tree surfaces of the human placenta, are directly bathed in maternal blood and are formed by the fusion of progenitor cytotrophoblasts that underlie them. Despite their crucial role in fetal protection, many of the events that govern trophoblast fusion and protection from microbial infection are unknown. We describe a three-dimensional (3D)–based culture model using human JEG-3 trophoblast cells that develop syncytiotrophoblast phenotypes when cocultured with human microvascular endothelial cells. JEG-3 cells cultured in this system exhibit enhanced fusogenic activity and morphological and secretory activities strikingly similar to those of primary human syncytiotrophoblasts. RNASeq analyses extend the observed functional similarities to the transcriptome, where we observed significant overlap between syncytiotrophoblast-specific genes and 3D JEG-3 cultures. Furthermore, JEG-3 cells cultured in 3D are resistant to infection by viruses and Toxoplasma gondii, which mimics the high resistance of syncytiotrophoblasts to microbial infections in vivo. Given that this system is genetically manipulatable, it provides a new platform to dissect the mechanisms involved in syncytiotrophoblast development and microbial resistance.
INTRODUCTION
The placenta serves a diverse range of essential functions during pregnancy, including mediating the exchange of gases, nutrients, and waste products between the mother and fetus; producing hormones; and acting as a physical and immunological barrier between the maternal and fetal compartments. The human hemochorial placenta is composed primarily of specialized cells known as trophoblasts. Covering the placental villous tree surfaces and in direct contact with the maternal blood are syncytiotrophoblasts, which are multinucleated, terminally differentiated cells. Syncytiotrophoblasts are highly polarized and are covered by dense microvilli at their apical surfaces, which allows for a large surface area for gas, nutrient, and waste exchange. Progenitor cytotrophoblasts, which are mononuclear and proliferative, underlie the syncytiotrophoblast layer and fuse to form a syncytium to replenish the syncytiotrophoblast layer throughout pregnancy. In vivo, the fusion of cytotrophoblasts is subjected to tight regulation, which is supported by the near-constant 1:9 ratio of cytotrophoblasts to syncytiotrophoblasts that is maintained throughout pregnancy (1, 2).
The processes and/or stimuli that induce cytotrophoblast fusion are largely unknown. The human endogenous retrovirus envelope protein HERV-W, commonly referred to as syncytin, is responsible for the physical fusion of cytotrophoblasts into syncytiotrophoblasts (3). However, despite the expression of syncytin and other factors associated with trophoblast fusion, common trophoblast cell lines including BeWo, JAR, and JEG-3 cells exhibit little to no spontaneous syncytia formation (4–6), suggesting that other factors are involved in this process. In some cases, such as in BeWo cells, fusion can be induced by enhancing cyclic adenosine monophosphate (cAMP) signaling by treatment of cells with agents such as forskolin (4) or 8-bromo-cAMP (7). However, the requirement for agents such as forskolin and 8-bromo-cAMP, which undoubtedly induce myriad pleiotropic effects, has limited our understanding of many basic events that govern trophoblast fusion and function. In addition, although the development of primary cell–based methods to study trophoblast function has been used successfully to model a variety of aspects of trophoblast biology (8), the lack of a cell line–based system that more closely models syncytiotrophoblast development and function in vitro has limited our understanding of many basic events that govern the biology of these specialized cells.
The culturing of many cell types in three dimensions (3D) has provided an excellent model system to mimic the morphological and/or functional features of cells and tissues in vivo. The rotating wall vessel (RWV) bioreactor, initially designed by NASA to recapitulate aspects of the quiescent microgravity environment, has emerged as a convenient method to culture cells in 3D (9–11). The RWV bioreactor is a rotating cylindrical bioreactor that attaches to slow-turning lateral vessels (STLVs), which are completely filled with cell culture medium and contain cells attached to porous, extracellular matrix–coated dextran beads (or other scaffolds) (9). This culture system induces physiological levels of fluid shear stress (12), which, in combination with excellent mass transfer, is optimal for cell growth and differentiation by virtue of its solid body rotation, which prevents cell/bead sedimentation. Under these conditions, cells grown in 3D aggregate based on natural cellular affinities and differentiate into 3D organotypic models of human tissues that mimic key features of the parental tissue in vivo [reviewed by Barrila et al. (11)].
We used the RWV bioreactor to develop a 3D-based cell coculture model that induces high levels of spontaneous fusion of a trophoblast cell line, JEG-3 cells. JEG-3 cells cultured in this system exhibit high rates of syncytia formation, which correlates to increased brush border formation and secretion of placental hormones. In addition, on the basis of RNASeq transcriptome analyses, 3D cultures of JEG-3 cells have a transcriptional profile with more significant similarity to primary human syncytiotrophoblasts than their 2D cultured counterparts, which includes a number of genes expressed exclusively in syncytiotrophoblasts. Additionally, we show that similar to primary cultures of syncytiotrophoblasts, JEG-3 cells grown in 3D become resistant to infection by viruses and Toxoplasma gondii, a major source of congenital infections worldwide. Our work thus provides a new platform to model the fusion of cytotrophoblasts into syncytiotrophoblasts and their intrinsic resistance to pathogen infection.
RESULTS
Monotypic cell cultures of trophoblast cell lines are not compatible with the RWV bioreactor
Consistent with the previous work of others (4–6), we found that trophoblast cell lines including BeWo, JAR, and JEG-3 (which are all derived from human choriocarcinomas) exhibited very low (to undetectable) rates of spontaneous fusion (fig. S1A). In BeWo cells, we found that treatment with 8-bromo-cAMP, a synthetic analog of cAMP, enhanced the formation of syncytia (fig. S1A). However, the rate of syncytia formation in BeWo cells treated with 8-bromo-cAMP was significantly lower than that observed in primary human trophoblast (PHT) cells, derived from term placentas, which undergo spontaneous syncytia formation to form large syncytia (fig. S1, A and B).
3D cell culture techniques using the RWV bioreactor have resulted in the development of a number of cell systems that more accurately reflect the properties of their parental tissues in vivo (11). We attempted to establish RWV bioreactor culture conditions using BeWo, JAR, JEG-3, and HTR8/SVneo cells, a first-trimester extravillous trophoblast (EVT) cell line immortalized with SV40 (simian virus 40) large T antigen (schematic, Fig. 1A) (13). In all cases, we found that trophoblast cells inefficiently attached to the porous collagen-coated dextran beads (Cytodex) within the STLVs, and either did not attach to the beads at all (HTR8/SVneo or BeWo cells) or attached with very low efficiency and exhibited a greater tendency to aggregate between beads (JAR and JEG-3), as observed by fluorescence microscopy for actin or cytokeratin-19 (Fig. 1B and fig. S1, C to E) and scanning electron microscopy (SEM; Fig. 1B and fig. S1C). When JEG-3 cells were incubated with Cytodex beads in static 2D culture conditions, they exhibited high levels of attachment (fig. S1F), suggesting that the fluid shear induced by culturing in the RWV bioreactor was not compatible with trophoblast monotypic cultures.
Fig. 1. Coculturing of human trophoblast JEG-3 cells with human microvascular cells promotes their ability to be cultured in 3D.
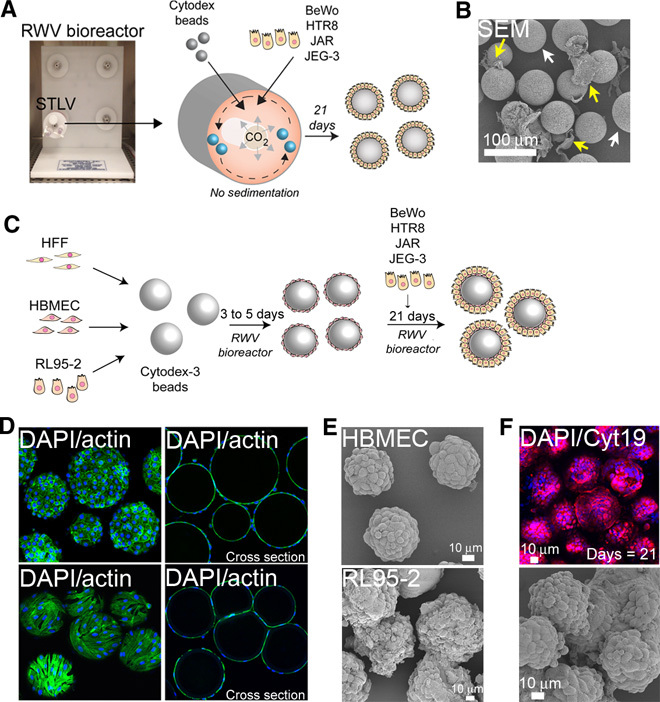
(A) Schematic for the monotypic culturing of trophoblast cell lines in the RWV bioreactor. (B) Scanning electron micrograph of JEG-3 cells cultured in the RWV bioreactor for 21 days. Yellow arrows denote uncoated beads and white arrows denote unattached cells. (C) Schematic of the 3D coculture-based system of trophoblast cell lines using the RWV bioreactor. (D) Actin localization (green) of human brain microvascular endothelial cells (HBMECs) (top row) and human foreskin fibroblast (HFF) cells (bottom row) cultured in the RWV bioreactor for 5 days. 4′,6-Diamidino-2-phenylindole (DAPI)–stained nuclei are shown in blue. Cross section of beads is shown on the right. (E) Scanning electron micrographs of HBMECs (top) or RL95-2 cells cultured in the RWV bioreactor for 21 days. (F) (Top) Confocal microscopy for cytokeratin-19 (red) in JEG-3/HBMEC cocultured Cytodex beads cultured for 21 days. (Bottom) Scanning electron micrograph of JEG-3/HBMEC cocultured Cytodex beads cultured for 21 days.
Human trophoblast JEG-3 cells grow in 3D when cocultured with microvascular cells
Trophoblast cells in vivo establish a number of direct and/or indirect associations with nontrophoblast cell types. Because we were unsuccessful in establishing 3D culture conditions for all four trophoblast cell lines tested, we next attempted to establish a coculture-based 3D cell system based on cell types that have features with physiological relevance to the placenta in vivo (schematic, Fig. 1C). To establish this system, we used primary HFF cells to model placental fibroblasts, HBMECs to model the fetal and maternal microvasculature, and RL95-2 cells to model the maternal endometrium. These cell types were used in STLVs to first coat Cytodex beads for 3 to 5 days before the addition of trophoblast cell lines. We found that HFF, HBMEC, and RL95-2 cells all associated with Cytodex beads and uniformly coated the beads after 3 to 5 days of culturing on the RWV bioreactor (Fig. 1, D and E). After the initial monotypic culturing with HFF, HBMEC, or RL95-2 cells/beads, we next added BeWo, HTR8/SVneo, JAR, or JEG-3 cells to establish cocultures in the STLVs and continued culturing them on the RWV bioreactor for an additional 21 days. All four trophoblast cell lines were unable to establish long-term associations with HFF-coated beads, and the addition of the trophoblast cells led to the disassociation of the HFF cells from the beads (fig. S2, A and B). Likewise, we found that RL95-2–coated beads were not capable of associating with trophoblast cells and the coculturing of these cells with trophoblast cells induced the disassociation of the RL95-2 cells from the beads (fig. S2C). However, unlike HFF or RL95-2 cells, we found that HBMECs provided an excellent cell matrix for JEG-3 cells, which associated with HBMEC-coated beads within 3 days following their coculture initiation and went on to uniformly coat beads by ~10 days after coculture (Fig. 1F and fig. S2D). However, this association was specific for JEG-3 cells, as neither BeWo, JAR, nor HTR8/SVneo cells established any long-term associations with HBMEC-coated beads (fig. S2E).
Because JEG-3 cells exhibited a strong attachment to HBMEC-coated beads, we further characterized this cell culture condition. We found that within 10 days after coculture, beads were largely coated with JEG-3 cells (as determined by the percentage of cytokeratin-19–positive cells relative to actin, fig. S3A). Because cytokeratin-19 is an epithelial-specific cytokeratin, it was used to easily distinguish between JEG-3 cells (which are cytokeratin-19–positive) and HBMECs (which are cytokeratin-19–negative). Remarkably, rather than attaching to the apical surfaces of the HBMECs, JEG-3 cells induced the dissociation of HBMECs from beads (fig. S3, C and D). In monotypic HBMEC cultures devoid of JEG-3 cells, HBMECs remained associated with Cytodex beads throughout the culture period (>21 days) (fig. S3B). At the end of the coculture period (~21 days), beads were primarily coated (~75%) with JEG-3 cells and formed a single layer of cells coating the beads (fig. S3E) as assessed by immunofluorescence microscopy for cytokeratin-19 relative to actin fluorescence (Fig. 1F and fig. S3A).
JEG-3 cells grown in 3D express syncytiotrophoblast-associated markers
To determine whether culturing of JEG-3 cells in 3D altered their differentiation, we measured the levels of βhCG released from JEG-3 cells cultured in 2D or in the HBMEC 3D coculture system described above, and compared these values to the levels released from PHT cells. We found that JEG-3 cells cultured in 2D released low levels of βhCG (1.53 ± 2.64 mIU/ml), whereas cells cultured in 3D released significantly higher levels (158.6 ± 95.6 mIU/ml), which were even higher than the levels detected in PHT cells (36.0 ± 26.2 mIU/ml) (Fig. 2A). The levels of βhCG released from JEG-3 cells cultured in 3D increased significantly after 6 days in culture and continued to rise throughout the culture period of 21 days (fig. S4A). This effect was specific for JEG-3/HBMEC coculture conditions as coculturing of BeWo cells with HBMEC or JEG-3 cells with RL95-2 cells did not induce an increase in βhCG (fig. S4B).
Fig. 2. 3D cultures of JEG-3 cells express syncytiotrophoblast-specific markers and fuse to form syncytia.
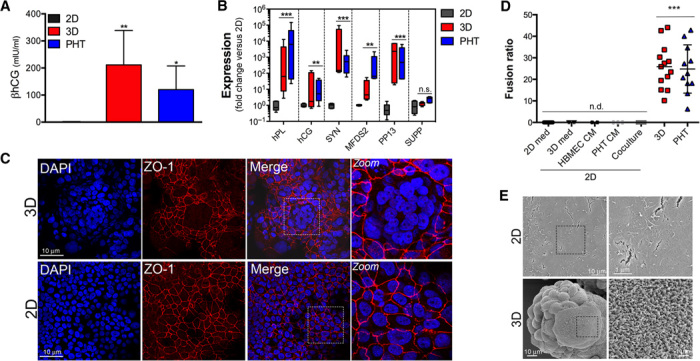
(A) Enzyme-linked immunosorbent assays (ELISAs) for βhCG from supernatants of JEG-3 cells cultured in 2D (gray for 72 to 96 hours) or 3D (red for 21 days) or from PHT cells (blue, cultured ~72 hours). In all cases, medium was changed 24 hours before collection for ELISA. Levels of βhCG are presented as milli–international units per milliliter and were normalized to total protein from each cell condition to account for differences in cell number. Data are shown as means ± SD. **P < 0.01, *P < 0.05. (B) Reverse transcription quantitative polymerase chain reaction (RT-qPCR) for human placental lactogen (hPL), hCG, syncytin, MFDS2, or placental protein 13 (PP13) from JEG-3 cells cultured in 2D (gray) or 3D (red) or from PHT cells (blue). Data are from three independent STLVs or PHT preparations, as indicated, and are shown as means ± SD. ***P < 0.001, **P < 0.01. n.s., not significant. (C) Confocal microscopy for ZO-1 (red) in JEG-3/HBMEC cocultured Cytodex beads cultured for 21 days (top row) or 2D cultures of JEG-3 cells (bottom row). DAPI-stained nuclei are shown in blue. (D) Fusion ratio of JEG-3 cells cultured in 2D and treated with the indicated conditioned medium (CM) for 7 to 10 days, from JEG-3 cells cultured in 3D, or from PHT cells. n.d., not detected. ***P < 0.001. (E) Scanning electron micrographs of JEG-3 cells cultured in 2D (top row) or 3D (bottom row).
Because we found that 3D cultures of JEG-3 cells exhibited enhanced βhCG release, we next profiled the expression of a number of markers of placental differentiation between cells cultured in 2D and 3D, and in PHT cells. Using RT-qPCR, we profiled the levels of hPL, PP13, syncytin, and the syncytin-2 receptor MFSD2, all of which exhibit specific expression in syncytiotrophoblasts (3, 14–16) and βhCG. In all cases, JEG-3 cells cultured in 3D expressed higher levels of βhCG, hPL, syncytin, PP13, and MFSD2, compared to 2D cultures, which were comparable to those in PHT cells (Fig. 2B). The levels of hPL increased throughout the 3D culture period, with levels increasing significantly between 10 and 21 days (fig. S4C). By immunofluorescence microscopy, syncytin expression was markedly higher in 3D cultures compared to 2D cultures and localized to cell-cell contacts, with minimal localization directly to the apical surface (fig. S5C). In contrast, other trophoblast-specific components, such as suppressyn, which inhibits syncytia formation (17), exhibited similar levels of expression between 2D and 3D cultures of JEG-3 cells, and in PHT cells (Fig. 2B).
JEG-3 cells grown in 3D form syncytia and develop brush borders
A hallmark of syncytiotrophoblasts is their multinuclear morphology. Remarkably, we found that JEG-3 cells cultured in 3D exhibited high rates of spontaneous fusion, with 25 to 50% of total nuclei in multinucleated cells (Fig. 2, C and D), which were similar to those observed in PHT cells (Fig. 2D). In some cases, the syncytia were quite large (>20 μm) and covered the majority of an individual bead (fig. S5A). Syncytia formation did not occur when JEG-3 cells were cocultured with HBMECs in 2D, or when JEG-3 cells in 2D were exposed to conditioned medium from JEG-3/HBMECs cocultured in STLVs, HBMECs cultured in STLVs, or PHT cells for up to 14 days (Fig. 2D and fig. S5B), suggesting that the rotation of the cells in the STLV was required for their differentiation.
The apical surfaces of syncytiotrophoblasts consist of a dense covering of microvilli. We found that 2D cultures of JEG-3 cells expressed little to no detectable ezrin [a member of the ezrin/radixin/moesin (ERM) family that localizes to microvilli], whereas JEG-3 cells cultured in 3D exhibited a pronounced enhancement of ezrin fluorescence at their apical surfaces (fig. S5D). We noted that the expression of ezrin as assessed by immunofluorescence was greatest in multinucleated cells, consistent with the formation of a brush border (fig. S5D). These results were confirmed by SEM, which showed that JEG-3 cells cultured in 2D develop only sporadic microvilli, whereas JEG-3 cells cultured in 3D, and forming syncytia, exhibited a dense brush border with microvilli of ~0.5 to 0.75 μm (Fig. 2E). In addition, unlike PHT cells, which exhibit very low efficiency of small interfering RNA (siRNA) transfection (18), we found that JEG-3 cells cultured in 3D could be efficiently transfected with siRNAs, albeit to lower overall levels than those observed in 2D cultures, and that we could efficiently silence the expression of trophoblast-specific markers ASCT2 (the syncytin receptor) and suppressyn (fig. S5F).
3D cultures of JEG-3 cells have transcriptional profiles with significant similarity to primary syncytiotrophoblasts
To further explore the similarities between JEG-3 cells cultured in 3D and primary syncytiotrophoblasts, we performed RNASeq analyses of monotypic cultures of JEG-3 cells grown in 2D, independent STLVs of JEG-3 cells cocultured with HBMECs in 3D, and PHT cells (Fig. 3A and data set S1). In addition, because JEG-3 cells cultured in 3D are cultured in the presence of HBMECs, which may remain to some degree at the end of the culture period, we also performed RNASeq analyses of monotypic cultures of HBMECs grown in 3D (Fig. 3A and data set S1). We observed significant changes in gene expression between JEG-3 cells cultured in 3D compared to monotypic 2D cultures (Fig. 3A and data set S2), although many of these genes were also similarly regulated between 2D JEG-3 and 3D HBMEC cultures (Fig. 3A and data set S3). To remove genes that were differentially expressed in 2D and 3D JEG-3 cultures and that might result directly from the presence of HBMECs, we used Gene Set Enrichment Analysis (GSEA) (19) followed by PTM (20). To do this, we first identified 2409 genes that were of significantly different abundance (P < 0.001; fold difference ≥ 2) between 2D JEG-3 cells and PHT cells (Fig. 3B and data set S4). We then created two custom gene sets for use in GSEA: 903 genes down-regulated in 2D JEG-3 compared to PHT cells and 1456 genes up-regulated in PHT cells compared to 2D JEG-3 cultures (PHT-enriched library) (Fig. 3B). We reasoned that genes enriched in PHT cells relative to 2D JEG-3 cultures (PHT-enriched library) thus represented genes enriched in syncytiotrophoblasts and/or that might be involved in placental function in vivo. We therefore used the PHT-enriched library gene set to compare the expression of these genes between 2D and 3D cultures of JEG-3 cells using GSEA. Using this approach, we identified a highly significant [family-wise error rate (FWER) = 0] enrichment of PHT-enriched genes in 3D cultures of JEG-3 cells (fig. S6, A and B). From this GSEA, we extracted “core enrichment genes” (left of the arrow in fig. S6A and right of the arrow in fig. S6B) and clustered them along with RNASeq data from 3D HBMECs using Euclidian distance (using MeViewer software) (21, 22). Within the core enrichment gene set, we identified a cluster of 13 genes that were up-regulated in both 3D JEG-3 and PHT cells, while being low in both 2D JEG-3 cells and 3D HBMECs (table S1). To identify other genes with a similar expression profile, we used the average expression level of these 13 genes as a template for PTM (20), an algorithm [implemented in MeViewer (22)] that identifies genes with similar transcriptional profiles across multiple samples. Using a P value cutoff of <0.01, we identified 55 genes with transcriptional profiles consistent with their unique expression in PHT cells and 3D JEG-3 cultures (Fig. 3C and table S2). Several of these genes are specific to syncytiotrophoblasts, such as PSG1 and PSG5 (23), which were among the top five genes specific to 3D JEG-3 cultures and PHT cells (Fig. 3C). A subset of genes identified by our GSEA including CDKN1C, S100A9, CST6, PSG1, and PSG5 were chosen for further validation using RT-qPCR, which confirmed our RNASeq studies (Fig. 3D). Together, these results suggest that in addition to the physical similarities between 3D JEG-3 cells and PHT cells, they also share important transcriptional profiles.
Fig. 3. 3D cultures of JEG-3 cells have transcriptional profiles with similarity to cultured primary human trophoblasts.
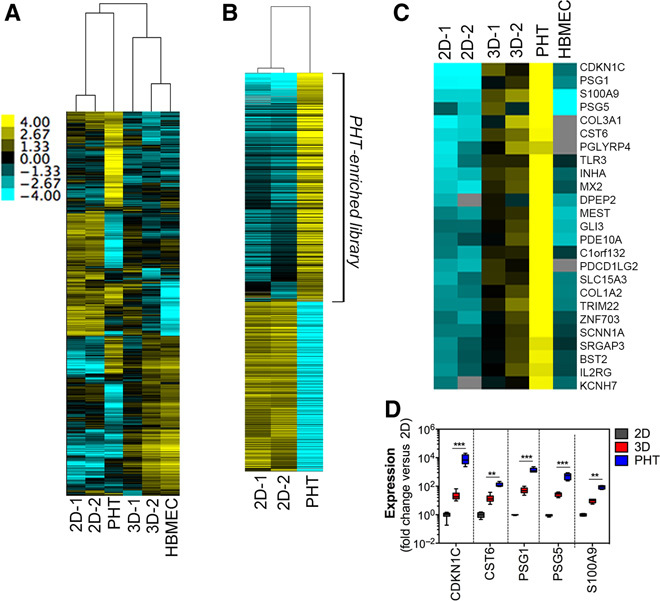
(A) Hierarchical clustering heat map of genes expressed in two cultures of JEG-3 cells grown in 2D or 3D and a single preparation of PHT cells or HBMECs cultured in 3D. (B) Hierarchical clustering heat map of differentially expressed genes between two cultures of JEG-3 cells grown in 2D and PHT cells. Genes that were specifically up-regulated in PHT cells were used to create the “PHT-enriched library” used to identify the genes in (C). (C) Hierarchical clustering heat map of 55 genes specifically expressed in 3D JEG-3 cultures and PHT cells (and not in 2D JEG-3 cells or 3D HBMECs) after GSEA and Pavlidis template matching (PTM). The color intensity in (A) to (C) indicates the level of gene expression (yellow for up-regulation and blue for down-regulation), and gray indicates that no RNASeq reads were detected for that transcript in that sample. (D) RT-qPCR analysis of 2D JEG-3 (gray), 3D STLV (red), or PHT (blue) preparations for cyclin-dependent kinase inhibitor 1C/Kip2 (CDKN1C), Cystatin-M (CST6), pregnancy-specific glycoprotein 1 (PSG1), PSG5, and S100 calcium-binding protein A9 (S100A9). Data are from three independent STLVs or PHT preparations, as indicated, and are shown as means ± SD. ***P < 0.001, **P < 0.01.
PHT cells and JEG-3 cells cultured in 3D resist virus and T. gondii infection
Syncytiotrophoblasts form a major barrier to pathogen infiltration into the fetal compartment. We have shown previously that PHT cells are highly resistant to infection by diverse viruses, including vesicular stomatitis virus (VSV) (24). Because we found that JEG-3 cells cultured in 3D formed syncytia and exhibited many of the characteristics of primary syncytiotrophoblasts, we next determined whether this system could be used to model syncytiotrophoblast susceptibility to viral infections. We found that similar to PHT cells, 3D cultures of JEG-3 cells were highly resistant to infection by VSV (Fig. 4A), suggesting that this culture condition can be used to model the high resistance of syncytiotrophoblasts to viral infections.
Fig. 4. 3D cultures of JEG-3 cells resists viral and T. gondii infection.
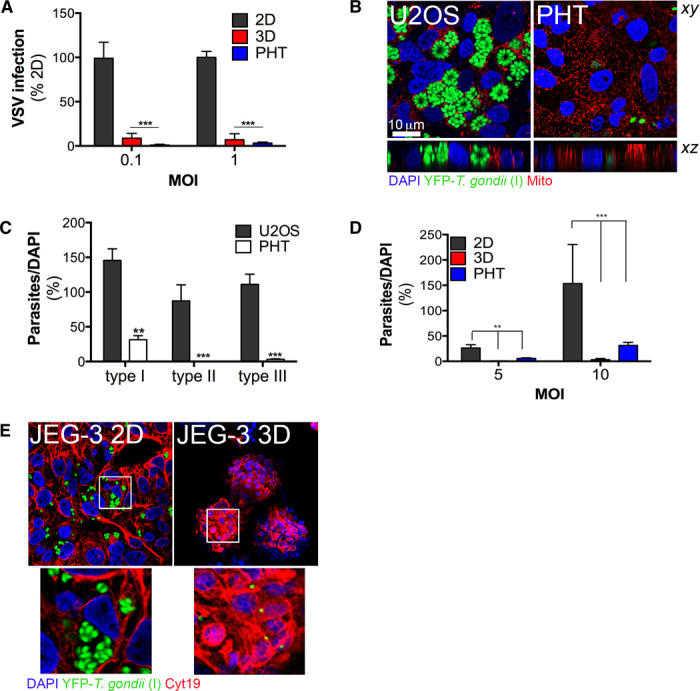
(A) RT-qPCR analyses of viral RNA from 2D or 3D cultures of JEG-3 cells, and PHT cells, infected with either 0.1 or 1 particle-forming unit (PFU) per cell of VSV. Data are shown as percentage of infection normalized to 2D control cultures. Data are shown as means ± SD. ***P < 0.001. (B) Confocal microscopy for YFP–T. gondii (strain I, RH) and mitochondria (red) 48 hours following infection [multiplicity of infection (MOI) = 5] in U2OS or PHT cells. (Top) xy image. (Bottom) xz cross section. (C) Infection of T. gondii [type I (RH), type II (ME49B7), or type III (CEP)] ~48 hours following infection (MOI = 5) of U2OS or PHT cells. Data are shown as means ± SD. ***P < 0.001, **P < 0.01. (D) Infection of T. gondii (strain I, RH) ~48 hours following infection of JEG-3 cells grown in 2D (gray) and 3D (red) or in PHT cells (blue) at either MOI = 5 or MOI = 10. Data are shown as means ± SD. ***P < 0.001, **P < 0.01. (E) Confocal microscopy for YFP–T. gondii (strain I, RH) and mitochondria (red) 48 hours following infection (MOI = 1) in JEG-3 cells grown in 2D (left) or 3D (right). The white box denotes the zoomed area shown at the bottom. For the infections shown in (A) and (B), beads were removed from the STLV and infected immediately in 24-well plates for ~24 hours.
Little is known regarding the mechanisms by which T. gondii accesses the fetal compartment, but EVTs are thought to be the primary portal for parasite invasion during the first trimester (25), suggesting that syncytiotrophoblasts form an effective barrier against parasite invasion into the fetal compartment. First, given that few studies have investigated the infectivity of primary syncytiotrophoblasts to T. gondii, we determined whether PHT cells, which represent syncytiotrophoblasts from term placentas, were susceptible to T. gondii infection. Consistent with previous work in a first-trimester placental model (25), we found that PHT cells were resistant to three genetically distinct strains of T. gondii when compared to other cell types including human osteosarcoma U2OS cells (Fig. 4, B and C) and 2D cultures of JEG-3 cells (Fig. 4D). Similarly, we found that JEG-3 cells cultured in 3D were resistant to T. gondii infection even at high MOIs (Fig. 4, D and E). 2D cultures of JEG-3 cells were susceptible to infection (Fig. 4, C and D). Together, these findings show that the 3D culturing of JEG-3 cells recapitulates a key property of syncytiotrophoblasts—their resistance to microbial infection.
DISCUSSION
Despite their essential role in sustaining human pregnancy, surprisingly little is known regarding the signals and pathways that control syncytiotrophoblast formation. Here, we show that the trophoblast JEG-3 cell line recapitulates the morphological and secretory phenotypes associated with primary syncytiotrophoblasts when cocultured in 3D with microvascular endothelial cells. In addition, we show that this coculture system recapitulates the in vivo ability of syncytiotrophoblasts to resist microbial infections. Thus, this system can be used as an effective model of human syncytiotrophoblasts in vitro.
It is likely that multiple pathways exist to tightly regulate cytotrophoblast fusion. In the 3D system described here, one key pathway may be the physiological levels of shear stress initiated in the RWV bioreactor. Once the maternal microvasculature has been established, the intervillous space becomes filled with maternal blood, thus subjecting the placental villous tree surfaces to shear forces via maternal blood flow from the spiral arteries. Whether the shear forces induced in the RWV bioreactor mimic those of the placenta in vivo is difficult to discern experimentally given the nature of this system. Previous work using non–cell-associated beads of various sizes in the RWV bioreactor indicated that the maximum levels of shear were developed at the bead surfaces, with a maximum of 5.2 dynes/cm2 (12). Because the precise levels of shear stress at the apical surfaces of syncytiotrophoblasts in vivo have not been quantified, we do not know if these values are equivalent in the bioreactor. However, we found that rotation of JEG-3–coated beads within STLVs attached to the bioreactor was required to induce syncytia formation, suggesting that the shear forces associated with this rotation may initiate specific pathways that stimulate physiologically relevant changes in trophoblast cells. Although we cannot exclude that there are factors secreted by the HBMECs in a paracrine manner to initiate the fusion of JEG-3 in 3D, treatment of JEG-3 cells in 2D with conditioned medium from HBMECs and coculturing of HBMECs and JEG-3 cells in 2D did not induce syncytia formation, suggesting that this is unlikely to be the primary mechanism involved in the fusion of JEG-3 cells cultured in 3D.
First isolated from a choriocarcinoma (26, 27), JEG-3 cells are largely classified as maintaining an EVT-like phenotype, given their invasive nature and their expression of HLA-G (28). Consistent with this, unlike BeWo cells, JEG-3 cells do not undergo fusion in response to forskolin or 8-bromo-cAMP treatment. Our data show that JEG-3 cells cultured in 3D can undergo cell fusion to form syncytia, which correlates with secretory and transcriptome changes that resemble those of PHT cells. Thus, although JEG-3 cells cultured in 2D have provided a useful model of EVTs, our data show that in the 3D system described here, they can undergo differentiation to form syncytia and thus also form a model of syncytiotrophoblasts. In addition, given that JEG-3 cells are more invasive in nature than other trophoblast cell lines such as BeWo and JAR cells, these cells may have an intrinsic ability to attach to and directly remodel the HBMEC layer, thus providing them with an advantage over the other trophoblast cell lines, which were unsuccessful in our system. This is consistent with our findings that HBMECs used to initially cover the Cytodex beads are removed by JEG-3 cells over the period of coculturing. However, highly invasive extravillous HTR8/SVneo cells did not attach or invade the HBMECs used to coat the beads, suggesting that there may be other factors that facilitate the success of the JEG-3 cells in the system we describe.
Remarkably, in addition to the enhanced fusogenic activity of JEG-3 cells cultured in 3D, we observed alterations in gene expression between JEG-3 cells grown in 2D versus 3D that were shared with many genes differentially expressed between 2D cultures of JEG-3 cells and PHT cells. In addition to the enhanced expression of a number of syncytiotrophoblast-enriched factors that we identified by RT-qPCR analyses, RNASeq studies pointed to a number of other differentially regulated genes and pathways that become activated by culturing cells in 3D. However, some differences in gene expression between JEG-3 and PHTs might be attributed to the differences in their genetic backgrounds. Notably, we found that the expression of CDKN1C was one of the most differentially up-regulated transcripts in JEG-3 cells grown in 3D compared to those grown in 2D. In addition, CDKN1C was the most differentially up-regulated gene between 2D JEG-3 cultures and PHT cells. The expression of CDKN1C is largely restricted to the placenta (29) where it regulates trophoblast differentiation (30). In addition, we found that PSG1 and PSG5 were the second and fourth most differentially expressed genes between 2D and 3D cultures of JEG-3 cells, respectively. PSGs are exclusively produced by syncytiotrophoblasts and are the most abundant fetal proteins present in the maternal bloodstream in late pregnancy (23). Together, our transcriptome analyses confirmed that in addition to the functional properties of cell fusion shared between 3D cultures of JEG-3 cells and PHT cells, 3D JEG-3 cell cultures also mimic many of the transcriptional profiles of PHT cells.
Despite its association with congenital infections, very little is known regarding how T. gondii gains entry into the fetal compartment. Studies in first-trimester explants indicate that syncytiotrophoblasts resist T. gondii infection (25). Our studies now show that primary syncytiotrophoblasts from term placentas also form a bottleneck to T. gondii access to the fetal compartment. Additionally, we show that JEG-3 cells cultured in 2D are susceptible to viral and T. gondii infections, whereas cells grown in 3D become resistant to infection, similar to PHT cells. These findings not only substantiate the use of the 3D JEG-3 culture system as a model of primary syncytiotrophoblasts but also point to their use as a model cell system to study host-pathogen interactions at the maternal-fetal interface.
MATERIALS AND METHODS
Cell culture and virus infections
For standard cell culturing, JAR and HTR8/SVneo cells were cultured in RPMI 1640 supplemented with 10% fetal bovine serum (FBS) and penicillin/streptomycin, RL95-2 cells were cultured in Dulbecco’s modified Eagle’s medium/Nutrient Mixture F-12 supplemented with 10% FBS and penicillin/streptomycin, JEG-3 cells were cultured in modified Eagle’s medium supplement with 10% FBS and penicillin/streptomycin, and BeWo cells were cultured as described previously (31). HBMECs were propagated as described previously (32).
2D and 3D cultures of the indicated cell lines were cultured in GTSF-2 medium (Hyclone) supplemented with 10% FBS (Invitrogen), insulin–transferrin–sodium selenite (Sigma), sodium bicarbonate, penicillin/streptomycin, and fungizone (Invitrogen) at 37°C in 5% CO2. PHTs were isolated and cultured as described previously (8, 33, 34). Infections with VSV were performed at 0.1 and 1 PFU per cell as described previously (24). For infections of cells grown in 3D, beads were removed from the STLV and infected immediately in 24-well plates for the duration of the infection period. For calculations of cell number, beads were removed from the STLV, washed with phosphate-buffered saline (PBS), and incubated with 0.05% trypsin-EDTA to remove cells from beads; cells were enumerated using a Bio-Rad TC20 automated cell counter.
RWV bioreactor cultures
For 3D cell cultures composed of a single cell type, cells cultured as described above were harvested in 0.05% trypsin-EDTA and incubated with ~300 mg of collagen-coated Cytodex-3 beads (Sigma) at either 4 × 10⁶ (HBMEC) or 6 × 10⁶ (HFF, JEG-3, BeWo, JAR, HTR8/SVneo, RL95-2) cells per 300 mg of beads. After a brief static incubation (~30 min) at 37°C, the bead/cell slurry was added to autoclavable 55-ml STLVs and attached to a rotating base (Synthecon) at 19 to 21 rpm to maintain the cells in suspension for the duration of the culture period (~21 days). For HBMEC, HFF, or RL95-2 trophoblast cell cocultures, Cytodex-3 collagen-coated beads were seeded with the indicated cell type as described above and grown in the RWV bioreactor for 3 to 5 days before the addition of trophoblast cells. At this time, 6 × 10⁶ cells of the indicated trophoblast cell line were added directly to the STLV, incubated without rotation at 37°C for ~30 min, and then rotated in a RWV bioreactor (Synthecon) at 19 to 20 rpm for the duration of the culture period (21 days). In both monotypic and coculture models, medium (GTSF-2 described above) was replenished every 24 to 48 hours for the duration of the culture period.
Reverse transcription quantitative polymerase chain reaction
For cellular mRNA analysis, total RNA was extracted using a GenElute Mammalian Total RNA Miniprep Kit (Sigma) according to the manufacturer’s protocol. RNA samples were treated with ribonuclease (RNase)–free deoxyribonuclease (DNase) (Sigma) and reverse-transcribed using an iScript cDNA Synthesis Kit (Bio-Rad). For each sample, 500 ng to 1 μg of total RNA were used for cDNA (complementary DNA) synthesis. RT-qPCR was performed using iQ SYBR Green Supermix (Bio-Rad) in an Applied Biosystems StepOne real-time PCR machine. Gene expression was calculated using a modified ΔCT method based on normalization to human cytokeratin-19. Oligonucleotide primers against cytokeratin-19, βhCG, hPL, and syncytin were ordered from Sigma, and primers against MFSD2 were ordered from IDT. Primer sequences are as follows: cytokeratin-19 (5′-AACCATGAGGAGGAAATCAG-3′; 5′-CATGACCTCATATTGGCTTC-3′), hCG-β (5′-CTTCCAGGACTCCTCTTC-3′; 5′-TTTTTGCGGATTGAGAAGC-3′), hPL (5′-CTATCACCTCCTAAAGGACC-3′; 5′-TTGTGTCAAACTTGCTGTAG-3′), syncytin (5′-ATGGAGCCCAAGATGCAG-3′; 5′-AGATCGTGGGCTAGCAG-3′), MFSD2 (5′-CTCCTGGCCATCATGCTCTC-3′; 5′-GGCCACCAAGATGAGAAA-3′), PP13 (5′-GACACCAATCCACTCTTTTATC-3′; 5′-CTCCTCCAACATCCATATCC-3′), suppressyn (5′-TCCGGGTTCCAACCAATGCAAGA-3′; 5′-TGTGCCAGTAGGCGAGATCAGT-3′), CDKN1C (5′-TCTGATCTCCGATTTCTTCG-3′; 5′-CTCTTTGGGCTCTAAATTGG-3′), CST6 (5′-CTCCTCTCAGCTCCTAAAG-3′; 5′-TTTATTGTGACAGATACGGC-3′), PSG1 (5′-AGCTGCCCATCCCCTACAT-3′; 5′-GGCTCTGACCGTTTAGCCA-3′), PSG5 (5′-CTGGAACCTGCCTATCACTGC-3′; 5′-TGGTAGAGGTCCATCAGTTGTC-3′), and S100A9 (5′-GGTCATAGAACACATCATGGAGG-3′, 5′-GGCCTGGCTTATGGTGGTG-3′). RT-qPCR was performed from at least three independent preparations of PHT cells and three independent STLVs.
RNASeq
Total RNA was extracted using a GenElute Mammalian Total RNA Miniprep Kit (Sigma) according to the manufacturer’s protocol. RNA samples were treated with RNase-free DNase (Sigma), and quality control was determined using a Qubit assay and an Agilent 2100 Bioanalyzer, as per each manufacturer’s specifications. Sample amounts were normalized and 1000 ng was used for library preparation using the NEB Ultra RNA Library Preparation Kit as per the manufacturer’s instructions. Library QC and quantitation were performed on all individual libraries using the Qubit assay and the Agilent 2100 Bioanalyzer. Libraries were normalized and pooled via Qubit measurement. The final pool was quantitated via qPCR. Sequencing was performed on the Illumina HiSeq 2500 Rapid Run Mode on one flowcell (two lanes) as per the system manufacturer. Raw RNASeq data were processed, normalized, and mapped to the human reference genome (hg19) using CLC Genomics Workbench 8 (Qiagen). Differentially expressed genes were identified using DESeq2 (35) with a significance cutoff of 0.001. Hierarchical clustering was performed using Cluster 3.0/Java TreeView.
Data filtering, gene set enrichment analysis, and PTM
GSEA v2.2.0 (14) was used for the described analyses. Custom gene sets were created by creating multicolumn gmx files and uploading them into GSEA. We removed all genes with sequence read counts of 0 across all queried samples, leaving 25,292 genes. We used GSEA to compare the JEG-3 transcriptional profiles (2D versus 3D) to custom gene sets that were up-regulated or down-regulated in PHT cells compared to 2D JEG-3. Default parameters were used except for the following: permutations (1000) were performed on the gene set rather than on the sample, and “collapse by probeset” was set to FALSE. Gene sets were deemed significantly enriched if the FWER was <0.01 (14).
To identify genes in an unbiased way across multiple samples that had specific expression profiles (for example, high in 3D JEG-3 and PHTs and low in all other samples), we used PTM (15) as implemented in MeViewer software (17) using default settings.
Antibodies
Rabbit or mouse monoclonal antibodies directed against cytokeratin-19 and syncytin were purchased from Abcam. Rabbit and mouse antibodies directed against ZO-1 were purchased from Invitrogen. Mouse anti-Ezrin was purchased from Millipore. Alexa Fluor–conjugated secondary antibodies and phalloidin were purchased from Invitrogen.
Enzyme-linked immunosorbent assays
For hormone secretion analyses, cell culture supernatants were collected and ELISAs for human β chorionic gonadotropin (Abnova) were performed according to the manufacturer’s protocol. Levels of βhCG were normalized to total protein to account for differences in cell numbers between the different culture conditions and/or cell types.
Small interfering RNAs
The sequences of the siRNAs used in the study are as follows: ASCT2_1, CCGGUCCUGUACCGUCCUCA; ASCT2_2, UCGCUCAUACUCUACCACCUA; and suppressyn, CCCGCGGCAUUUCCAUUCCUUUAUA. Cy3-conjugated scrambled control siRNA was purchased from Ambion.
Immunofluorescence and electron microscopy
Cells cultured in chamber slides, as well as Cytodex bead-cell complexes cultured in the RWV bioreactor, were washed and fixed with 4% paraformaldehyde. Cells were then permeabilized with 0.25% Triton X-100 in PBS and incubated with the indicated primary antibodies for 1 to 2 hours at room temperature. Following washing, cells were incubated with secondary antibodies for 30 min at room temperature, washed, and mounted with Vectashield (Vector Laboratories) containing DAPI. Images were captured using an FV1000 confocal laser microscope (Olympus). Images were merged and adjusted for brightness/contrast using Adobe Photoshop (Adobe). Image analysis was performed using ImageJ or Imaris (Bitplane). For SEM, cells cultured on glass coverslips or Cytodex bead-cell complexes cultured in the RWV bioreactor were washed and fixed with 2.5% glutaraldehyde.
The ratio of cell fusion was determined by performing immunofluorescence microscopy (as described above) for DAPI-stained nuclei and the tight junction–associated protein ZO-1 or cytokeratin-19 to define cell-cell borders. Cells with more than three nuclei within a continuous ZO-1 or cytokeratin-19–positive cell border were defined as forming a syncytia. Analyses were performed from at least three randomly selected fields from a total of >500 cells. For analyses of PHT cells, images were quantified from at least three unique cell preparations. The number of syncytia-associated nuclei and the total number of nuclei were quantified (using Imaris), and the relative fusion index was calculated (number of nuclei in syncytia/total number of nuclei × 100).
For SEM, beads were fixed in 2.5% glutaraldehyde for ~1 hour, washed with 1× PBS, and then postfixed in aqueous 1% OsO4 for 1 hour. After washing samples in PBS, they were dehydrated through a graded ethanol series (30 to 100%) and washed with absolute ethanol before they were dried in hexamethyldisilazane solution and allowed to air dry. Beads were then picked up with double-sided copper tape and mounted onto aluminum stubs, sputter-coated with 6 nm of gold/palladium (Cressington Auto 108), and viewed in a JEOL JSM-6335F scanning electron microscope at 3 kV with the SEI detector.
T. gondii propagation and infections
T. gondii tachyzoites of type I [RH yellow fluorescent protein (YFP) (36)], type II [ME49B7 green fluorescent protein (GFP) (37)], and type III [CEP GFP (38)] were used for all infections. In all strains, parasites constitutively expressed GFP (types II and III) or YFP (type I) and were maintained by serial passage in confluent HFF monolayers as described previously (37). For infections, parasites were collected and the indicated cells were infected at the indicated MOIs for 48 hours. For calculation of MOI in cells grown in 3D, cells were removed from beads by incubation with 0.5% trypsin for >30 min at 37°C and cell number per volume of beads was enumerated using a TC20 automated cell counter (Bio-Rad). Infections in cells cultured in 2D were performed in 8-well chamber slides (Lab-Tek) or 24-well plates. In all cases, infections of cells grown in 3D were performed in 24-well plates following removal of beads from the STLV. Infections were quantified by fluorescence microscopy using an FV1000 laser scanning confocal microscope (Olympus) followed by image analysis (ImageJ or Imaris; Bitplane) of the number of parasites with DAPI-positive nuclei. In all cases, at least three independent fields from three independent experiments were used for quantification.
Statistics
All statistical analyses were performed using GraphPad Prism. Student’s t test or one-way analysis of variance (ANOVA) was performed as appropriate. *P < 0.05, **P < 0.01, and ***P < 0.001, unless otherwise noted.
Supplementary Material
Acknowledgments
We thank S. Morosky (University of Pittsburgh) for technical assistance, D. Stolz and J. Franks (University of Pittsburgh) for assistance with SEM, and J. Bergelson (Children’s Hospital of Philadelphia) for careful review of the manuscript. Funding: This project was supported by NIH R01-AI081759 (C.B.C. and C.N.) and NIH R01-HD075665 (C.B.C. and Y.S.). In addition, C.B.C. was supported by the Burroughs Wellcome Investigators in the Pathogenesis of Infectious Disease Award. Author contributions: C.A.M., E.D.-A., and C.B.C. performed experiments; C.A.M., J.P.B., and C.B.C. analyzed data; Y.S. contributed reagents; C.A.N. assisted in establishing the RWV bioreactor; K.S.K. provided HBMECs used in the study; and J.P.B. and C.B.C. wrote the manuscript. Competing interests: The authors declare that they have no competing interests. Data and materials availability: All data needed to evaluate the conclusions in the paper are present in the paper and/or the Supplementary Materials. Additional data related to this paper may be requested from the authors. Files associated with RNASeq studies have been deposited into Sequence Read Archive (accession SRP067137).
SUPPLEMENTARY MATERIALS
Supplementary material for this article is available at http://advances.sciencemag.org/cgi/content/full/2/3/e1501462/DC1
Fig S1. Monotypica cultures of human trophoblast cells lines are not compatible with culturing in the RWV bioreactor.
Fig S2. Coculturing of JEG-3 cells with human microvascular endothelial cells promotes their attachment to Cytodex beads in the RWV bioreactor.
Fig S3. Human microvascular cells are removed from Cytodex beads by JEG-3 cells.
Fig S4. Levels of pregnancy hormones increases during culturing of JEG-3 cells in 3D.
Fig S5. JEG-3 cells cultured in 3D express high levels of syncytin, form brush borders, and can be transfected with siRNAs.
Fig S6. GSEA plots of genes with higher or lower abundance in JEG-3 cells cultured in 2D or 3D or in primary human trophoblasts.
Table S1. Thirteen “core” genes identified using GSEA gene clustering as being up-regulated in both 3D JEG-3 and PHT cells, while being of low abundance in both 2D JEG-3 cells and 3D HBMECs.
Table S2. Spreadsheet of gene expression profiles from RNASeq in 2D and 3D cultures of JEG-3 cells, PHT cells, and 3D cultures of HBMECs.
Data set S1. Spreadsheet from RNASeq studies of 2D and 3D cultures of JEG-3 cells, PHT cells, and 3D cultures of HBMECs. Shown are gene symbols, normalized expression values, and RPKM values from each condition.
Data set S2. Spreadsheet from differential expression analyses using DESeq2 of 2D and 3D cultures of JEG-3 cells.
Data set S3. Spreadsheet from differential expression analyses using DESeq2 of 2D and 3D cultures of HBMECs.
Data set S4. Spreadsheet from differential expression analyses using DESeq2 of 2D cultures of JEG-3 cells and PHT cells.
REFERENCES AND NOTES
- 1.Huppertz B., The anatomy of the normal placenta. J. Clin. Pathol. 61, 1296–1302 (2008). [DOI] [PubMed] [Google Scholar]
- 2.S. G. Gabbe, J. R. Niebyl, J. L. Simpson, M. B. Landon, H. L. Galan, E. R. M. Jauniaux, D. A. Driscoll, Eds., Obstetrics: Normal and Problem Pregnancies (Churchill Livingstone, New York, 2007), vol. 5. [Google Scholar]
- 3.Mi S., Lee X., Li X.-p., Veldman G. M., Finnerty H., Racie L., LaVallie E., Tang X.-Y., Edouard P., Howes S., Keith J. C. Jr, McCoy J. M., Syncytin is a captive retroviral envelope protein involved in human placental morphogenesis. Nature 403, 785–789 (2000). [DOI] [PubMed] [Google Scholar]
- 4.Wice B., Menton D., Geuze H., Schwartz A. L., Modulators of cyclic AMP metabolism induce syncytiotrophoblast formation in vitro. Exp. Cell Res. 186, 306–316 (1990). [DOI] [PubMed] [Google Scholar]
- 5.Lyden T. W., Ah-Kau N. G., Rote N. S., Modulation of phosphatidylserine epitope expression by BeWo cells during forskolin treatment. Placenta 14, 177–186 (1993). [DOI] [PubMed] [Google Scholar]
- 6.Adler R. R., Ng A. K., Rote N. S., Monoclonal antiphosphatidylserine antibody inhibits intercellular fusion of the choriocarcinoma line, JAR. Biol. Reprod. 53, 905–910 (1995). [DOI] [PubMed] [Google Scholar]
- 7.Coutifaris C., Kao L. C., Sehdev H. M., Chin U., Babalola G. O., Blaschuk O. W., Strauss J. F., E-cadherin expression during the differentiation of human trophoblasts. Development 113, 767–777 (1991). [DOI] [PubMed] [Google Scholar]
- 8.Kliman H. J., Nestler J. E., Sermasi E., Sanger J. M., Strauss J. F. III, Purification, characterization, and in vitro differentiation of cytotrophoblasts from human term placentae. Endocrinology 118, 1567–1582 (1986). [DOI] [PubMed] [Google Scholar]
- 9.Schwarz R. P., Goodwin T. J., Wolf D. A., Cell culture for three-dimensional modeling in rotating-wall vessels: An application of simulated microgravity. J. Tissue Cult. Methods 14, 51–57 (1992). [DOI] [PubMed] [Google Scholar]
- 10.Unsworth B. R., Lelkes P. I., Growing tissues in microgravity. Nat. Med. 4, 901–907 (1998). [DOI] [PubMed] [Google Scholar]
- 11.Barrila J., Radtke A. L., Crabbé A., Sarker S. F., Herbst-Kralovetz M. M., Ott C. M., Nickerson C. A., Organotypic 3D cell culture models: Using the rotating wall vessel to study host–pathogen interactions. Nat. Rev. Microbiol. 8, 791–801 (2010). [DOI] [PubMed] [Google Scholar]
- 12.Nauman E. A., Ott C. M., Sander E., Tucker D. L., Pierson D., Wilson J. W., Nickerson C. A., Novel quantitative biosystem for modeling physiological fluid shear stress on cells. Appl. Environ. Microbiol. 73, 699–705 (2007). [DOI] [PMC free article] [PubMed] [Google Scholar]
- 13.Graham C. H., Hawley T. S., Hawley R. C., MacDougall J. R., Kerbel R. S., Khoo N., Lala P. K., Establishment and characterization of first trimester human trophoblast cells with extended lifespan. Exp. Cell Res. 206, 204–211 (1993). [DOI] [PubMed] [Google Scholar]
- 14.Esnault C., Priet S., Ribet D., Vernochet C., Bruls T., Lavialle C., Weissenbach J., Heidmann T., A placenta-specific receptor for the fusogenic, endogenous retrovirus-derived, human syncytin-2. Proc. Natl. Acad. Sci. U.S.A. 105, 17532–17537 (2008). [DOI] [PMC free article] [PubMed] [Google Scholar]
- 15.McWilliams D., Boime I., Cytological localization of placental lactogen messenger ribonucleic acid in syncytiotrophoblast layers of human placenta. Endocrinology 107, 761–765 (1980). [DOI] [PubMed] [Google Scholar]
- 16.Than N. G., Balogh A., Romero R., Kárpáti É., Erez O.-f., Szilágyi A., Kovalszky I., Sammar M., Gizurarson S., Matkó J., Závodszky P., Papp Z., Meiri H., Placental Protein 13 (PP13)—A placental immunoregulatory galectin protecting pregnancy. Front. Immunol. 5, 348 (2014). [DOI] [PMC free article] [PubMed] [Google Scholar]
- 17.Sugimoto J., Sugimoto M., Bernstein H., Jinno Y., Schust D., A novel human endogenous retroviral protein inhibits cell-cell fusion. Sci. Rep. 3, 1462 (2013). [DOI] [PMC free article] [PubMed] [Google Scholar]
- 18.Rosario F. J., Sadovsky Y., Jansson T., Gene targeting in primary human trophoblasts. Placenta 33, 754–762 (2012). [DOI] [PMC free article] [PubMed] [Google Scholar]
- 19.Subramanian A., Tamayo P., Mootha V. K., Mukherjee S., Ebert B. L., Gillette M. A., Paulovich A., Pomeroy S. L., Golub T. R., Lander E. S., Mesirov J. P., Gene set enrichment analysis: A knowledge-based approach for interpreting genome-wide expression profiles. Proc. Natl. Acad. Sci. U.S.A. 102, 15545–15550 (2005). [DOI] [PMC free article] [PubMed] [Google Scholar]
- 20.Pavlidis P., Noble W. S., Analysis of strain and regional variation in gene expression in mouse brain. Genome Biol. 2, RESEARCH0042–RESEARCH0042.15 (2001). [DOI] [PMC free article] [PubMed] [Google Scholar]
- 21.Eisen M. B., Spellman P. T., Brown P. O., Botstein D., Cluster analysis and display of genome-wide expression patterns. Proc. Natl. Acad. Sci. U.S.A. 95, 14863–14868 (1998). [DOI] [PMC free article] [PubMed] [Google Scholar]
- 22.Saeed A. I., Sharov V., White J., Li J., Liang W., Bhagabati N., Braisted J., Klapa M., Currier T., Thiagarajan M., Sturn A., Snuffin M., Rezantsev A., Popov D., Ryltsov A., Kostukovich E., Borisovsky I., Liu Z., Vinsavich A., Trush V., Quackenbush J., TM4: A free, open-source system for microarray data management and analysis. BioTechniques 34, 374–378 (2003). [DOI] [PubMed] [Google Scholar]
- 23.Zhou G.-Q., Baranov V., Zimmermann W., Grunert F., Erhard B., Mincheva-Nilsson L., Hammarström S., Thompson J., Highly specific monoclonal antibody demonstrates that pregnancy-specific glycoprotein (PSG) is limited to syncytiotrophoblast in human early and term placenta. Placenta 18, 491–501 (1997). [DOI] [PubMed] [Google Scholar]
- 24.Delorme-Axford E., Donker R. B., Mouillet J.-F., Chu T., Bayer A., Ouyang Y., Wang T., Stolz D. B., Sarkar S. N., Morelli A. E., Sadovsky Y., Coyne C. B., Human placental trophoblasts confer viral resistance to recipient cells. Proc. Natl. Acad. Sci. U.S.A. 110, 12048–12053 (2013). [DOI] [PMC free article] [PubMed] [Google Scholar]
- 25.Robbins J. R., Zeldovich V. B., Poukchanski A., Boothroyd J. C., Bakardjiev A. I., Tissue barriers of the human placenta to infection with Toxoplasma gondii. Infect. Immun. 80, 418–428 (2012). [DOI] [PMC free article] [PubMed] [Google Scholar]
- 26.Kohler P. O., Bridson W. E., Isolation of hormone-producing clonal lines of human choriocarcinoma. J. Clin. Endocrinol. Metab. 32, 683–687 (1971). [DOI] [PubMed] [Google Scholar]
- 27.Hertz R., Choriocarcinoma of women maintained in serial passage in hamster and rat. Proc. Soc. Exp. Biol. Med. 102, 77–81 (1959). [DOI] [PubMed] [Google Scholar]
- 28.Kovats S., Main E. K., Librach C., Stubblebine M., Fisher S. J., DeMars R., A class I antigen, HLA-G, expressed in human trophoblasts. Science 248, 220–223 (1990). [DOI] [PubMed] [Google Scholar]
- 29.Lee M. H., Reynisdóttir I., Massagué J., Cloning of p57KIP2, a cyclin-dependent kinase inhibitor with unique domain structure and tissue distribution. Genes Dev. 9, 639–649 (1995). [DOI] [PubMed] [Google Scholar]
- 30.Ullah Z., Kohn M. J., Yagi R., Vassilev L. T., DePamphilis M. L., Differentiation of trophoblast stem cells into giant cells is triggered by p57/Kip2 inhibition of CDK1 activity. Genes Dev. 22, 3024–3036 (2008). [DOI] [PMC free article] [PubMed] [Google Scholar]
- 31.Delorme-Axford E., Sadovsky Y., Coyne C. B., Lipid raft- and Src family kinase-dependent entry of coxsackievirus B into human placental trophoblasts. J. Virol. 87, 8569–8581 (2013). [DOI] [PMC free article] [PubMed] [Google Scholar]
- 32.Coyne C. B., Kim K. S., Bergelson J. M., Poliovirus entry into human brain microvascular cells requires receptor-induced activation of SHP-2. EMBO J. 26, 4016–4028 (2007). [DOI] [PMC free article] [PubMed] [Google Scholar]
- 33.Chen B., Nelson D. M., Sadovsky Y., N-myc down-regulated gene 1 modulates the response of term human trophoblasts to hypoxic injury. J. Biol. Chem. 281, 2764–2772 (2006). [DOI] [PubMed] [Google Scholar]
- 34.Nelson D. M., Johnson R. D., Smith S. D., Anteby E. Y., Sadovsky Y., Hypoxia limits differentiation and up-regulates expression and activity of prostaglandin H synthase 2 in cultured trophoblast from term human placenta. Am. J. Obstet. Gynecol. 180, 896–902 (1999). [DOI] [PubMed] [Google Scholar]
- 35.Love M. I., Huber W., Anders S., Moderated estimation of fold change and dispersion for RNA-seq data with DESeq2. Genome Biol. 15, 550 (2014). [DOI] [PMC free article] [PubMed] [Google Scholar]
- 36.Bayer A., Delorme-Axford E., Sleigher C., Frey T. K., Trobaugh D. W., Klimstra W. B., Emert-Sedlak L. A., Smithgall T. E., Kinchington P. R., Vadia S., Seveau S., Boyle J. P., Coyne C. B., Sadovsky Y., Human trophoblasts confer resistance to viruses implicated in perinatal infection. Am. J. Obstet. Gynecol. 212, 71.e1–71.e8 (2015). [DOI] [PMC free article] [PubMed] [Google Scholar]
- 37.Kamau E., Meehan T., Lavine M. D., Arrizabalaga G., Wilson G. M., Boyle J., A novel benzodioxole-containing inhibitor of Toxoplasma gondii growth alters the parasite cell cycle. Antimicrob. Agents Chemother. 55, 5438–5451 (2011). [DOI] [PMC free article] [PubMed] [Google Scholar]
- 38.Feliu V., Vasseur V., Grover H. S., Chu H. H., Brown M. J., Wang J., Boyle J. P., Robey E. A., Shastri N., Blanchard N., Location of the CD8 T cell epitope within the antigenic precursor determines immunogenicity and protection against the Toxoplasma gondii parasite. PLOS Pathog. 9, e1003449 (2013). [DOI] [PMC free article] [PubMed] [Google Scholar]
Associated Data
This section collects any data citations, data availability statements, or supplementary materials included in this article.
Supplementary Materials
Supplementary material for this article is available at http://advances.sciencemag.org/cgi/content/full/2/3/e1501462/DC1
Fig S1. Monotypica cultures of human trophoblast cells lines are not compatible with culturing in the RWV bioreactor.
Fig S2. Coculturing of JEG-3 cells with human microvascular endothelial cells promotes their attachment to Cytodex beads in the RWV bioreactor.
Fig S3. Human microvascular cells are removed from Cytodex beads by JEG-3 cells.
Fig S4. Levels of pregnancy hormones increases during culturing of JEG-3 cells in 3D.
Fig S5. JEG-3 cells cultured in 3D express high levels of syncytin, form brush borders, and can be transfected with siRNAs.
Fig S6. GSEA plots of genes with higher or lower abundance in JEG-3 cells cultured in 2D or 3D or in primary human trophoblasts.
Table S1. Thirteen “core” genes identified using GSEA gene clustering as being up-regulated in both 3D JEG-3 and PHT cells, while being of low abundance in both 2D JEG-3 cells and 3D HBMECs.
Table S2. Spreadsheet of gene expression profiles from RNASeq in 2D and 3D cultures of JEG-3 cells, PHT cells, and 3D cultures of HBMECs.
Data set S1. Spreadsheet from RNASeq studies of 2D and 3D cultures of JEG-3 cells, PHT cells, and 3D cultures of HBMECs. Shown are gene symbols, normalized expression values, and RPKM values from each condition.
Data set S2. Spreadsheet from differential expression analyses using DESeq2 of 2D and 3D cultures of JEG-3 cells.
Data set S3. Spreadsheet from differential expression analyses using DESeq2 of 2D and 3D cultures of HBMECs.
Data set S4. Spreadsheet from differential expression analyses using DESeq2 of 2D cultures of JEG-3 cells and PHT cells.