

Abstract
An understanding of macromolecular conformational equilibrium in biological systems is oftentimes essential to understand function, dysfunction, and disease. For the past few years, our lab has been utilizing site-directed spin labeling (SDSL), coupled with electron paramagnetic resonance (EPR) spectroscopy, to characterize the conformational ensemble and ligand-induced conformational shifts of HIV-1 protease (HIV-1PR). The biomedical importance of characterizing the fractional occupancy of states within the conformational ensemble critically impacts our hypothesis of a conformational selection mechanism of drug-resistance evolution in HIV-1PR. The purpose of the following chapter is to give a timeline perspective of our SDSL EPR approach to characterizing conformational sampling of HIV-1PR. We provide detailed instructions for the procedure utilized in analyzing distance profiles for HIV-1PR obtained from pulsed electron–electron double resonance (PELDOR). Specifically, we employ a version of PELDOR known as double electron–electron resonance (DEER). Data are processed with the software package “DeerAnalysis” (http://www.epr.ethz.ch/software), which implements Tikhonov regularization (TKR), to generate a distance profile from electron spin-echo amplitude modulations. We assign meaning to resultant distance profiles based upon a conformational sampling model, which is described herein. The TKR distance profiles are reconstructed with a linear combination of Gaussian functions, which is then statistically analyzed. In general, DEER has proven powerful for observing structural ensembles in proteins and, more recently, nucleic acids. Our goal is to present our advances in order to aid readers in similar applications.
1. PERSPECTIVE—CONFORMATIONAL SAMPLING OF HIV-1 PROTEASE
Human Immunodeficiency Virus-1 protease (HIV-1PR) is an essential enzyme in the replicative lifecycle of HIV (Louis, Ishima, Torchia, & Weber, 2007; Robbins et al., 2010). As such, it is a critical target in the management of infection (Agniswamy et al., 2012; Joint United Nations Programme on HIV/AIDS, 2010; Martinez-Cajas & Wainberg, 2007; Robbins et al., 2010; Wlodawer & Vondrasek, 1998). HIV-1PR, shown in Fig. 1, is a symmetric homodimer where each monomer consists of 99 amino acids (Louis et al., 2007; Wlodawer & Gustchina, 2000). It is well known that HIV-1PR exhibits multiple conformational states during activity, which involves movement of two β-hairpin “flaps” (shown in Fig. 1) that mediate access to HIV-1PR’s active site region (Ding, Layten, & Simmerling, 2008; Freedberg et al., 2002; Hornak, Okur, Rizzo, & Simmerling, 2006b; Ishima, Freedberg, Wang, Louis, & Torchia, 1999; Sadiq & De Fabritiis, 2010). Each state includes an ensemble of structures in which monomer orientations differ, primarily in the relative orientations of the flaps (Ding et al., 2008; Hornak, Okur, Rizzo, & Simmerling, 2006a; Ishima et al., 1999).
Figure 1.
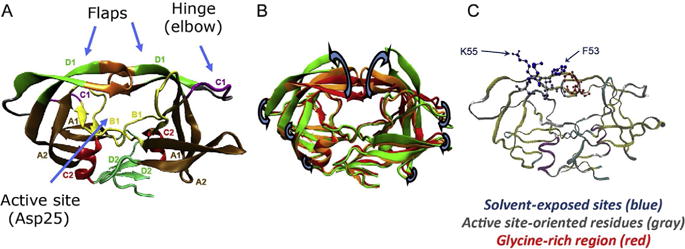
HIV-1 protease structure. (A) Ribbon diagram of HIV-1PR showing various structural elements as described by Wlodawer (Wlodawer & Gustchina, 2000). (B) Overlay of HIV-1PR conformations showing how regions of the protein move during opening and closing of the β-hairpin “flaps.” (C) Ribbon diagram showing ball and stick representations of the spin-labeling sites K55 and F53, inward facing residues, and the glycine-rich tips of the flaps. Panel (B): Structures are taken from MD simulations and were a gift from Carlos Simmerling.
At present, our view of the conformational sampling landscape in HIV-1PR evokes a dynamic equilibrium between four distinct conformational states (Blackburn, Veloro, & Fanucci, 2009; Carter et al., 2014; de Vera, Smith, et al., 2013; de Vera, Blackburn, & Fanucci, 2012; Galiano, Bonora, & Fanucci, 2007; Galiano, Ding, et al., 2009; Huang et al., 2012, 2014; Kear, Blackburn, Veloro, Dunn, & Fanucci, 2009; Torbeev et al., 2009, 2011). The model landscape supposes an ensemble average of the four conformers sampled by the apoenzyme, where ligand binding or polymorphisms alter the relative stability, and hence, fractional occupancy of each conformer in the ensemble. These conformational states are referred to as closed, semi-open, curled/tucked, and wide open, where the last two are taken together as “open-like” states, as it is assumed that inhibitor can readily dissociate from the active site pocket (de Vera, Smith, et al., 2013; Huang et al., 2012, 2014). A comparison of ensemble conformers is shown in Fig. 2.
Figure 2.
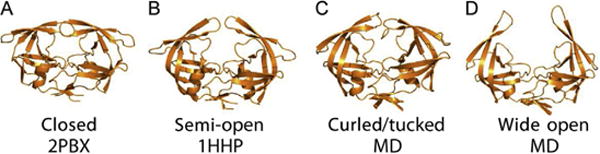
Conformational sampling model for HIV-1PR. Ribbon diagrams were made from coordinates obtained from X-ray data deposited within the protein data bank (PDB) or from MD simulations as indicated. The four flap conformers are termed (A) “closed,” (B) “semi-open,” (C) “curled/tucked,” and (D) “wide open.” Dynamic equilibrium between these four states correlates to substrate and inhibitor binding. Naturally occurring polymorphisms or drug-pressure selected mutations shift the equilibrium to alter enzymatic activity and substrate and inhibitor binding efficiencies. MD coordinates were a gift from Adrian Roitberg.
Numerous crystal structures of HIV-1PR show the flaps in either a semi-open or closed conformation (Hong, Zhang, Hartsuck, & Tang, 2000; Louis et al., 2007). Evidence for a large conformational opening of the flaps has been predicted from kinetic effects (Ermolieff, Lin, & Tang, 1997; Freedberg et al., 2002), nuclear magnetic resonance (NMR) studies (Huang et al., 2012, 2013; Ishima & Louis, 2008), and molecular dynamics (MD) simulations (Freedberg et al., 2002; Sadiq & De Fabritiis, 2010; Wittayanarakul et al., 2005). Several X-ray structures have been solved in a more “open-like” state (Agniswamy et al., 2012; Coman et al., 2008; Martin et al., 2005; Robbins et al., 2010; Weber, Agniswamy, Fu, Shen, & Harrison, 2012), but the flaps are not as wide open as seen in snap-shots from MD simulations (Fig. 2; Ding et al., 2008; Hornak et al., 2006b). According to MD simulations of subtype B, HIV-1PR in the absence of substrate or inhibitor samples predominantly the semi-open state (60–85%), while the relative population of the wide-open state is consistently minor (<10%) (Ding et al., 2008; Hornak et al., 2006a, 2006b). The conformational equilibrium shifts to favor the closed-like states in the presence of substrate or inhibitor. Detailed NMR investigations also show that inhibitor binding alters the backbone dynamics of protease, particularly in the flap region. The glycine-rich tips of the flaps retain dynamics that occur on the nanosecond timescale, whereas backbone fluctuations elsewhere in the β-hairpin slow from the microsecond to millisecond regimes (Freedberg et al., 2002; Ishima & Torchia, 2003; Ishima et al., 1999; Katoh et al., 2003; Louis et al., 2007). Inhibitor binding also results in a shift of the conformational ensemble to a predominantly closed state (Ishima et al., 1999; Katoh et al., 2003; Louis et al., 2007).
Based on this notion of a dynamic equilibrium between closed, semi-open, and wide-open states, we aimed to utilize site-directed spin-labeling (SDSL) electron paramagnetic resonance (EPR) spectroscopy to characterize the “opening” and conformational dynamics of the flaps in the apoenzyme, along with ligand-induced conformational shifts to the closed state.
2. SITE-DIRECTED SPIN-LABELING ELECTRON PARAMAGNETIC RESONANCE SPECTROSCOPY
2.1 A Tool for Characterizing Functional Dynamics and Conformational Equilibria of HIV-1PR
Continuous-wave (CW) and pulsed EPR spectroscopy have become important tools for studying biomolecular structure and conformational dynamics (Fanucci & Cafiso, 2006; Hubbell, Cafiso, & Altenbach, 2000; Hubbell, Gross, Langen, & Lietzow, 1998; Hubbell, Lopez, Altenbach, & Yang, 2013; Hubbell, McHaourab, Altenbach, & Lietzow, 1996). In this method, unpaired electrons either exist or are incorporated into biomolecules at selected sites where the experimenter is interested in interrogating the local structure or dynamics of motion. Because the behavior(s) of unpaired electron(s) in externally applied static and oscillating magnetic fields is dependent on the spin probe’s local environment, EPR spectra reflect structural and/or functional characteristics in that region. For our studies with HIV-1PR, site-directed mutagenesis strategies were employed, in which nitroxide-based spin labels were utilized as the source of unpaired electrons. Several reviews describe how the CW EPR spectrum for nitroxide spin probes reflects motion and the local environment (Casey et al., 2014; Hubbell et al., 1998, 2000; McHaourab, Lietzow, Hideg, & Hubbell, 1996; Zhang et al., 2010).
When applied to HIV-1PR, the X-band CW EPR line shapes for nitroxide spin labels incorporated at the chosen flap reporter site (K55C) did not reflect changes in structure or dynamics upon substrate or inhibitor binding (Galiano, Blackburn, Veloro, Bonora, & Fanucci, 2009; Galiano et al., 2007). Furthermore, even with different protease constructs, the X-band CW EPR line shapes are nearly identical (de Vera, Smith, et al., 2013; Kear et al., 2009). Figure 3 shows spectra obtained for the spin label at site K55C with and without inhibitor (overlain) for three different HIV-1PR constructs.
Figure 3.
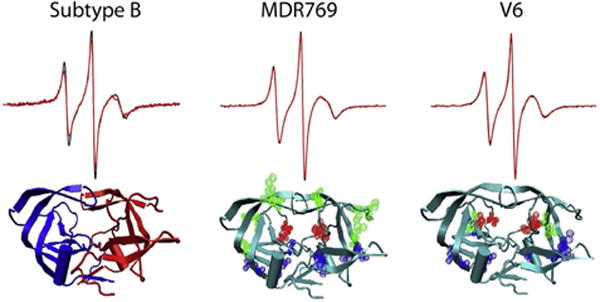
Selected CW EPR spectra for site K55R1 [R1 = Cys labeled with S-(1-oxyl-2,2,5, 5-tetramethyl-2,5-dihydro-1H-pyrrol-3-yl)methylmethanesulfonothioate (MTSL)] on three different HIV-1PR constructs in the absence and presence of inhibitor (scan width, 100 Gauss). The overlain spectra are nearly identical. Ribbon diagrams show the location of the amino acid substitutions relative to subtype B.
This finding, for us, was unusual considering conformational changes in spin-labeled macromolecules are usually accompanied by a change in the CW EPR line shape (Fanucci & Cafiso, 2006; Hubbell et al., 2000; Kim, Xu, Murray, & Cafiso, 2008). The conclusion drawn from these early studies was that the spin label dynamics at site K55C reflected mostly the internal motion of the spin label, which was largely decoupled from the backbone dynamics of the β-hairpin flap (Galiano, Ding, et al., 2009; Galiano et al., 2007). Unpublished data collected at the National Biomedical Research Center for Advanced ESR Technology using an EPR spectrometer operating at 140 GHz do, however, reveal differences in spectral line shapes for HIV-1PR constructs with and without inhibitors; thus demonstrating differential dynamics at these sites. Further analyses are underway that will elucidate the molecular origins of the motions that give rise to differences in the 140 GHz spectra.
Given the extensive NMR and X-ray crystallography data that exist for HIV-1PR, we were confident that inhibitor binding would induce a conformational change in this enzyme. Hence, we pursued an alternative approach in which it was assumed that changes in conformational sampling could be studied by observing corresponding changes in distances between points of interest in HIV-1PR, and that these distance changes would correlate with the conformational shifts. For this, we turned to a pulsed EPR technique known as double electron–electron resonance (DEER), which can be used to determine profiles of distances between two unpaired electrons in bio-macromolecules. The details of DEER theory have been described elsewhere (Borbat, Davis, Butcher, & Freed, 2004; Borbat, McHaourab, & Freed, 2002; Jeschke, 2002; Jeschke, Panek, Godt, Bender, & Paulsen, 2004; Jeschke & Polyhach, 2007; Pannier, Veit, Godt, Jeschke, & Spiess, 2000), and will not be covered here. Briefly, given HIV-1PR is a homodimer, a single reporter site (K55C) is used to attach two nitroxide spin labels within the protein, targeted to be within ~2–6 nm of one another. Dipolar couplings between the unpaired electrons in the spin labels impart modulations on a stimulated electron spin-echo amplitude collected as a function of the time spacing between specific microwave pulses in the DEER pulse sequence. Encoded in the frequencies of the modulations are the distances between coupled electron spins. When a range of distances exists in a single sample, the time domain data are a product of the individual contributions, which can be transformed into a distance domain profile. Changes in conformational dynamics at spin-labeled sites corresponding to conformational shifts will be reflected in the distance profiles.
As can be seen in Fig. 4, comparisons of DEER echo modulation curves collected for HIV-1PR in the absence or presence of inhibitor (Ritonavir) clearly reflect changes in conformation (Blackburn et al., 2009; Galiano et al., 2007) and the corresponding distance profiles reflect our expected distances of 33 Å for the closed state and 36 Å for the semi-open state. We also proposed that the relatively small population in the uninhibited form (apo) at 43 Å corresponded to the wide-open state (Blackburn et al., 2009; Ding et al., 2008; Galiano et al., 2007). As we continued characterizing conformational sampling of other subtypes and effects of drug-pressure selected mutations, not only did we notice an increase in the fractional occupancy of the wide-open state (located at 43 Å in Fig. 4) but also the emergence of a population at a fourth distance within our ensemble (Galiano, Ding, et al., 2009; Kear et al., 2009). We currently propose that this population corresponds to an opening of the flaps in a less hindered side-to-side fashion (Carter et al., 2014; Huang et al., 2012, 2014).
Figure 4.
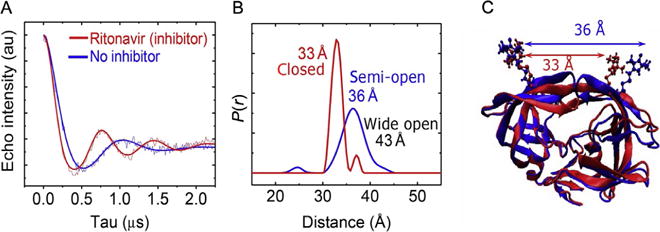
DEER results for HIV-1PR without and with inhibitor Ritonavir. (A) Background-corrected DEER echo modulation traces where solid lines are TKR fits of the data. (B) Corresponding distance profiles with distances and conformational states labeled accordingly. (C) Overlay of average crystallographic structure of HIV-1PR in the semi-open and closed flap conformations with MTSL appended at site K55C. Anticipated distances from modeled spin label rotamers are indicated.
Since our first investigation, we have used SDSL EPR and DEER to characterize conformational equilibria as a function of inhibitor binding (Blackburn et al., 2009; de Vera, Smith, et al., 2013; Galiano et al., 2007; Huang et al., 2012), naturally occurring polymorphisms (Huang et al., 2014; Kear et al., 2009), and drug-pressure selected mutations (Carter et al., 2014; de Vera, Blackburn, Galiano, & Fanucci, 2013; de Vera et al., 2012; Galiano, Ding, et al., 2009). Specifically, we have been successful in characterizing the expected shift to the closed conformation upon inhibitor binding as well as altered conformational landscapes induced by both natural polymorphisms and drug-pressure selected mutations. Importantly, we have also demonstrated a correlation between shifts in conformational sampling and the evolution of secondary mutations, thus providing a hypothesis for the mechanism by which mutations distal from the active site impact multidrug resistance without abolishing enzymatic activity (de Vera, Smith, et al., 2013). Our lab continues to utilize SDSL DEER to characterize conformational sampling in HIV-1PR with the goal of understanding the effects that natural polymorphisms and drug-pressure selected mutations have on conformational sampling, and the corresponding impacts on enzyme activity and drug resistance.
2.2 Considerations for EPR Studies
Before discussing the analyses of HIV-1PR DEER distance profiles in detail, we present our approach, beginning with our first experiments on HIV-1PR. When proposing SDSL EPR studies, it is essential to first explore the effects that the requirements of the experiment may have on the “native-like” system. Examples include the effects of glassing agents, cryoprotectants, sample freezing, and select mutations on conformational equilibria (Galiano, Ding, et al., 2009; Georgieva et al., 2012; Kim et al., 2008). In practice, it is ideal to repeat measurements. Typically, we do this by collecting data on similar samples prepared from two different protein batches (de Vera, Blackburn, et al., 2013; de Vera, Smith, et al., 2013).
2.2.1 Where to Incorporate the Spin Label
When deciding where to incorporate the spin label, we looked for an aqueous-exposed site. We assumed that the conformational distribution of the spin label in the aqueous-exposed region of the β-hairpin would generate fewer steric interactions, and hence, a more narrow spin label rotamer ensemble, resulting in less spin label distance heterogeneity. MD simulations for our chosen nitroxide validated our original assumption (Ding et al., 2008). Additionally, MD studies indicate that the rotomeric conformational sampling of the spin label MTSL incorporated at site K55C in HIV-1PR is not restricted by the S-H back-bonding described by Hubell as the “χ4/χ5 model” (Columbus, Kalai, Jeko, Hideg, & Hubbell, 2001). In fact, our MD data suggest that this interaction is present <10% of the time (unpublished data) and may account for the narrow distance profiles we obtain for MTSL in the inhibitor closed state.
For HIV-1PR, it was essential that we chose a site within the protein that could tolerate amino acid substitutions without changes in enzymatic activity. Given that at least 38 of 99 amino acid residues are modified as a result of drug-pressure selection or natural genetic drift (Martinez-Cajas, Pai, Klein, & Wainberg, 2009; Martinez-Cajas, Pant-Pai, Klein, & Wainberg, 2008; Martinez-Cajas & Wainberg, 2007), our choice of sites was limited. Previous reports from other groups, where saturation mutagenesis was performed, showed limited sites in the flaps where mutations were readily tolerated (Shao et al., 1997). In Fig. 1C, potential target sites for spin labeling in the flaps are shown. In these regions, flexibility and dynamics are strongly correlated with function. Residues F53 and K55, for example, project into solution, making them ideal target sites. For site F53C, however, we encountered issues with protein precipitation after spin labeling. In addition, other reports showed that F53 forms important interactions with the flaps during opening and closing (Ermolieff et al., 1997; Hong et al., 2000; Saen-oon, Aruksakunwong, Wittayanarakul, Sompornpisut, & Hannongbua, 2007; Wittayanarakul et al., 2005). Site K55C, on the other hand, was found to tolerate a suite of spin labels and fluorophores without significantly impacting catalytic cleavage of a chromogenic substrate or causing precipitation during sample preparation (Blackburn et al., 2009).
Finally, the ideal site would lead to distance separations that are within the range of maximum sensitivity for DEER experiments (~30–50 Å). Because our original studies occurred before spin label rotamer modeling software, such as MMM (http://www.epr.ethz.ch/software), was readily available, we estimated anticipated distances of each conformational state using energy minimization with VMD (http://www.ks.uiuc.edu/Research/vmd). For an averaged semi-open structure (average of all structures in the database at that time) appended with the MTSL spin label, our simulations predicted an average distance of 36 Å. The same approach was utilized for the closed structure, where an average distance of 33 Å was predicted. Subsequently, through collaboration with Carlos Simmerling, full MD simulations were performed and the ensemble average of distances between spin labels was determined (Ding et al., 2008; Galiano, Ding, et al., 2009). The results, along with our VMD results, confirmed that the two K55 sites in the dimer had sampling distance ranges that are ideal for DEER investigations. Included in the results was the prediction of the aforementioned “wide-open” state, with anticipated distances centered near 43 Å. This finding was promising, as it suggested we should have access to the full range of dynamic conformers sampled by the HIV-1PR flaps.
As is the case with most spin-labeling studies, the naturally occurring cysteine (CYS) residues were initially targeted for mutagenesis. Given the rich history of HIV-1PR in structural biology, we looked to the literature and found that for various NMR and X-ray investigations it was common for the two naturally occurring CYS amino acids to be replaced with alanine (C67A and C95A) instead of the more common serine (SER) substitution (de Vera, Blackburn, et al., 2013). Although the structure of CYS is similar to SER, their hydrophobic/hydrophilic and hydrogen bonding properties are quite different. Because the naturally occurring CYS residues move into buried locations within the protein during conformational changes, the conservative mutation to SER is not well tolerated (de Vera, Blackburn, et al., 2013). As this example suggests, it can be erroneous to assume that SER is always the best choice for substitution of naturally occurring CYS residues.
2.2.2 Control Experiments for Validity of Conformational Sampling Results
2.2.2.1 Effects of Osmolytes on Conformational Sampling
Given our previous experience with using EPR for investigating the effects of osmolytes on conformational sampling of the vitamin B-12 transporter protein BtuB (a membrane protein) (Fanucci, Lee, & Cafiso, 2003; Kim, Xu, Fanucci, & Cafiso, 2006), as well as published work showing that osmolytes alter conformational sampling in T4 lysozyme (T4L) (Georgieva et al., 2012), we felt it important to assay the effects of cosolutes on the HIV-1PR conformational change. Figure 5 illustrates select results (Galiano, Blackburn, et al., 2009). These types of control experiments are essential before attempting to characterize conformational ensembles of any macromolecular system. This is especially true for DEER experiments as data are collected under cryogenic temperatures and glassing agents such as glycerol, sucrose, or Ficoll are used to improve uniformity in electron spin phase memory times (TM) (de Vera, Blackburn, et al., 2013; Jeschke, 2002; Jeschke & Polyhach, 2007). However, this concern is eliminated in many membrane protein studies, as the lipids themselves act adequately as glassing agents and other cosolutes are not required.
Figure 5.
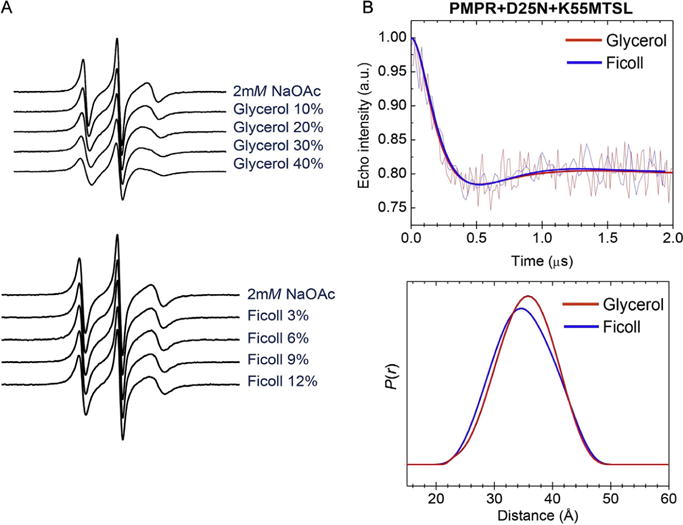
Effects of cosolutes on CW EPR spectra and DEER distance profiles. (A) Glycerol has a modest effect on the spectral line shape, whereas Ficoll does not perturb the spectra. (B) DEER showing that the Ficoll distance profile adequately matches that of glycerol. Data are modified from Galiano, Blackburn, et al. (2009).
The control studies on HIV-1PR show that glycerol and other polyethylene glycol-based polymers did alter the CW line shape for spin-labeled constructs. Specifically, the CW EPR spectra for the samples prepared with glycerol (Fig. 5) indicate changes in the spin label’s rotational correlation time, whereas those of the sample prepared with Ficoll do not. However, DEER data collected with sucrose, glycerol, and Ficoll gave similar results, indicating that the changes seen in the CW spectra in the presence of glycerol do not arise from alterations in protein conformational ensembles. Additional studies further demonstrated that the glassing agents do not alter conformational sampling or shift the conformation to any given state (Galiano, Ding, et al., 2009). We rationalize these findings by considering that glycol-based cosolutes have specific surface interactions with HIV-1PR that impact surface hydration. As a result, the solvation changes in the spin-labeled region alter spin label dynamics without inducing the closed conformation that is observed upon addition of inhibitor or substrate (Galiano, Ding, et al., 2009; Fig. 4). For HIV-1PR, changes in surface hydration are not accompanied by changes in conformational sampling likely because the hydrophobic-exposed hydration surface area does not differ significantly in the various states (Fanucci et al., 2003; Kim et al., 2006). Based on these findings, HIV-1PR samples are prepared with glycerol (30% by volume).
In addition to ideal physical properties in solution, glycerol is typically less expensive than the other reagents and can readily be purchased in deuterated form. This is vital as the use of deuterated solvents and cosolutes is a common strategy for extending TM to improve sensitivity in DEER experiments (Jeschke, 2002; Jeschke & Polyhach, 2007). As such, most of the HIV-1PR DEER experiments are performed on samples prepared in deuterated solvents and using deuterated cosolutes where possible (de Vera, Blackburn, et al., 2013; de Vera, Smith, et al., 2013; de Vera et al., 2012; Huang et al., 2012).
It has recently been pointed out that solvent deuteration can lead to artifacts in situations where nonuniform solvent exposure of the spin labels leads to nonuniform TM (El Mkami, Ward, Bowman, Owen-Hughes, & Norman, 2014). In addition, a recent study demonstrated that similar artifacts could be observed in DEER experiments performed at Q-Band (35 GHz; 1.3 T) due to the increase in the time over which the DEER pulse sequence is extended (Baber, Louis, & Clore, 2015). This has the effect of filtering frequency contributions from the time domain DEER signal according to the relationships between the total pulse sequence time and the TM values leading to distorted distance profiles. The authors of the cited studies suggest the artifacts can be avoided by fully deuterating the biomolecule under investigation, in addition to deuterating the solvents and cosolutes. For DEER experiments at Q-Band, an alternative approach is to use a range of total pulse sequence times and analyze multiple distance profiles in parallel.
2.2.2.2 Effects of Cryogenic Temperatures on Ligand Binding
An additional concern was the effect of both temperature and cosolutes on ligand binding. In a detailed study, we utilized inhibitor titration effects on heteronuclear single-quantum coherence NMR spectra to characterize the time scale of ligand–protein interactions at near physiological temperatures in the absence of glycerol (Huang et al., 2013). The results were compared to DEER-determined inhibitor-induced conformational shifts where samples were prepared with glycerol added as a glassing agent (Huang et al., 2012). Similarities in findings from these two studies confirm the validity of the DEER approach to reliably report on structure and conformational sampling indicative of the native system. In addition, the results of the DEER study showed that for a drug resistant construct, the DEER-determined shifts to the closed state correlated with changes in drug IC50 values when compared to the consensus sequence (de Vera et al., 2012).
We have also explored the effects of freezing rate on the DEER conformational sampling ensemble of HIV-1PR. This was motivated by observations of Freed and coworkers in studies of T4L, in which the freezing rate affected spin label rotamer conformation (Georgieva et al., 2012). To date, we find no significant difference in ligand bound profiles between: (a) submersion of room temperature samples in isopentane suspended in liquid nitrogen (~1.5 s freezing time) or (b) equilibrating room temperature samples to 253 K followed by submersion in liquid nitrogen (~30–60 s total freezing time).
2.2.2.3 Effects of the Inactivating D25N Mutation
A final consideration regarding HIV-1PR was the presence or absence of the D25N substitution, which is typically used to prevent substrate or inhibitor processing and self-proteolysis and to enhance protein stability. It is well known that this mutation also alters inhibitor affinity (Kd) by nearly 100–1000-fold (de Vera, Smith, et al., 2013; Huang et al., 2012, 2014). However, since inhibitors bind in the nM range and the samples have enzyme concentrations of approx. 100–500 μM, which is still 10–100 × >Kd, the change does not impact NMR and EPR investigations of inhibitor-induced conformational change. With the D25N mutation tolerated, we can discriminate between inhibitor binding modes that would not be detected in active enzyme. Resolution of the changes in relative inhibitor binding affinity also allows for interrogation of inhibitor-induced conformational shifts as a function of natural polymorphisms and drug-pressure selected mutations (de Vera, Smith, et al., 2013; Huang et al., 2012, 2014).
3. DEER DISTANCE PROFILES REFLECT THE FRACTIONAL OCCUPANCIES OF HIV-1PR CONFORMATIONAL STATES
3.1 Gaussian Reconstruction of Tikhonov Regularization Distance Profiles
In our studies, we observed differing degrees of conformational shifts to the closed state as a function of inhibitor binding (Fig. 6; Blackburn et al., 2009; Carter et al., 2014; de Vera et al., 2012; Galiano et al., 2007; Huang et al., 2012, 2014).
Figure 6.
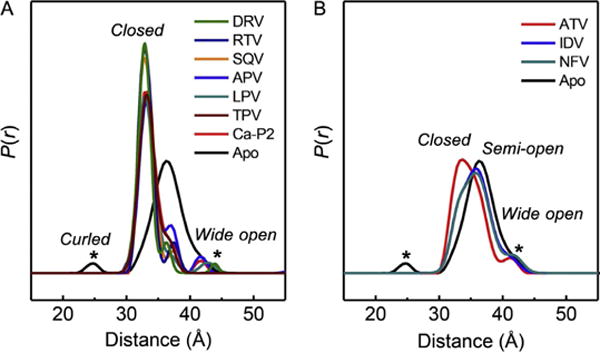
DEER distance profiles for subtype B HIV-1PR with various inhibitors. (A) These inhibitors shift the conformational sampling to predominantly the closed state at 33 Å, but residual population can be seen at 36 Å, which is the most probable distance in the apo protein, reflective of the semi-open state. (B) Distance profiles where the relative populations of the semi-open and closed states are roughly equal. Data are taken from Blackburn et al. (2009).
From these results, we developed the idea to regenerate the distance profiles as a linear combination of individual distance populations (Fig. 7). In an approach that is common in many electronic spectroscopies and computational methods, we used Gaussian-shaped distributions to model individual conformational states in the conformational landscape. In this approach, the relative percentage contribution of a given Gaussian distribution reflects of the fractional occupancy of the corresponding conformational state within the ensemble. We chose Gaussian-shaped functions based on the relative ease of use from a mathematical standpoint, as well as early observations that the MD-derived distances for HIV-1PR could be adequately fit with Gaussian shapes (Ding et al., 2008; Galiano, Ding, et al., 2009). We have used this process to characterize the interactions of FDA-approved inhibitors with various HIV-1PR constructs, such as those containing natural polymorphisms (Huang et al., 2012, 2014; Kear et al., 2009) or drug-pressure-related mutations (Carter et al., 2014; de Vera, Smith, et al., 2013; de Vera et al., 2012). Shifts in fractional occupancies of populations in DEER distance profiles suggest conformational shifts that correlate well with IC50 values for DMR769 compared to consensus subtype B (de Vera et al., 2012). The concept of fractional occupancy has also been applied to characterize differences in the conformational sampling of apo HIV-1PR. The results demonstrate how the presence of natural polymorphisms or drug-pressure-selected mutations alters the conformational landscape (Kear et al., 2009). We have also provided a mechanism for how mutations distal from the active site can impact multidrug resistance while regaining enzymatic activity by showing a correlation between shifts in conformational sampling and the evolution of secondary mutations (de Vera et al., 2012). These findings suggest a mechanism whereby secondary mutations combine to stabilize open-like conformations at the expense of the closed state. For example, the semi-open conformation is found at greater than 65% fractional occupancy in all enzymes that have near wild-type activity. Constructs that exhibit multidrug resistance have an increase in the open-like populations with a concomitant decrease in the closed-like fractional occupancy, typically to <10%.
Figure 7.
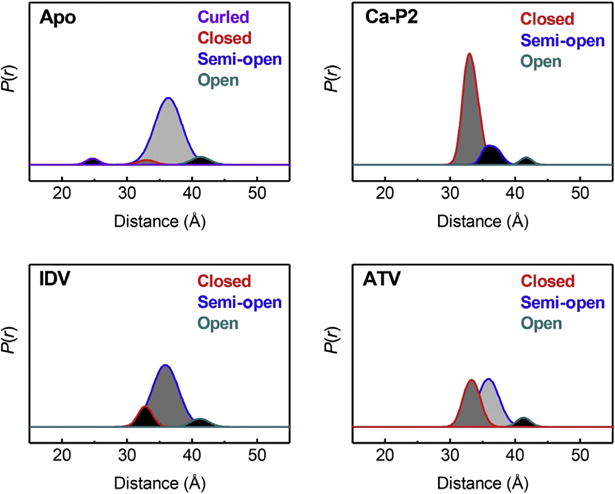
Select Gaussian reconstruction results for DEER distance profiles for subtype B HIV-1PR. “Apo” represents the protein alone, Ca-P2 is a nonhydrolyzable substrate mimic, IDV is the inhibitor Indinavir, and ATV is the inhibitor Atazanavir.
3.2 Establishing Confidence in Minor Components of DEER Distance Profiles
When characterizing HIV-1PR constructs with various drug-pressure selected mutations or natural polymorphisms we consistently observed a fourth distance in our ensemble that was not originally characterized in early MD simulations (denoted with * and labeled curled in Fig. 6) (Huang et al., 2012, 2014). We have come to describe this conformation as a “curled/tucked” state, where the flaps allow access to the active site, but where spin label distances are shortened, likely due to a more sideways opening of the flaps (Huang et al., 2012, 2014). Typically, the relative population of this novel state comprises less than 10% of the ensemble. We have also found that the relative population of the wide-open conformer varies from ~3–30% in various constructs (de Vera, Smith, et al., 2013; Kear et al., 2009). Given that both of these conformational states contribute to the “open-like” population and their mutual existence impacts how we think about motions in HIV-1PR and mechanisms of drug-resistance evolution, it is essential that we establish confidence in DEER distance profiles. Hence, we have developed error analysis procedures and population suppression algorithms for analyzing the distance profiles of HIV-1PR. The remaining sections of this chapter discuss our approach.
3.3 Statistical Analysis of DEER Distance Profiles
Given the significance of the emergence of minor populations in the DEER distance profiles in the context of our hypothesis that alterations to conformational sampling correlate with drug resistance, we set out to develop a method for translating the level of certainty in the time domain fit to a level of certainty in the minor components of the distance profiles. Scheme 1 illustrates our approach.
Scheme 1.
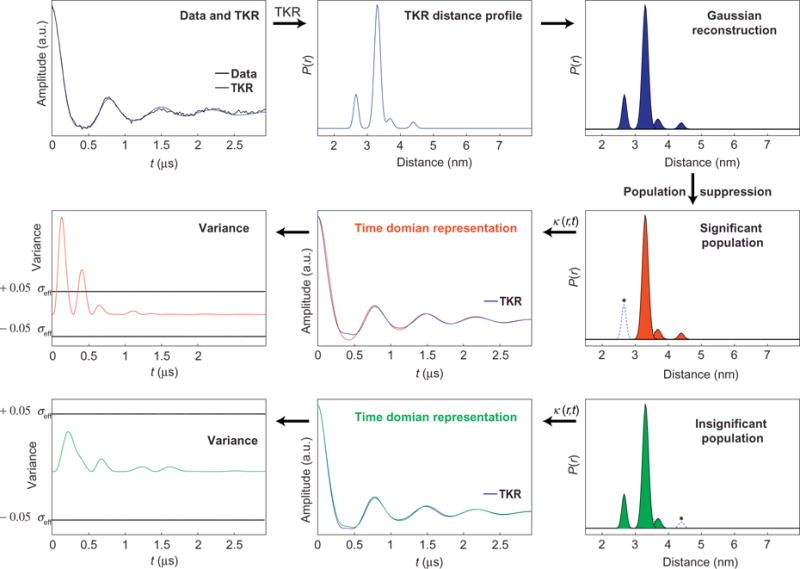
Raw DEER data are processed and fit using the DeerAnalysis software package. Tikhonov regularization is used to fit the time domain data (data and TKR) and generate distance profiles (TKR distance profile). The distance profiles are then reconstructed using a series of Gaussian functions that represent individual populations of a conformational ensemble (Gaussian reconstruction). Populations are selectively suppressed, the new altered distance profiles are transformed back to time domain (time domain representation), and the variances between these and the time domain fit from TKR are calculated (variance). The variances are compared to a threshold related to the standard deviation between the time domain data and the TKR fit and individual populations are deemed insignificant contributions to the overall distance profile only if their suppression does not extend the variance beyond the threshold.
This process presumes the following: (1) The distance profile can be reconstructed as a linear combination of Gaussian functions whose relative areas reflect the fractional occupancies of the conformational states they represent and (2) the level of confidence in the time domain fit is directly related to the standard deviation of the time domain fit relative to the time domain data, which depends on the signal-to-noise ratio (SNR). In a separate review, we discussed the use of Tikhonov regularization (TKR) to fit the time domain data to generate distance profiles and detailed the process of regenerating the time domain fit from a linear superposition of Gaussian-shaped functions (de Vera, Blackburn, et al., 2013). It is known that certain processing steps or the tendency of TKR to fit noise components in time domain data with low SNR can each introduce minor artifacts in the distance profiles (Chiang, Borbat, & Freed, 2005; Jeschke, 2002; Jeschke et al., 2004). As mentioned above, solvent deuteration or increased pulse sequence time at Q-Band can lead to similar artifacts. The following procedure is designed to assess the likelihood that certain minor components of distance profiles are artifacts, as opposed to real representations of distances between spin labels. Briefly, we suppose that the distance profile obtained from fitting the time domain data (Scheme 1 “TKR distance profile”) can be deconstructed into multiple components, which we call individual “populations,” that each corresponds to a select conformational state within the ensemble. Next, we use Gaussian-shaped functions to represent each population and reconstruct our distance profiles as a linear combination of these functions (Scheme 1 “Gaussian reconstruction”). We then suppose that certain minor populations in the reconstructed distance profile could be artifacts. A minor population is typically chosen as a population comprising <10% of the area under the sum of all populations. To assess this notion, the linear combinations of Gaussian functions are modified to suppress populations that are user defined as minor or suspect components (Scheme 1 “significant” and “insignificant” populations). Upon suppression of a population, the new modified time domain representation is compared to the original time domain fit (Scheme 1 “time domain representation”). If the variance between the two curves falls within an interval set by the standard deviation in the original time domain fit relative to the time domain data (Scheme 1 “variance”), we conclude that the population contributes insignificantly to the error in the fit to the raw data and can be suppressed. Suppression proceeds in this manner for all possible combinations of the populations; excluding the combinations in which all or none of the populations are suppressed. The combination with the lowest number of populations, that results in a time domain representation that compares to the fit within the allowed variance interval, is chosen as the “best” solution.
4. “DEERconstruct,” A TOOL FOR STATISTICAL ANALYSIS OF DEER DISTANCE PROFILES
The details of TKR methods, the best practices for processing and fitting raw DEER data to make distance profiles, and the process of regenerating time domain representations of the distance profiles have been reviewed previously (Chiang et al., 2005; de Vera, Blackburn, et al., 2013; Jeschke, 2002; Jeschke & Polyhach, 2007). For the remainder of this chapter, we will assume that the reader is at least moderately versed in common practices involved in DEER data analyses. A comprehensive tool called “DeerAnalysis” is available for processing DEER data using all of the necessary considerations (Jeschke et al., 2006). The following procedure will be presented in the context of a similar tool called “DEERconstruct,” which is designed to work in tandem with DeerAnalysis to perform the entire statistical analysis procedure. DEERconstruct can be obtained either by contacting the authors of this chapter or by visiting Matlab Central File Exchange.
4.1 Procedure
We start by defining the data to be used in the procedure. First, we define “raw data” as the time domain signal after baseline correction and truncation (see aforementioned references for details regarding data processing steps). Next, we define “fit” as the time domain trace determined from analysis of the raw data. Although this is usually obtained using TKR, our procedure applies to distance profiles obtained from any fitting method. Finally, we define the “distance profile” as the plot of amplitude versus distance obtained by transformation of the fit from time domain to distance domain. These graphs are relative intensities (P(r)) plotted as a function of distance (r); reflecting the relative contributions to the raw data from spin pairs separated by each r value.
For the following sections, the reader may find it helpful to follow along with one of the demo data sets supplied with the DEERconstruct software.
4.1.1 Step 1—Processing Data and Generating Distance Profiles
We recommend that the DEER data be processed, fit, and transformed to a distance profile using DeerAnalysis (Jeschke et al., 2006). However, DEERconstruct will accept *.dat files that contain the raw data, fit data, and distance profile generated by any means. If using DeerAnalysis the saved results include files with the original data’s filename appended with “_fit.dat” and “_distr.dat,” which contain the time domain data (raw and fit) and distance profile, respectively. For the file containing the time domain data, the first column contains the time axis, the second column contains the raw data, and the third column contains the fit data. For the file containing the distance profile, the first column contains the distance axis and the second column contains the distance profile. If processing data by a means other than DeerAnalysis, the files should be formatted accordingly for use in DEERconstruct.
4.1.2 Step 2—Transformation of the Distance Profile to a Time Domain Representation
Just as a distance profile (P(r)) can be constructed from raw data (R(t)), P(r) can be back-transformed to a time domain representation (Jeschke, Koch, Jonas, & Godt, 2002) (Scheme 1 “time domain representation”) using the following two expressions:
| (1) |
| (2) |
In Eq. (1), E(t) is the time domain representation of P(r). Eq. (2) describes k(r,t) where r are the distance points that form the x-axis of P(r), t are the time points that form the x-axis of E(t), θ are the angles relating the vectors connecting coupled electron spins to the direction of the external magnetic field (the dependence of k(r,t) on θ is often neglected and an average is taken over all θ), and c is a constant proportional to the product of the g values for the coupled electron spins. When the data files are loaded, DEERconstruct performs three tasks and plots the results:
4.1.2.1 Task 1
The distance profile P(r) is transformed to E(t) using Eqs. (1) and (2).
4.1.2.2 Task 2
Two standard deviations (σ) are calculated using the expressions,
| (3) |
| (4) |
where n is number of data points (later updated to n–N, where N is set by the number of populations in the reconstructed distance profile), σRF compares R(t) to the fit data (F(t)), and σFE compares F(t) to E(t).
4.1.2.3 Task 3
A variance threshold is set for qualifying/disqualifying modified P(r) that will be generated in subsequent steps. The magnitude of σRF is defined by the SNR of R(t), and thus directly reflects the confidence one can have in F(t). The magnitude of σFE is defined by the mathematical precision of the calculation of E(t) relative to F(t). While σFE is usually orders of magnitude less than σRF, to be thorough we use an effective standard deviation, (σeff = σRF + σFE) to set the variance threshold at ±0.05*σeff.
4.1.2.4 Optional Task 4
The user is also given the option to include the results of the “Validation” procedure offered by the DeerAnalysis software (Jeschke et al., 2006). This feature in DeerAnalysis establishes a level of uncertainty in F(t) and represents this with standard deviations assigned to each point in P(r). Similar standard deviation vectors obtained by a means other than DeerAnalysis can be arranged in the same format and incorporated in the same way. DEERconstruct uses these standard deviations to create a series of different profiles (PV(r)) such that each PV(r) is a different variation of data points in P(r), within the standard deviations determined by DeerAnalysis. Each PV(r) is transformed to time domain (Section 4.1.2.1) and compared to F(t) (Eq. 4). If this option is used, the maximum value of σ, obtained by applying Eq. (4) to the full set of PV(r), is added to σeff and the variance threshold is updated accordingly.
4.1.3 Step 3—Gaussian Reconstruction of the Distance Profile
Two options are available in DEERconstruct for reconstructing P(r) as a combination of individual Gaussian populations (pn(r)) (Scheme 1 “Gaussian reconstruction”):
4.1.3.1 Option 1
The user defines the maximum height and corresponding r value (rmax) for each pn(r) visually using mouse clicks. The relative heights are controlled numerically by a weighting factor, η, such that η = 1 for the tallest pn(r) and η for the remaining pn(r) are fractions. A function then scans through values of full width at half maximum (FWHM) for each Gaussian-shaped pn(r) and chooses the appropriate FWHMs as corresponding to the minima in sums of residuals between each pn(r) and P(r) in the regions encompassing each pn(r).
4.1.3.2 Option 2
The user enters the values for rmax, FWHM, and η manually.
Together, η and FWHM define the relative contribution of each pn(r) to the total area under P(r). With either option for reconstructing P(r) (here we will call P′(r)), DEERconstruct calculates the percentage that the area under each pn(r) contributes to the total area under P′(r) and performs tasks similar to those defined above. To recap,
4.1.3.3 Task 1
P′(r) is transformed to E′(t) (Scheme 1 “time domain representation”).
4.1.3.4 Task 2
A standard deviation (σE′E) is calculated for comparison of E′(t) to E(t).
4.1.3.5 Task 3
The variance thresholds are updated to include σE′E. If the reconstruction is acceptable, the magnitude of σE′E is on the order of σFE. The updated σeff is defined as (σeff = σRF + σFE + σE′E.
The standard deviation σE′E reflects the precision with which P(r) can be reconstructed with a linear combination of Gaussian shapes. If σE′E approaches σRF, P′(r) needs to be entirely redefined or the present P′(r) needs to be refined. For the latter, DEERconstruct allows you to attempt an optimization using least squares fitting of each individual pn(r) to P(r) in their corresponding local regions. It is advisable to employ the optimization function in any case to achieve the closest possible representation of P(r) before proceeding. However, the user may notice that such a procedure is inefficient when the pn(r) overlap significantly. For this reason, DEERconstruct offers several fitting options as well as the option to keep or discard the results of optimizations. Also included in the optimization function is the option to assume pn(r) are Lorentzian or pseudo-Vogtian shapes. In some cases, this can allow for a better graphical reconstruction of P(r) but does not alter the procedures for manipulation of P′(r) or the statistical analysis strategies.
With either option for defining pn(r), or for the optimized pn(r), the quality of P′(r) can also be improved by manually adjusting the values for rmax, FWHM, or η in the data table. The percentage contributions to the overall P′(r) are adjusted with each optimization or manual change. DEERconstruct will determine if the changes increased or decreased σE′E and ask if the user would like to accept or reject the changes.
4.1.4 Step 4—Suppressions of Populations
For this procedure, our presumption is that some components of P(r) may not be manifestations of real frequency components in R(t), but instead a by-product of the imperfect fit between F(t) and R(t), which is usually a result of lower SNR. Assuming that P′(r) is an acceptable reconstruction of P(r), we can determine the effect each pn(r) has on E′(t) by selectively removing them from P′(r) to create a modified P′(r) (here we call P′S(r)) and monitoring the variance between E′S(t) and E′(t). DEERconstruct offers three options for suppressing individual pn(r) (Scheme 1 “population suppression”):
4.1.4.1 Option 1
Manually remove the pn(r) from the data table.
4.1.4.2 Option 2
Use the button titled “Manually Suppress” and click at rmax to suppress the corresponding pn(r).
4.1.4.3 Option 3
Automatically test all combinations of suppression of pn(r) excluding the cases where all or none of the pn(r) are suppressed. This option is ideal for P(r) having several components that appear to be artifacts where one can hypothesize that more than one pn(r) can be removed simultaneously.
4.1.5 Analyzing the Suppression Combinations
When a pn(r) is suppressed, DEERconstruct recalculates the percentage contributions of the areas under each remaining pn(r) to the total area under P′S(r), calculates E′S(t), calculates the variance (v(t)) between E′(t) and E′S(t) as,
| (5) |
and calculates the standard deviation, , that compares E′(t) to E′S(t). If suppression of a pn(r) does not extend any portion of v(t) beyond the thresholds (±0.05*σeff), then it is deemed statistically insignificant. In other words, it is classified as equally likely to be the result of the imperfect fit between F(t) and R(t) as it is to be the result of a distance between pairs of spin labels in the sample. In general, the “best” solution corresponds to the combination that contains the fewest pn(r) while remaining within the variance thresholds.
4.2 Case Studies
The following examples point out common situations encountered when using DEERconstruct.
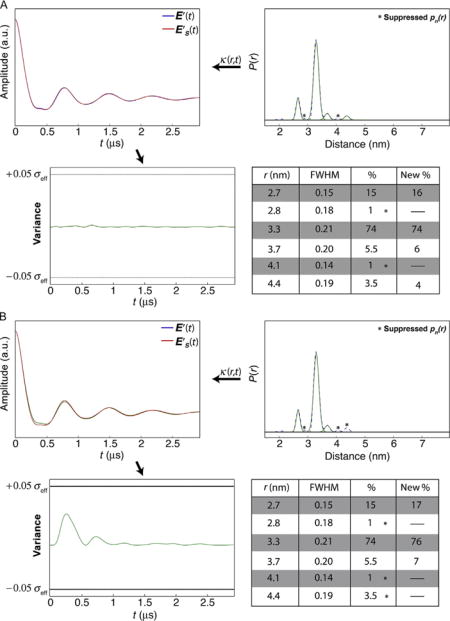
4.2.1 Case 1—Overlapping Populations
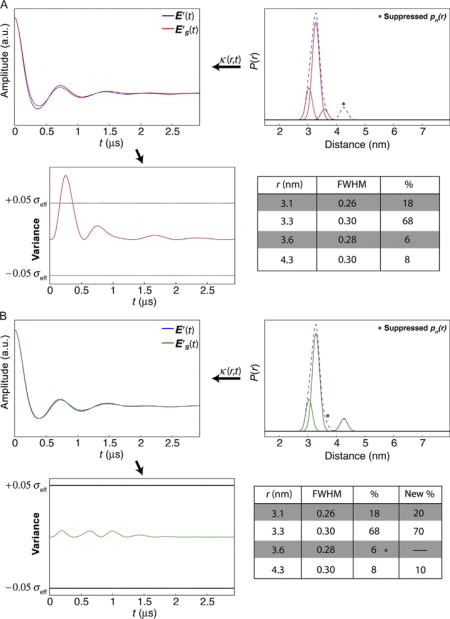
In this example, the distance profile is represented by a series of Gaussian functions, some of which overlap, and more than a single solution may exist. The profile contains four populations, two of which each account for less than 10% of the total population. One of the two minor populations overlaps appreciably with the dominant feature, whereas the other minor population is well resolved. In Panel A, the variance plots show that suppression of the pn(r) at r=4.3 nm produces variance that exceeds the ±0.05σeff threshold. This indicates that this pn(r) is a significant component of the data. In contrast, suppression of the overlapping pn(r) (r = 3.6 nm) results in variance that is within threshold, and this pn(r) can be suppressed (Panel B). Before concluding that the “best” solution contains the three populations at r = 3.1, 3.3, and 4.3 nm, the populations must be suppressed in combinations. The best solution is obtained when the minimum number of populations that regenerate the TKR data also leads to a E′S(t) that is within the variance thresholds.
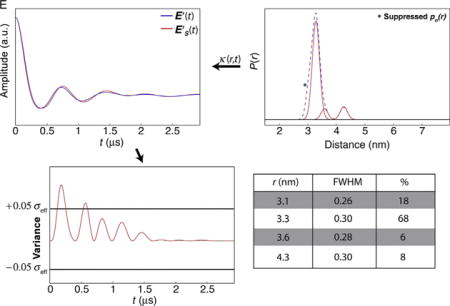
4.2.1.1 Combinations of Suppressions and Codependence of Variance
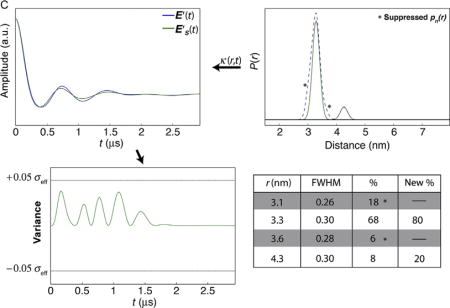
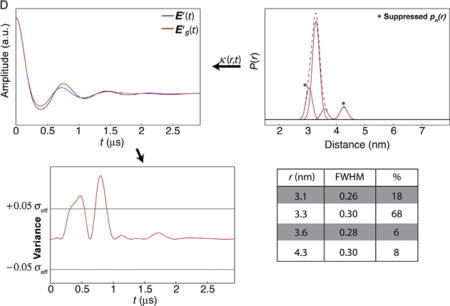
In some cases destructive interference between the variances introduced by suppressions of multiple populations damps the total variance such that individual populations cannot be suppressed within error, but combinations of pn(r) suppressions remain under the threshold. Panels C and D in Case 1 show this example. When populations at 3.1 and 3.6 nm are suppressed, the solution falls within the variance limit. However, when combining suppression of the populations at 3.1 and 4.3 nm, the variance exceeds the threshold. Interestingly, as shown in Panel E, suppressing only the pn(r) at 3.1 nm also extends the variance beyond the thresholds.
For this example, Panels B and C show solutions of pn(r) suppressions that are adequate solutions. Given that C contains only two populations, we would report this as the “best” solution.
4.2.2 Case 2—Well Resolved, Minor Components
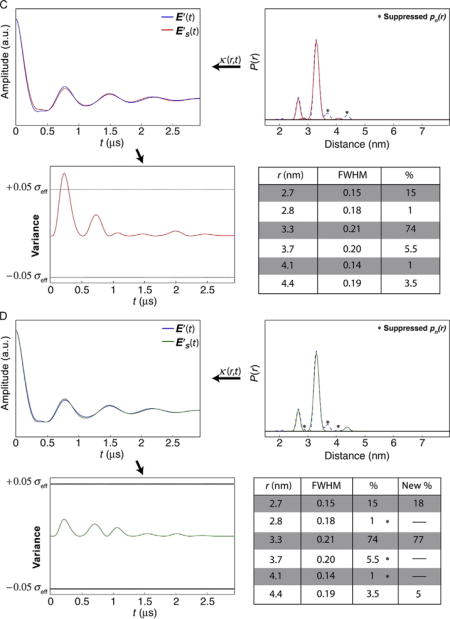
In this example, the distance profile is represented by a series of populations for which there is little overlap. For the specific case presented here, the profile contains six populations, where four represent <10% each. Panels A and B in Case 2 demonstrate how combinations of small populations (r = 2.8, 3.7, 4.1, and 4.4 nm) can be suppressed without extending the variance in the time domain representation beyond the threshold. Panel C shows an example where a particular combination of populations cannot be suppressed (r = 3.7 and 4.4 nm). Panel D shows the “best” solution result for this example.
4.2.2.1 Effects of Signal-to-Noise Ratio
The effect of low SNR is to increase the variance thresholds, thus allowing for suppression of otherwise significant populations. Panel E in Case 2 shows how the variance threshold changes as a function of SNR (10 and 50; raw data not shown).
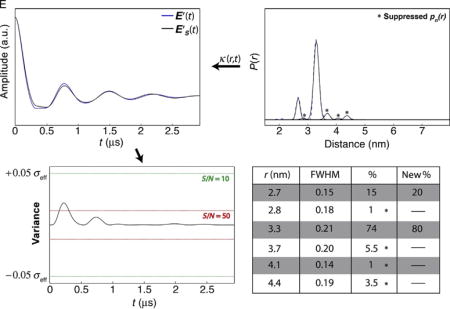
All four minor populations (r = 2.8, 3.7, 4.1, and 4.4 nm) can be suppressed when SNR = 10, but cannot be suppressed as a combination when SNR = 50. Hence, the presence of minor populations can be validated most accurately for data sets with high SNR.
4.2.3 Case 3—Profiles Extending Outside of Measurable Range
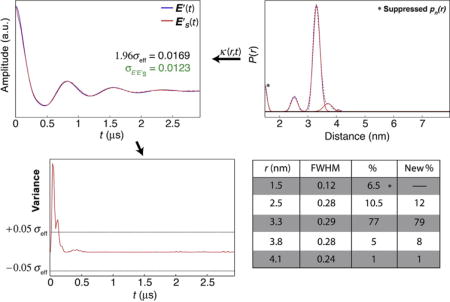
The data in this case consists of a set of five populations, one of which is centered at r = 1.5 nm; below the distance range generally accepted as measurable using DEER (Jeschke & Polyhach, 2007). This type of error usually arises from narrow artifacts near t = 0 in R(t) resulting from improper zero-time approximation or noise near zero-time. When the P′S(r) with the population at 1.5 nm removed is transformed to E′S(t), the narrow, high amplitude, artifact near t0 in E(t) is missing, leading to exaggerated variance in this region. However, because the artifact is narrow, its contribution to (which is simply the square root of the normalized sum of v(t)) is comparatively less dramatic. In these situations, analysis of the closeness of the two time domain data using offers an alternative when components that are obviously artifacts dominate the variance analysis. As this example shows, = 0:0123, which is less than 1.96σeff = 0.0169 and hence, by this criteria, suppression of the population centered at r = 1.5 nm can be accepted as a solution. While this example demonstrates a special case, analyses of suppression combinations by maximum v(t) or by generally lead to the same result.
References
- Agniswamy J, Shen CH, Aniana A, Sayer JM, Louis JM, Weber IT. HIV-1 protease with 20 mutations exhibits extreme resistance to clinical inhibitors through coordinated structural rearrangements. Biochemistry. 2012;51(13):2819–2828. doi: 10.1021/bi2018317. http://dx.doi.org/10.1021/bi2018317. [DOI] [PMC free article] [PubMed] [Google Scholar]
- Baber JL, Louis JM, Clore GM. Dependence of distance distributions derived from double electron–electron resonance pulsed EPR spectroscopy on pulse-sequence time. Angewandte Chemie (International Ed in English) 2015;54(18):5336–5339. doi: 10.1002/anie.201500640. http://dx.doi.org/10.1002/anie.201500640. [DOI] [PMC free article] [PubMed] [Google Scholar]
- Blackburn ME, Veloro AM, Fanucci GE. Monitoring inhibitor-induced conformational population shifts in HIV-1 protease by pulsed EPR spectroscopy. Biochemistry. 2009;48(37):8765–8767. doi: 10.1021/bi901201q. http://dx.doi.org/10.1021/bi901201q. [DOI] [PubMed] [Google Scholar]
- Borbat PP, Davis JH, Butcher SE, Freed JH. Measurement of large distances in biomolecules using double-quantum filtered refocused electron spin-echoes. Journal of the American Chemical Society. 2004;126(25):7746–7747. doi: 10.1021/ja049372o. http://dx.doi.org/10.1021/ja049372o. [DOI] [PubMed] [Google Scholar]
- Borbat PP, McHaourab HS, Freed JH. Protein structure determination using long-distance constraints from double-quantum coherence ESR: Study of T4 lysozyme. Journal of the American Chemical Society. 2002;124(19):5304–5314. doi: 10.1021/ja020040y. [DOI] [PubMed] [Google Scholar]
- Carter JD, Gonzales EG, Huang X, Smith AN, de Vera IMS, D’Amore PW, et al. Effects of PRE and POST therapy drug-pressure selected mutations on HIV-1 protease conformational sampling. FEBS Letters. 2014;588(17):3123–3128. doi: 10.1016/j.febslet.2014.06.051. http://dx.doi.org/10.1016/J.Febslet.2014.06.051. [DOI] [PMC free article] [PubMed] [Google Scholar]
- Casey TM, Liu ZL, Esquiaqui JM, Pirman NL, Milshteyn E, Fanucci GE. Continuous wave W- and D-Band EPR spectroscopy offer “sweet-spots” for characterizing conformational changes and dynamics in intrinsically disordered proteins. Biochemical and Biophysical Research Communications. 2014;450(1):723–728. doi: 10.1016/j.bbrc.2014.06.045. http://dx.doi.org/10.1016/J.Bbrc.2014.06.045. [DOI] [PMC free article] [PubMed] [Google Scholar]
- Chiang YW, Borbat PP, Freed JH. The determination of pair distance distributions by pulsed ESR using Tikhonov regularization. Journal of Magnetic Resonance. 2005;172(2):279–295. doi: 10.1016/j.jmr.2004.10.012. http://dx.doi.org/10.1016/J.Jmr.2004.10.012. [DOI] [PubMed] [Google Scholar]
- Columbus L, Kalai T, Jeko J, Hideg K, Hubbell WL. Molecular motion of spin labeled side chains in alpha-helices: Analysis by variation of side chain structure. Biochemistry. 2001;40(13):3828–3846. doi: 10.1021/bi002645h. [DOI] [PubMed] [Google Scholar]
- Coman RM, Robbins AH, Fernandez MA, Gilliland CT, Sochet AA, Goodenow MM, et al. The contribution of naturally occurring polymorphisms in altering the biochemical and structural characteristics of HIV-1 subtype C protease. Biochemistry. 2008;47(2):731–743. doi: 10.1021/bi7018332. http://dx.doi.org/10.1021/Bi7018332. [DOI] [PubMed] [Google Scholar]
- de Vera IMS, Blackburn ME, Fanucci GE. Correlating conformational shift induction with altered inhibitor potency in a multidrug resistant HIV-1 protease variant. Biochemistry. 2012;51(40):7813–7815. doi: 10.1021/bi301010z. http://dx.doi.org/10.1021/Bi301010z. [DOI] [PMC free article] [PubMed] [Google Scholar]
- de Vera IM, Blackburn ME, Galiano L, Fanucci GE. Pulsed EPR distance measurements in soluble proteins by site-directed spin labeling (SDSL) Current Protocols in Protein Science. 2013;74 doi: 10.1002/0471140864.ps1717s74. http://dx.doi.org/10.1002/0471140864.ps1717s74. Unit 17.17.1–17.17.29. [DOI] [PMC free article] [PubMed] [Google Scholar]
- de Vera IM, Smith AN, Dancel MC, Huang X, Dunn BM, Fanucci GE. Elucidating a relationship between conformational sampling and drug resistance in HIV-1 protease. Biochemistry. 2013;52(19):3278–3288. doi: 10.1021/bi400109d. http://dx.doi.org/10.1021/bi400109d. [DOI] [PMC free article] [PubMed] [Google Scholar]
- Ding F, Layten M, Simmerling C. Solution structure of HIV-1 protease flaps probed by comparison of molecular dynamics simulation ensembles and EPR experiments. Journal of the American Chemical Society. 2008;130(23):7184–7185. doi: 10.1021/ja800893d. http://dx.doi.org/10.1021/ja800893d. [DOI] [PMC free article] [PubMed] [Google Scholar]
- El Mkami H, Ward R, Bowman A, Owen-Hughes T, Norman DG. The spatial effect of protein deuteration on nitroxide spin-label relaxation: Implications for EPR distance measurement. Journal of Magnetic Resonance. 2014;248:36–41. doi: 10.1016/j.jmr.2014.09.010. http://dx.doi.org/10.1016/j.jmr.2014.09.010. [DOI] [PMC free article] [PubMed] [Google Scholar]
- Ermolieff J, Lin X, Tang J. Kinetic properties of saquinavir-resistant mutants of human immunodeficiency virus type 1 protease and their implications in drug resistance in vivo. Biochemistry. 1997;36(40):12364–12370. doi: 10.1021/bi971072e. http://dx.doi.org/10.1021/bi971072e. [DOI] [PubMed] [Google Scholar]
- Fanucci GE, Cafiso DS. Recent advances and applications of site-directed spin labeling. Current Opinion in Structural Biology. 2006;16(5):644–653. doi: 10.1016/j.sbi.2006.08.008. http://dx.doi.org/10.1016/j.sbi.2006.08.008. [DOI] [PubMed] [Google Scholar]
- Fanucci GE, Lee JY, Cafiso DS. Spectroscopic evidence that osmolytes used in crystallization buffers inhibit a conformation change in a membrane protein. Biochemistry. 2003;42(45):13106–13112. doi: 10.1021/bi035439t. http://dx.doi.org/10.1021/bi035439t. [DOI] [PubMed] [Google Scholar]
- Freedberg DI, Ishima R, Jacob J, Wang YX, Kustanovich I, Louis JM, et al. Rapid structural fluctuations of the free HIV protease flaps in solution: Relationship to crystal structures and comparison with predictions of dynamics calculations. Protein Science. 2002;11(2):221–232. doi: 10.1110/ps.33202. http://dx.doi.org/10.1110/ps.33202. [DOI] [PMC free article] [PubMed] [Google Scholar]
- Galiano L, Blackburn ME, Veloro AM, Bonora M, Fanucci GE. Solute effects on spin labels at an aqueous-exposed site in the flap region of HIV-1 protease. The Journal of Physical Chemistry B. 2009;113(6):1673–1680. doi: 10.1021/jp8057788. http://dx.doi.org/10.1021/jp8057788. [DOI] [PubMed] [Google Scholar]
- Galiano L, Bonora M, Fanucci GE. Interflap distances in HIV-1 protease determined by pulsed EPR measurements. Journal of the American Chemical Society. 2007;129(36):11004–11005. doi: 10.1021/ja073684k. http://dx.doi.org/10.1021/ja073684k. [DOI] [PubMed] [Google Scholar]
- Galiano L, Ding F, Veloro AM, Blackburn ME, Simmerling C, Fanucci GE. Drug pressure selected mutations in HIV-1 protease alter flap conformations. Journal of the American Chemical Society. 2009;131(2):430–431. doi: 10.1021/ja807531v. http://dx.doi.org/10.1021/ja807531v. [DOI] [PMC free article] [PubMed] [Google Scholar]
- Georgieva ER, Roy AS, Grigoryants VM, Borbat PP, Earle KA, Scholes CP, et al. Effect of freezing conditions on distances and their distributions derived from Double Electron Electron Resonance (DEER): A study of doubly-spin-labeled T4 lysozyme. Journal of Magnetic Resonance. 2012;216:69–77. doi: 10.1016/j.jmr.2012.01.004. http://dx.doi.org/10.1016/j.jmr.2012.01.004. [DOI] [PMC free article] [PubMed] [Google Scholar]
- Hong L, Zhang XC, Hartsuck JA, Tang J. Crystal structure of an in vivo HIV-1 protease mutant in complex with saquinavir: Insights into the mechanisms of drug resistance. Protein Science. 2000;9(10):1898–1904. doi: 10.1110/ps.9.10.1898. http://dx.doi.org/10.1110/ps.9.10.1898. [DOI] [PMC free article] [PubMed] [Google Scholar]
- Hornak V, Okur A, Rizzo RC, Simmerling C. HIV-1 protease flaps spontaneously close to the correct structure in simulations following manual placement of an inhibitor into the open state. Journal of the American Chemical Society. 2006a;128(9):2812–2813. doi: 10.1021/ja058211x. http://dx.doi.org/10.1021/ja058211x. [DOI] [PMC free article] [PubMed] [Google Scholar]
- Hornak V, Okur A, Rizzo RC, Simmerling C. HIV-1 protease flaps spontaneously open and reclose in molecular dynamics simulations. Proceedings of the National Academy of Sciences of the United States of America. 2006b;103(4):915–920. doi: 10.1073/pnas.0508452103. http://dx.doi.org/10.1073/pnas.0508452103. [DOI] [PMC free article] [PubMed] [Google Scholar]
- Huang X, Britto MD, Kear-Scott JL, Boone CD, Rocca JR, Simmerling C, et al. The role of select subtype polymorphisms on HIV-1 protease conformational sampling and dynamics. The Journal of Biological Chemistry. 2014;289(24):17203–17214. doi: 10.1074/jbc.M114.571836. http://dx.doi.org/10.1074/jbc.M114.571836. [DOI] [PMC free article] [PubMed] [Google Scholar]
- Huang X, de Vera IM, Veloro AM, Blackburn ME, Kear JL, Carter JD, et al. Inhibitor-induced conformational shifts and ligand-exchange dynamics for HIV-1 protease measured by pulsed EPR and NMR spectroscopy. The Journal of Physical Chemistry B. 2012;116(49):14235–14244. doi: 10.1021/jp308207h. http://dx.doi.org/10.1021/jp308207h. [DOI] [PMC free article] [PubMed] [Google Scholar]
- Huang X, de Vera IM, Veloro AM, Rocca JR, Simmerling C, Dunn BM, et al. Backbone (1)H, (1)(3)C, and (1)(5)N chemical shift assignment for HIV-1 protease subtypes and multi-drug resistant variant MDR 769. Biomolecular NMR Assignments. 2013;7(2):199–202. doi: 10.1007/s12104-012-9409-7. http://dx.doi.org/10.1007/s12104-012-9409-7. [DOI] [PMC free article] [PubMed] [Google Scholar]
- Hubbell WL, Cafiso DS, Altenbach C. Identifying conformational changes with site-directed spin labeling. Nature Structural Biology. 2000;7(9):735–739. doi: 10.1038/78956. http://dx.doi.org/10.1038/78956. [DOI] [PubMed] [Google Scholar]
- Hubbell WL, Gross A, Langen R, Lietzow MA. Recent advances in site-directed spin labeling of proteins. Current Opinion in Structural Biology. 1998;8(5):649–656. doi: 10.1016/s0959-440x(98)80158-9. [DOI] [PubMed] [Google Scholar]
- Hubbell WL, Lopez CJ, Altenbach C, Yang Z. Technological advances in site-directed spin labeling of proteins. Current Opinion in Structural Biology. 2013;23(5):725–733. doi: 10.1016/j.sbi.2013.06.008. http://dx.doi.org/10.1016/j.sbi.2013.06.008. [DOI] [PMC free article] [PubMed] [Google Scholar]
- Hubbell WL, McHaourab HS, Altenbach C, Lietzow MA. Watching proteins move using site-directed spin labeling. Structure. 1996;4(7):779–783. doi: 10.1016/s0969-2126(96)00085-8. [DOI] [PubMed] [Google Scholar]
- Ishima R, Freedberg DI, Wang YX, Louis JM, Torchia DA. Flap opening and dimer-interface flexibility in the free and inhibitor-bound HIV protease, and their implications for function. Structure. 1999;7(9):1047–1055. doi: 10.1016/s0969-2126(99)80172-5. [DOI] [PubMed] [Google Scholar]
- Ishima R, Louis JM. A diverse view of protein dynamics from NMR studies of HIV-1 protease flaps. Proteins. 2008;70(4):1408–1415. doi: 10.1002/prot.21632. http://dx.doi.org/10.1002/prot.21632. [DOI] [PubMed] [Google Scholar]
- Ishima R, Torchia DA. Extending the range of amide proton relaxation dispersion experiments in proteins using a constant-time relaxation-compensated CPMG approach. Journal of Biomolecular NMR. 2003;25(3):243–248. doi: 10.1023/a:1022851228405. [DOI] [PubMed] [Google Scholar]
- Jeschke G. Distance measurements in the nanometer range by pulse EPR. Chemphyschem. 2002;3(11):927–932. doi: 10.1002/1439-7641(20021115)3:11<927::AID-CPHC927>3.0.CO;2-Q. http://dx.doi.org/10.1002/1439-7641(20021115)3:11<927∷AID-CPHC927>3.0.CO;2-Q. [DOI] [PubMed] [Google Scholar]
- Jeschke G, Chechik V, Ionita P, Godt A, Zimmermann H, Banham J, et al. DeerAnalysis2006—A comprehensive software package for analyzing pulsed ELDOR data. Applied Magnetic Resonance. 2006;30(3–4):473–498. http://dx.doi.org/10.1007/Bf03166213. [Google Scholar]
- Jeschke G, Koch A, Jonas U, Godt A. Direct conversion of EPR dipolar time evolution data to distance distributions. Journal of Magnetic Resonance. 2002;155(1):72–82. doi: 10.1006/jmre.2001.2498. http://dx.doi.org/10.1006/Jmre.2001.2498. [DOI] [PubMed] [Google Scholar]
- Jeschke G, Panek G, Godt A, Bender A, Paulsen H. Data analysis procedures for pulse ELDOR measurements of broad distance distributions. Applied Magnetic Resonance. 2004;26(1–2):223–244. http://dx.doi.org/10.1007/Bf03166574. [Google Scholar]
- Jeschke G, Polyhach Y. Distance measurements on spin-labelled bio-macromolecules by pulsed electron paramagnetic resonance. Physical Chemistry Chemical Physics. 2007;9(16):1895–1910. doi: 10.1039/b614920k. http://dx.doi.org/10.1039/B614920k. [DOI] [PubMed] [Google Scholar]
- Joint United Nations Programme on HIV/AIDS. Global report: UNAIDS report on the global AIDS epidemic. Geneva, Switzerland: Joint United Nations Programme on HIV/AIDS; 2010. p. v. [Google Scholar]
- Katoh E, Louis JM, Yamazaki T, Gronenborn AM, Torchia DA, Ishima R. A solution NMR study of the binding kinetics and the internal dynamics of an HIV-1 protease-substrate complex. Protein Science. 2003;12(7):1376–1385. doi: 10.1110/ps.0300703. http://dx.doi.org/10.1110/Ps.0300703. [DOI] [PMC free article] [PubMed] [Google Scholar]
- Kear JL, Blackburn ME, Veloro AM, Dunn BM, Fanucci GE. Subtype polymorphisms among HIV-1 protease variants confer altered flap conformations and flexibility. Journal of the American Chemical Society. 2009;131(41):14650–14651. doi: 10.1021/ja907088a. http://dx.doi.org/10.1021/Ja907088a. [DOI] [PMC free article] [PubMed] [Google Scholar]
- Kim M, Xu Q, Fanucci GE, Cafiso DS. Solutes modify a conformational transition in a membrane transport protein. Biophysical Journal. 2006;90(8):2922–2929. doi: 10.1529/biophysj.105.078246. http://dx.doi.org/10.1529/Biophysj.105.078246. [DOI] [PMC free article] [PubMed] [Google Scholar]
- Kim M, Xu Q, Murray D, Cafiso DS. Solutes alter the conformation of the ligand binding loops in outer membrane transporters. Biochemistry. 2008;47(2):670–679. doi: 10.1021/bi7016415. http://dx.doi.org/10.1021/Bi7016415. [DOI] [PubMed] [Google Scholar]
- Louis JM, Ishima R, Torchia DA, Weber IT. HIV-1 protease: Structure, dynamics, and inhibition. Advances in Pharmacology. 2007;55:261–298. doi: 10.1016/S1054-3589(07)55008-8. http://dx.doi.org/10.1016/S1054-3589(07)55008-8. [DOI] [PubMed] [Google Scholar]
- Martin P, Vickrey JF, Proteasa G, Jimenez YL, Wawrzak Z, Winters MA, et al. “Wide-open” 1.3 A structure of a multidrug-resistant HIV-1 protease as a drug target. Structure. 2005;13(12):1887–1895. doi: 10.1016/j.str.2005.11.005. http://dx.doi.org/10.1016/j.str.2005.11.005. [DOI] [PubMed] [Google Scholar]
- Martinez-Cajas JL, Pai NP, Klein MB, Wainberg MA. Differences in resistance mutations among HIV-1 non-subtype B infections: A systematic review of evidence (1996–2008) Journal of the International AIDS Society. 2009;12:11. doi: 10.1186/1758-2652-12-11. http://dx.doi.org/10.1186/1758-2652-12-11. [DOI] [PMC free article] [PubMed] [Google Scholar]
- Martinez-Cajas JL, Pant-Pai N, Klein MB, Wainberg MA. Role of genetic diversity amongst HIV-1 non-B subtypes in drug resistance: A systematic review of virologic and biochemical evidence. AIDS Reviews. 2008;10(4):212–223. [PubMed] [Google Scholar]
- Martinez-Cajas JL, Wainberg MA. Protease inhibitor resistance in HIV-infected patients: Molecular and clinical perspectives. Antiviral Research. 2007;76(3):203–221. doi: 10.1016/j.antiviral.2007.06.010. http://dx.doi.org/10.1016/j.antiviral.2007.06.010. [DOI] [PubMed] [Google Scholar]
- McHaourab HS, Lietzow MA, Hideg K, Hubbell WL. Motion of spin-labeled side chains in T4 lysozyme. Correlation with protein structure and dynamics. Biochemistry. 1996;35(24):7692–7704. doi: 10.1021/bi960482k. http://dx.doi.org/10.1021/bi960482k. [DOI] [PubMed] [Google Scholar]
- Pannier M, Veit S, Godt A, Jeschke G, Spiess HW. Dead-time free measurement of dipole-dipole interactions between electron spins. Journal of Magnetic Resonance. 2000;142(2):331–340. doi: 10.1006/jmre.1999.1944. http://dx.doi.org/10.1006/jmre.1999.1944. [DOI] [PubMed] [Google Scholar]
- Robbins AH, Coman RM, Bracho-Sanchez E, Fernandez MA, Gilliland CT, Li M, et al. Structure of the unbound form of HIV-1 subtype A protease: Comparison with unbound forms of proteases from other HIV subtypes. Acta Crystallographica Section D: Biological Crystallography. 2010;66(Pt. 3):233–242. doi: 10.1107/S0907444909054298. http://dx.doi.org/10.1107/S0907444909054298. [DOI] [PMC free article] [PubMed] [Google Scholar]
- Sadiq SK, De Fabritiis G. Explicit solvent dynamics and energetics of HIV-1 protease flap opening and closing. Proteins. 2010;78(14):2873–2885. doi: 10.1002/prot.22806. http://dx.doi.org/10.1002/prot.22806. [DOI] [PubMed] [Google Scholar]
- Saen-oon S, Aruksakunwong O, Wittayanarakul K, Sompornpisut P, Hannongbua S. Insight into analysis of interactions of saquinavir with HIV-1 protease in comparison between the wild-type and G48V and G48V/L90M mutants based on QM and QM/MM calculations. Journal of Molecular Graphics & Modelling. 2007;26(4):720–727. doi: 10.1016/j.jmgm.2007.04.009. http://dx.doi.org/10.1016/j.jmgm.2007.04.009. [DOI] [PubMed] [Google Scholar]
- Shao W, Everitt L, Manchester M, Loeb DD, Hutchison CA, 3rd, Swanstrom R. Sequence requirements of the HIV-1 protease flap region determined by saturation mutagenesis and kinetic analysis of flap mutants. Proceedings of the National Academy of Sciences of the United States of America. 1997;94(6):2243–2248. doi: 10.1073/pnas.94.6.2243. [DOI] [PMC free article] [PubMed] [Google Scholar]
- Torbeev VY, Raghuraman H, Hamelberg D, Tonelli M, Westler WM, Perozo E, et al. Protein conformational dynamics in the mechanism of HIV-1 protease catalysis. Proceedings of the National Academy of Sciences of the United States of America. 2011;108(52):20982–20987. doi: 10.1073/pnas.1111202108. http://dx.doi.org/10.1073/pnas.1111202108. [DOI] [PMC free article] [PubMed] [Google Scholar]
- Torbeev VY, Raghuraman H, Mandal K, Senapati S, Perozo E, Kent SB. Dynamics of “flap” structures in three HIV-1 protease/inhibitor complexes probed by total chemical synthesis and pulse-EPR spectroscopy. Journal of the American Chemical Society. 2009;131(3):884–885. doi: 10.1021/ja806526z. http://dx.doi.org/10.1021/ja806526z. [DOI] [PubMed] [Google Scholar]
- Weber IT, Agniswamy J, Fu G, Shen CH, Harrison RW. Reaction intermediates discovered in crystal structures of enzymes. Advances in Protein Chemistry and Structural Biology. 2012;87:57–86. doi: 10.1016/B978-0-12-398312-1.00003-2. http://dx.doi.org/10.1016/B978-0-12-398312-1.00003-2. [DOI] [PubMed] [Google Scholar]
- Wittayanarakul K, Aruksakunwong O, Saen-oon S, Chantratita W, Parasuk V, Sompornpisut P, et al. Insights into saquinavir resistance in the G48V HIV-1 protease: Quantum calculations and molecular dynamic simulations. Biophysical Journal. 2005;88(2):867–879. doi: 10.1529/biophysj.104.046110. http://dx.doi.org/10.1529/biophysj.104.046110. [DOI] [PMC free article] [PubMed] [Google Scholar]
- Wlodawer A, Gustchina A. Structural and biochemical studies of retroviral proteases. Biochimica et Biophysica Acta. 2000;1477(1–2):16–34. doi: 10.1016/s0167-4838(99)00267-8. [DOI] [PubMed] [Google Scholar]
- Wlodawer A, Vondrasek J. Inhibitors of HIV-1 protease: A major success of structure-assisted drug design. Annual Review of Biophysics and Biomolecular Structure. 1998;27:249–284. doi: 10.1146/annurev.biophys.27.1.249. http://dx.doi.org/10.1146/annurev.biophys.27.1.249. [DOI] [PubMed] [Google Scholar]
- Zhang Z, Fleissner MR, Tipikin DS, Liang Z, Moscicki JK, Earle KA, et al. Multifrequency electron spin resonance study of the dynamics of spin labeled T4 lysozyme. The Journal of Physical Chemistry B. 2010;114(16):5503–5521. doi: 10.1021/jp910606h. http://dx.doi.org/10.1021/jp910606h. [DOI] [PMC free article] [PubMed] [Google Scholar]