

Abstract
Welders are exposed to high concentrations of nanoparticles. Compared to larger particles, nanoparticles have been associated with more toxic effects at the cellular level, including the generation of more reactive oxygen species activity. Current methods for welding-fume aerosol exposures do not differentiate between the nano-fraction and the larger particles. The objectives of this work are to establish a method to estimate the respiratory deposition of the nano-fraction of selected metals in welding fumes and test this method in a laboratory setting. Manganese (Mn), Nickel (Ni), Chromium (Cr), and hexavalent chromium (Cr(VI)) are commonly found in welding fume aerosols and have been linked with severe adverse health outcomes. Inductively coupled plasma mass spectrometry (ICP-MS) and ion chromatography (IC) were evaluated as methods for analyzing the content of Mn, Ni, Cr, and Cr(VI) nanoparticles in welding fumes collected with nanoparticle respiratory deposition (NRD) samplers. NRD samplers collect nanoparticles at deposition efficiencies that closely resemble physiological deposition in the respiratory tract. The limits of detection (LODs) and quantitation (LOQs) for ICP-MS and IC were determined analytically. Mild and stainless steel welding fumes generated with a robotic welder were collected with NRD samplers inside a chamber. LODs (LOQs) for Mn, Ni, Cr, and Cr(VI) were 1.3 μg (4.43 μg), 0.4 μg (1.14 μg), 1.1 μg (3.33 μg), and 0.4 μg (1.42 μg), respectively. Recovery of spiked samples and certified welding fume reference material was greater than 95%. When testing the method, the average percentage of total mass concentrations collected by the NRD samplers was ~30% for Mn, ~50% for Cr, and ~60% for Ni, indicating that a large fraction of the metals may lie in the nanoparticle fraction. This knowledge is critical to the development of toxicological studies aimed at finding links between exposure to welding fume nanoparticles and adverse health effects. Future work will involve the validation of the method in workplace settings.
[Supplementary materials are available for this article. Go to the publisher’s online edition of Journal of Occupational and Environmental Hygiene for the following free supplemental resource: Digestion, extraction, and analysis procedures for nylon mesh screens.]
Keywords: Welding fumes, nanoparticles, hexavalent chromium, manganese, nickel, stainless steel, particle deposition, NRD sampler
INTRODUCTION
The U.S. Department of Labor reports that over 300,000 full-time workers in the United States are involved in welding processes.(1) Globally, this figure exceeds over two million workers. Welders are a heterogeneous working population, employed in a number of settings that include open, well-ventilated spaces (e.g., outdoor construction sites) or confined, poorly ventilated spaces (e.g., ship hulls, building crawl spaces, and pipelines).
Gas metal arc welding, also known as metal inert gas (MIG) welding, is a commonly used welding process that produces gaseous and aerosol byproducts composed of metal, metal oxides, and other volatilized chemical species with high fume formation rates.(2,3) The hot, supersaturated metal vapors formed during welding processes undergo condensation and coagulation upon being cooled to ambient temperatures. Welding fumes often form chain aggregates, which may also agglomerate, with sizes ranging 0.05–20 μm that are made of individual primary particles in the nanoscale, thus fitting the International Organization for Standards (ISO) definition for incidental nanomaterials.(4) Welding fume number size distributions are dominated by fine (<2.0 μm) and ultrafine (<100 nm) particles. Ultrafine particles in large concentration tend to coagulate rapidly with each other and with larger particles.(5) The close proximity of the welder to the source, however, exposes the operator to high concentrations of nanoparticles.(6)
Exposure to high concentrations of aerosolized fine and ultrafine metal particles, including Mn, Cr, and Ni generated during welding may elicit adverse health effects.(7,8) Animal and epidemiological studies have associated welding and some welding processes with a wide range of adverse health effects, including upper respiratory effects (rhinitis and laryngitis), pulmonary effects (pneumonitis, chronic bronchitis, decreased pulmonary function), potential neurological disorders (manganese-induced Parkinsonism), and high lung-cancer and pneumoconiosis death rates.(9–12) Specifically, hexavalent chromium has been associated with lung cancer and asthma, and manganese has been associated with neurological diseases.(13–16)
Welding fume is dominated by incidental nanoparticles (particles with any external dimension in the nanoscale).(4) Current animal and epidemiological studies investigate exposure to welding fumes without differentiating between nanoparticles and larger particles.(17) However, a stronger association has been found between adverse health and cellular effects and inhalation of nanoparticles compared to larger particles of the same composition.(18–21) Welding fume nanoparticles have been found to induce more toxic effects at the cellular level and to generate more reactive oxygen species (ROS) activity when compared to larger particles.(8)
Aerosol sampling methods generally specify the collection of workplace air samples using 37-mm closed face cassettes (total samplers).(22) These exposure assessment methods, as well as the use of respirable and inhalable samplers, are inadequate for measurements of nanoparticle exposure when paired with gravimetric analysis. Large particles (>1 μm) weigh substantially more than nanoparticles typical of fumes and, consequently, obscure the ability to detect nanoparticles through gravimetric filter sampling.(23) Additionally, most size-selective samplers collect all particles in the fraction of aerosol that can penetrate into the respiratory tract. Particle deposition, which is governed by the principles of impaction, interception, and diffusion, is typically overestimated by these samplers. There is a need to measure welding fume nanoparticle airborne concentrations apart from larger particles. Few studies,(6,24–27) however, have specifically and systematically analyzed welding fume nanoparticles separately from larger particles.
The question of whether a sampler’s collection characteristics should be based on penetration or deposition has been discussed previously, including during the process of developing unified size-selective sampling conventions.(28) Soderholm defended the use of penetration in previous discussion.(29) However, he also pointed out that the best application for a deposition based sampler is likely to include nonhygroscopic submicron particles including welding metal fumes.
This study develops a method to collect, recover, and analyze Cr, Cr(VI), Mn, and Ni nanoparticles generated during welding, separately from larger particles. These specific elements were selected because they are commonly found in aerosols generated during metal inert gas welding of mild and stainless steel and have been linked with severe health outcomes.(3,7,30,31) Moreover, the proposed method is novel because it approaches exposure assessment of these metals from a dose-estimation perspective rather than a particle-penetration perspective. This is accomplished with the use of a nanoparticle respiratory deposition sampler (NRD) that selectively collects nanoparticles similar to their typical deposition in the human respiratory tract.(32,33) The constant motion of nanoparticles causes them to diffuse and potentially deposit in all regions of the respiratory tract, from the head airways to the deep alveolar region, as described by the International Commission on Radiological Protection (ICRP).(34) The NRD sampler was designed to follow a nanoparticulate matter (NPM) deposition curve based on the ICRP model for deposition of particles smaller than 300 nm (the minimum deposition for submicrometer particles) while removing the larger particles.(32) The NPM fraction collects on the diffusion media of the NRD sampler and can be recovered and chemically analyzed. The limits of detection and quantitation for chemical analysis of the NRD sampler’s diffusion media need to be identified.
Size-selective samplers (respirable, thoracic, and inhalable) mimic particle penetration rather than particle deposition. The proposed method, however, approaches exposure assessment from a deposition estimation perspective and provides a more relevant and physiological procedure for measuring actual hazards to welders posed by nanoparticle exposure. This knowledge is critical to the development of toxicological studies aimed at finding links between deposition to welding fume nanoparticles and adverse health effects.
The objectives of this study were to establish a method to analyze the content of total Cr, Cr(VI), Mn, and Ni in welding fumes collected on the diffusion media of NRD samplers, establish LODs, LOQs, and percent recovery for these metals, and test the method in a laboratory setting.
METHODS
Nanoparticle collection was achieved with NRD samplers. The NRD sampler is shown in Figure 1 and described in detail by Cena et al.(32) It consists of a respirable cyclone (to remove particles >10 μm), an inertial impactor (to remove particles >300 nm), and a diffusion stage where nanoparticles are collected for subsequent analysis. The diffusion media consists of eight 25-mm hydrophilic nylon mesh screens with 11-μm pore size and 6% porosity (model NY1102500, Millipore Inc., Billerica, Mass.). The eight screens are digested together and analyzed by inductively coupled plasma mass spectroscopy (ICP/MS) for total Cr, Ni, and Mn and by ion chromatography (IC) for Cr(VI). Digestion, extraction, and analysis procedures are described in the supplementary material. The limit of detection (LOD) and the limit of quantitation (LOQ) for the ICP/MS and IC analysis of the aforementioned metals were established in this work. Particles deposited on the set of eight nylon screens of the NRD sampler represent the particles collected in the respiratory system according to the NPM deposition curve (Figure 1). The welding fume aerosol was generated from stainless steel and mild steel gas metal arc welding (GMAW) in a laboratory setting.
FIGURE 1.
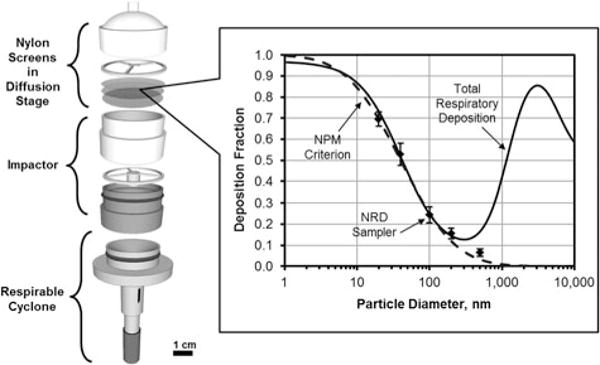
Components of the NRD sampler, NPM sampling criterion, ICRP total respiratory deposition and effective deposition of the NRD diffusion stage. Reprinted (adapted) with permission from Cena, L.G., T.R. Anthony, and T.M. Peters: A personal nanoparticle respiratory deposition (NRD) sampler. Environ Sci Technol 45(15):6483–6490 (2011). Copyright 2011, American Chemical Society.
Establishing LOD and LOQ
To determine the LOD and LOQ of the nylon screens, we followed the standard operating procedure established by NIOSH SOP 504.(35) The procedure recommends the selection of the largest LOD obtained from two methods. The first method consists of calculating the value 3σb above the mean blank signal, where σb represents the standard deviation of the blank signal. The second method uses low-level analyte responses as an estimate of σb. The LOQ is calculated as the largest of the mean blank signal plus 10σb or the mass above which recovery is greater than or equal to 75%.
For the first method, 20 sets of eight, blank nylon screens were digested and analyzed by ICP/MS for Cr, Ni, and Mn. A set of eight nylon screens was digested and analyzed as one individual collection medium because the diffusion stage of the NRD sampler consists of eight nylon screens that when analyzed together represent the particles collected in the respiratory system.
For the second method we prepared six low-level calibration standards, spiked on nylon screens, to cover the range from less than the LOD obtained from the media blanks, to no greater than ten times the media blank’s LOD. The low-level calibration standards were analyzed by ICP/MS. The responses on the low-level calibration standards were graphed versus the mass of analyte and the linear regression (Y = mX+b) and predicted responses (Ŷi) at each analyte mass (X) were obtained. The standard error of the regression was calculated as sy = [Σ(Ŷi−Yi)2/(N−1)]1/2, where N is the number of low-level calibration standards.(36) The LOD was then calculated as LOD = 3sy/m, where m is the slope of the regression line. Subsequently, the LOQ was calculated as LOQ = 3.33×LOD.
Several sets of blank nylon screens were also analyzed by IC for Cr(VI). No traces of Cr(VI) were detected from the blank screens. Eight sets of screens were then spiked with low-level Cr(VI) standard spanning from 0.2 to 2 μg and analyzed by IC. The linear regression and standard error of the responses were obtained and the LOD and LOQ were calculated.
Evaluation of Method Over a Range of Concentrations
To evaluate the digestion and analysis method, we spiked the nylon screens with amounts estimated from welding-fume-nanoparticle loads of the NRD sampler. These loads were obtained from preliminary trials and were estimated as 0.3 mg/m3 for Cr, 0.03 mg/m3 for Cr(VI), 0.1 mg/m3 for Mn, and 0.06 mg/m3 for Ni. Several sets of nylon screens were spiked with amounts of Cr, Ni, and Mn to cover a range of concentrations as low as 0.1 times the estimated loads. Each set was spiked with one element only. At the upper range of the load levels, five replicates of nylon screen stacks were spiked and analyzed. The spikes were performed with ICP/MS standards in 2% HNO3 (Claritas PPT Grade Standards; Spex CertiPrep, Metuchen, N.J.) in the following amounts: 1–20 μg of Cr, 0.3–4 μg of Ni, and 1–10 μg of Mn. The Cr(VI) standard was 1–2 μg of K2Cr2O7 in water (Product # 2095-4; Ricca Chemical Company, Arlington, Texas) spiked on three independent replicates of nylon screen stacks. Each replicate was analyzed on a separate day with fresh calibration standards. Estimated percent recovery was calculated according to the following formula:
| (1) |
The percent recoveries for each element were then averaged and standard deviations were calculated.
To further test the ability of this method of recovering welding fumes, stainless steel welding fume reference material was obtained (SSWF-1; Health and Safety Laboratory, Harpur Hill, Buxton, Derbyshire, U.K.) and prepared according to the manufacturer’s instructions. Approximately 30 mg of welding fume reference material was weighed in quartz crucibles and dried overnight in an oven at 95 °C. The dry material was subsequently subdivided into three clean crucibles and weighed, resulting in approximately 10 mg per crucible. The content of each crucible was transferred into Teflon tubes and the crucibles were rinsed with 10 ml HNO3. The welding fumes were then microwave-digested and analyzed by ICP-MS. The percent recovery for each element was calculated with Eq. 1. The amount of analyte spiked on the samples was calculated using the certified values for Cr, Mn, and Ni provided by the manufacturer of the reference material. Averages and standard deviations of the three replicates were obtained.
Experimental Setup and Sampling
The experimental setup for generation and collection of welding fume aerosols is shown in Figure 2. Seven NRD samplers were mounted on a robotic welding arm located in a chamber measuring 2.5 m (width) by 3.5 m (depth) by 2.7 m (height) with filtered air supplies. The NRD samplers were attached to a metal ring with 20-cm radius wrapped around the robotic arm at a height of approximately 20 cm from the arc. The samplers were operated at 2.5×10⁻³ m3/min (2.5 L/min) with the sampling pumps (Model 224-PCXR8; SKC Inc., Eighty Four, Pa.) located outside the chamber. The flow rate of each pump was calibrated prior and post sampling. The robotic arm was equipped with an automatic wire feeder and was capable of performing virtually continuous welding lines on metal plates as described by Antonini et al.(37)
FIGURE 2.
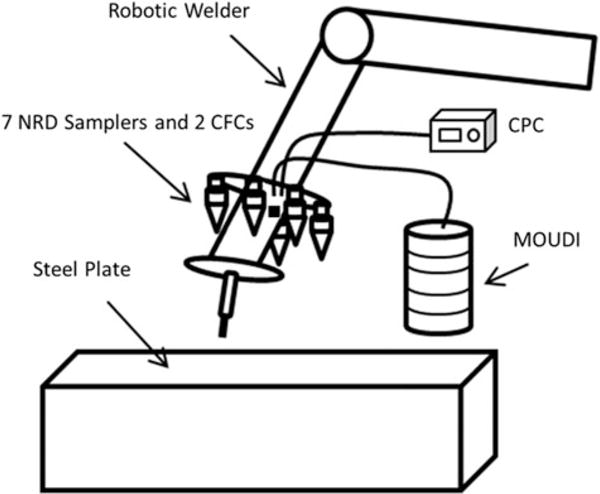
Experimental Setup. NRD = nanoparticle respiratory deposition; CFCs = closed face cassettes; CPC = condensation particle counter; MOUDI = micro orifice uniform deposition impactor.
A micro-orifice uniform deposition impactor (MOUDI, Model 110; MSP Corporation, Shoreview, Minn.) and a Nano-MOUDI (Model 115; MSP Corporation, Shoreview, Minn.) were combined and located inside the welding chamber. The combination of the two MOUDI impactors allowed collection of particles in the size range from 0.01 μm to 18 μm separated in 15 fractions, providing measurements of particle distribution by size. The MOUDI stages consisted of 47-mm PVC membrane filters (Item No. FPVC547; Zefon International, Inc., Ocala, Fla.). The inlet of the MOUDI was located on the front side of the robotic arm, in the same general location as the NRD samplers and consisted of a 2-m conductive tubing with 0.64 cm (1/4 inch) inner diameter. Clean air was also supplied using an aerosol mixer (In-Tox products, Moriarty, N.M.) at 2.0 × 10⁻² m3/min (20 L/min) to the MOUDI for dilution purposes, thus avoiding overload of some of the stages, providing an aerosol to clean air ratio of 1 to 2. A condensation particle counter (CPC, Model 3007; TSI, Inc., Shoreview, Minn.), with the inlet near the NRD samplers, was used to monitor the inter-day fluctuation in nanoparticle number concentrations. To dilute the nanoparticle concentration to levels below the maximum concentration range for the CPC, a HEPA filter (12144; Gelman Sciences, Ann Arbor, Mich.) with a 0.15-cm hole drilled into its end cap was connected to the inlet of the CPC as described by Peters et al.(38)
Some losses were expected within the MOUDI stages and sampling lines, therefore for comparison purposes total mass concentrations were obtained for three of the stainless steel runs using two 37-mm closed-face cassettes (CFCs) with ACCU-CAP PVC inserts (cassettes: 225-2LF; inserts: 225-8516GLA; SKC Inc., Eighty Four, Pa.) operated at 2.0 × 10⁻³ m3/min (2.0 L/min). Similarly, filter samples for total metal analysis were collected using two 37-mm closed-face cassettes with SOLU-SERT inserts (CLCL-C3750; Air Sampling Devices, Milford, N.H.) at 2.0×10⁻³ m3/min. The CFCs were attached to the metal ring and located adjacent to the NRDs in the front section of the robotic arm. The cassette inserts were used to ensure compliance with NIOSH analytical policies.(39)
Four experimental repetitions were conducted for GMAW of (a) T304 stainless steel plates with stainless steel wire (308LSi; Lincoln Electric, Cleveland, Ohio) and (b) A36 mild steel plates with mild steel wire (ER70S-3; Lincoln Electric, Cleveland, Ohio). Compositions of the base material and electrodes are presented in Table I. The wire was fed at a rate of 12.7 cm/sec (300 inches per min) and the welder was operated at 25.5 volts and 220 amps. These parameters are common for spray-mode (horizontal) welding. The shield gas was 98% Argon, 2% CO2 at 1.13 m3/hr (40 ft3/hr). Particle concentrations were allowed to stabilize in the chamber for 3 min before activating the sampling devices. To ensure sufficient mass collection above the analytical LOD for each element under investigation, samples were collected for 40–50 min.
TABLE I.
Wt-% Composition of Base Materials and Electrodes
| Element | A36 Mild Steel | ER70S-3 Wire | T304 Stainless Steel | 308LSi Wire |
|---|---|---|---|---|
| Mn | 0.7 | 1.16 | 2.0 | 1.8 |
| Cr | 0.06 | 0.05 | 18.0 | 20.8 |
| Ni | 0.1 | 0.04 | 8.0 | 9.8 |
For each stainless steel experimental repetition, a set of three NRD samplers was randomly selected for ICP-MS analysis, a second set of three samplers was selected for IC analysis, and the remaining sampler was set aside for scanning electron microscopy to ensure that no clogging of the nylon screen mesh had occurred. For mild steel, six samplers from each experimental repetition were analyzed by ICP/MS and one by microscopy. The MOUDI stages and PVC ACCU-CAP inserts were weighed before and after sampling for gravimetric analysis. Weighing took place in a controlled humidity and temperature environment where the filters were allowed to acclimate for a period of at least 24 hr. Prior to weighing, the electrostatic charges on the filters were neutralized using a U ionizer (PRX-U; HAUG GmbH & Co.KG, Leinfelden-Echterdingen, Germany) and the filters were then placed on a microbalance with precision to 0.1 μg (XP6U; Mettler-Toledo, Columbus, Ohio). The limit of detection (LOD) for the gravimetric analysis was 21.2 μg while the limit of quantitation (LOQ) was 70.6 μg. The SOLU-SERT inserts were analyzed by ICP-MS for total Cr, Mn, and Ni.
RESULTS
LOD and LOQ
The results of the LOD and LOQ calculations from the screen blanks and low-level spikes are reported in Table II. The calculated LODs found with screen blanks were 1.1 μg/set for Cr, 0.4 μg/set for Ni, and 1.3 μg/set for Mn. No traces of Cr(VI) were detected from the blank screens. The LODs from the low-level spikes were 0.8 μg/set for Cr, 0.4 μg/set for Cr(VI), 0.3 μg/set for Ni, and 0.4 μg/set for Mn. The LOQs calculated with screen blanks were 3.33 μg/set for Cr, 1.14 μg/set for Ni, and 4.43 μg/set for Mn. The LOQs from the low-level spikes were 2.60 μg/set for Cr, 1.42 μg/set for Cr(VI), 0.83 μg/set for Ni, and 1.43 μg/set for Mn. With the exception of Mn, the LODs and LOQs obtained from the two methods were very similar.
TABLE II.
Average Percent Recovery and Limits of Detection (LOD) and Quantitation (LOQ) for Chromium, Nickel And Manganese Using ICP-MS, and Hexavalent Chromium Using IC
| Metals | Blanks LOD [μg/8 screens] | Blanks LOQ [μg/8 screens] | Low-Level LOD [μg/8 screens] | Low-Level LOQ [μg/8 screens] | Average% RecoveryB |
|---|---|---|---|---|---|
| Total Cr | 1.1 | 3.33 | 0.8 | 2.60 | 102% ± 2% |
| Cr(VI) | A | A | 0.4 | 1.42 | 97% ± 3% |
| Ni | 0.4 | 1.14 | 0.3 | 0.83 | 103% ± 3% |
| Mn | 1.3 | 4.43 | 0.4 | 1.43 | 100% ± 3% |
Undetected.
Samples spiked with metals in solution.
NIOSH(35) recommends using the largest LODs obtained from the two methods. As shown in Table II, the LODs and LOQs for Cr, Mn, and Ni obtained from the blanks were higher than those obtained from low-level spikes. The NIOSH standard procedure also recommends selecting the greater between LOQ = 3.33 × LOD and the mass above which recovery is grater or equal to 75%. For all six low-level spike amounts, the percent recovery was greater than 75%, therefore no further tests were deemed necessary. LODs and LOQs vary from laboratory to laboratory, analyst to analyst, instrument to instrument and day to day.(40) The values for LODs and LOQs reported in this manuscript are an estimate of the expected performance of the method and not absolute values.
Evaluation of Method Over a Range of Concentrations
The method was evaluated over a range of typical welding-fume-nanoparticle loads of the NRD sampler expected in the welding laboratory. The average percent recoveries of the spikes at the highest load levels are reported in Table II. All recoveries at these levels were above 97%. Similar results were obtained for the spikes at lower levels in the range of concentrations, where recoveries were above 95%.
The recovery of solid welding-fume particles using certified stainless-steel welding-fume reference material was 96% ± 2% for Cr, 99% ± 4% for Ni and 99% ± 4% for Mn.
Total Welding Fume Concentrations
CPC data showed stable concentrations from day-to-day runs. In our tests we found that particle removal is not homogeneously distributed among all particle sizes when using a modified HEPA filter removal system, therefore the CPC data are limited in its use for measurement of nanoparticle concentrations. It can, however, be effectively used for comparison of stability of similar runs.
The mass percent per stage width versus aerodynamic diameter as measured by the MOUDI is shown in Figure 3 and was calculated using a data inversion method.(41) The error bars represent the standard error of the four replicate tests. Similar results were obtained for mild steel welding and for MOUDI stages containing greased foil substrate. The size distribution of the aerosol generated by the robotic arm appeared to be tri-modal. The most significant mass contribution was found in the size range with cutoff diameters 0.1–1.0 μm. Additionally, Figure 3 shows a significant mass contribution in the particle’s range 0.01–0.1 μm. The third mode was observed in the particles larger than 1 μm. The smooth line in Figure 3 represents the log-fitted size distribution of the primary mode, the fine size range of 0.1–1.0 μm. The mass median aerodynamic diameter (MMAD) of this mode was 0.23 μm with a geometric standard deviation (GSD) of 1.7.
FIGURE 3.
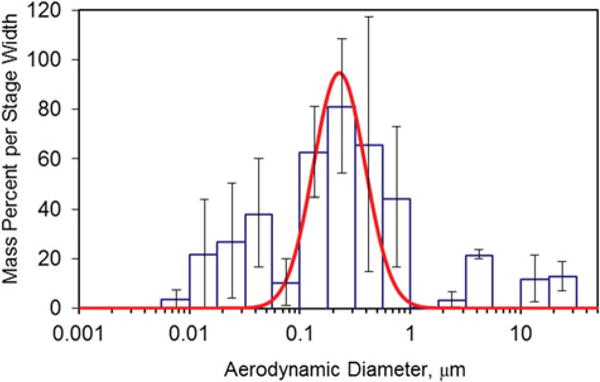
Particle size distribution of stainless steel gas metal arc welding fume as measured with a MOUDI and nano-MOUDI impactor system. The solid line represents the log-fitted size distribution of the primary mode. (color figure available online)
For stainless steel welding, total mass concentration was obtained from gravimetric analysis of the ACCU-CAP PVC inserts and measured at 3.13 (±0.96) mg/m3. The total concentration reported by the MOUDI was 2.63 (±1.2) mg/m3. The SOLU-SERT samples were analyzed for total metal content of Cr, Mn, and Ni; the results are summarized in Table III. On average, total Cr was 0.33 (±0.07) mg/m3, Mn was 0.92 (±0.05) mg/m3, while Ni was 0.08 (±0.03) mg/m3. All concentrations were above the LOQ. SOLU-SERT samples were not analyzed for Cr(VI). As a reference, NIOSH recommended exposure limits (RELs) for total Cr, Cr(VI), Ni, and Mn are also reported in Table III.
TABLE III.
Average Stainless-Steel Welding Mass Concentrations in the Front Section of the Robotic Arm and Recommended Exposure Limits
| Metals | CFC Mass Conc.A (StDev) [mg/m3] | NRD Mass Conc. (StDev) [mg/m3] | Percentage of Total MassA on NRD [%] | RELB [mg/m3] |
|---|---|---|---|---|
| Total Cr | 0.33 (0.07) | 0.16 (0.04) | 48 | 0.50 |
| Cr(VI) | — | — | — | 0.0002 |
| Ni | 0.08 (0.03) | 0.05 (0.02) | 62 | 0.015 |
| Mn | 0.92 (0.31) | 0.31 (0.08) | 34 | 1.00 |
Solu-Sert inserts.
NIOSH Recommended Exposure Limit.
Welding Fume Nanoparticle Concentrations
The average mass concentration of Cr, Cr(VI), Mn, and Ni nanoparticles collected on the diffusion stage of the NRD samplers is shown in Figure 4. Each run represents one experimental repetition. The error bars represent the standard deviation of a subsample of three NRD samplers from each repetition of stainless steel welding and six NRD samplers for mild steel welding. All concentrations were above the LOQ. To account for variability in concentrations, the NRD samplers were evenly spaced around the robotic arm. For stainless steel welding, a subsample of three samplers was randomly assigned to ICP/MS or IC. Figure 4A shows the mass concentration of Mn, total Cr, and Ni measured by ICP/MS for stainless steel welding. The average concentrations recorded by the NRD samplers for all stainless steel welding runs were 0.51 mg/m3 for Mn, 0.32 mg/m3 for Cr, and 0.015 mg/m3 for Ni. Figure 4B shows the mass concentration of Cr(VI) measured by IC for stainless steel welding. On average the concentration of Cr(VI) was 0.017 mg/m3. For mild steel welding, Cr and Ni concentrations were below the LOD while Mn mass concentrations for each run were on average 0.34 mg/m3 (Figure 4C).
FIGURE 4.
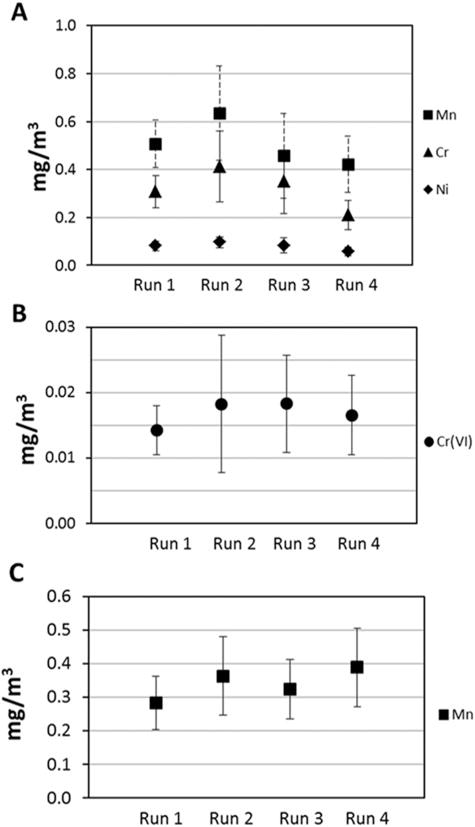
Average welding fume nanoparticles mass concentration collected on the diffusion stages of the NRD samplers for (A) Mn, Cr, Ni in stainless steel welding and (B) Cr(VI) in stainless steel welding, and (C) Mn in mild steel welding.
There was considerable variability in particle concentrations around the robotic arm, with the lowest concentrations recorded in front of the arm. The average concentrations of Cr, Mn, and Ni collected from the NRD samplers located adjacent to the CFCs in the front section of the arm are reported in Table III and were 0.16 (±0.06) mg/m3, 0.31 (±0.08) mg/m3, and 0.05 (±0.02) mg/m3, respectively.
DISCUSSION
Evaluation of the Method
NIOSH recommends the evaluation of a new method over a range of 0.1 to 2 times the exposure limit.(40) However, the RELs for Cr, Ni, and Mn are not specific to nanoparticles. Nanoparticle collection in amounts up to two times the REL would not be feasible because the low-mass nanoparticles would overwhelm the collection media long before approaching the desired loads. The method was instead evaluated at typical welding-fume-nanoparticle loads of the NRD sampler estimated in preliminary tests in the welding laboratory. All recoveries at these levels were above 95%. The average recoveries for Cr and Ni reported in Table II for the sets of eight nylon screens were slightly above 100% which is likely a consequence of small inaccuracies that occur during the preparation of the calibration standards.
The ability of the method to recover solid welding-fume particles was tested using certified reference material. The certified values used to calculate the amount of analyte spiked on the sample and subsequently the percent recovery of the welding fume reference material were provided by the manufacturer. These values were derived from the unweighted mean of n values, each value being the mean of a set of results obtained in a different laboratory. The certified values are mass fractions based upon analysis of a nominal 10 mg sample mass. This sample mass is equivalent to the mass used in our recovery verification procedure and indicates that the methods and instruments used in our work are capable of accurately estimating Cr, Ni, and Mn mass in solid welding fumes. Certified reference material values were not available for Cr(VI).
There are some limitations to the use of the NRD sampler with welding fume aerosols. The sampler was originally developed and tested using ammonium fluorescein particles.(32) The spherical fluorescein particles have different properties, including shape and density, from the aggregates typical of welding fumes aerosols. Some of these properties may be important for the size selection characteristics of the NRD sampler and may affect its performance and ability to collect particles according to the nanoparticulate matter criterion that it was designed to follow (Figure 1). Collection of spherical nanoparticles is dominated by particle diffusion to the surface of a screen or filter. Collection of welding fume chain agglomerates may be further increased by the combination of particle diffusion and interception. These collection mechanisms, however, would apply to and affect the deposition of chain agglomerates in the human respiratory system in a similar manner as in the NRD sampler.
Total Welding Fume Concentrations
The tri-modal distribution of the welding fume aerosol generated in our work and presented in Figure 3 is comparable to that reported by Antonini et al.(37) under similar conditions. The primary mode MMAD calculated by Antonini et al. was 0.24 μm with GSD = 1.39 and 85–95% of the mass was collected in the fine size range. The ultrafine particles mode contained less than 5–10% of the total mass collected. Our results show a much larger contribution to the total mass in the ultrafine particles mode, with 25% in the ultrafine size range and 63% of the mass collected in the fine size range. The discrepancy may be attributed to the position of the MOUDI inlets and subsequent aging of the welding fumes before collection. The inlets in our experiments were positioned directly on the robotic arm and about 20 cm away from the welding pool. Antonini et al. collected the fumes inside an animal exposure chamber positioned several meters away from the source. As distance from the source increases, ultrafine particle concentrations tend to rapidly decrease.(2,5)
The effect of using PVC filters as impaction substrates on the MOUDI stage’s cut size was investigated in preliminary runs where PVC filters were substituted with aluminum foil substrates (Item No. 0100-96-0573A-X; MSP Corporation, Shoreview, Minn.) and PVC filters greased with silicone lubricant (Part No. 07041; MSP Corporation, Shoreview, Minn.). The particle size distribution in both cases was trimodal with the primary mode MMAD of 0.21 μm (GSD = 1.7) for the greased aluminum foil and 0.26 μm (GSD = 1.7) for the greased PVC filters. These results indicated that there was minimal particle bounce effect in the MOUDI stages when using ungreased PVC filters.
The total mass concentration measured from gravimetric analysis of MOUDI stages was ~16% lower than that sampled by the CFCs with the ACCU-CAP inserts. The relatively small discrepancy between the two measurements may be attributed to the upper limit of the MOUDI, the location of the inlets around the robotic arm and losses into and within the MOUDI. The cut-point of the MOUDI inlet is 18 μm and the upper range limit is approximately 30 μm, thus particles larger than 30 μm are not included in the measurements. Due to its size, the MOUDI was located adjacent to the robotic welder with the inlet of a 2-m sampling line located towards the front of the welding arm. Particle concentrations were not uniformly distributed around the robotic arm, with lowest concentrations measured in the front section and highest concentrations towards the back of the arm. Diffusion losses introduced by the sampling line were estimated from theory to be ~5% for 10-nm particles and ~1% for particles larger than 40 nm.(42) Losses in the sampling tube due to particle sedimentation were estimated to be less than 1% for 0.6 um and less than 6% for 30 um particles.(43) The rotating stages of the MOUDI provide a nearly uniform particle deposition on the impaction plates and reduce particle bounce; the residual difference between the MOUDI and CFC measurements is attributed to particle losses that occur between the MOUDI stages.
The total mass concentrations of each metal measured through ICP-MS analysis of the SOLU-SERT cassette inserts (summarized in Table III) can be compared to NIOSH RELs. The REL for Cr is 0.5 mg/m3 and for Mn the REL is 1.0 mg/m3; the concentrations measured for both metals in our experiments were below the REL. For Ni, however, the REL is 0.015 mg/m3, while the average concentrations measured were about five times higher than the REL.
The total-concentration results provided by the CFCs do not provide a full picture of total particle concentrations around the robotic welding arm. Due to limitations in space and weight on the robotic arm, the CFCs for total mass concentration measurements were not directly matched in each location with the NRD samplers and were predominantly located towards the front section of the arm. With the exception of Mn, the average NRD sampler concentrations around the arm were similar to those recorded with the CFCs. For the NRD samplers, the average concentrations were expected to be higher than the concentrations measured exclusively in the front section of the arm. The relationship between the total metal concentrations measured by the CFCs and the nanoparticle concentrations measured by the NRD samplers located in the front part of the arm is discussed in the section below.
Welding Fume Nanoparticles
Welding fume nanoparticles may be in various forms, including aggregates and agglomerates. The NRD sampler may be able to shed some light on the behavior of aggregated and agglomerated nanoparticles in the respiratory system and help in the development of deposition models. NRD samplers provide an estimate of the total deposited nanoparticles given a known sampled air volume. Unlike traditional samplers, NRD samplers separate nanoparticles from larger particles and follow a nanoparticulate matter sampling criterion that was based on respiratory deposition for the average adult under light exercise and nose-breathing conditions.(32) This aspect is missing from the current methodologies for assessing exposure to welding fumes. CFCs do not allow for particle size differentiation. Additionally, the commonly used respirable samplers collect particles with efficiencies that approximate the fraction of aerosol that, once inhaled, can penetrate into the gas-exchange region of the respiratory tract.(44) A substantial portion of inhaled particles, however, are exhaled and do not deposit in the respiratory system.(28)
Our work involved a robotic welder in a controlled environment. Welding fume concentrations and welding cycle times may differ substantially from those of workers in occupational settings. Workplaces may also have dilution and local exhaust ventilation systems. Nonetheless, this work demonstrates the potential of deploying the NRD sampler in occupational settings and recovering concentrations that would represent the nanoparticulate fraction of each individual metal deposited in the respiratory system of a worker.
Our results indicate that a large portion of the metals investigated lies in the nanoparticle fraction (Table III). The SOLU-SERT cassette inserts were analyzed for total metal concentrations. These total samplers were located in the front section of the robotic welding arm. Multiple NRD samplers were located around the arm and their concentrations were averaged. Spatial variability played a substantial role as the source of error within runs. The NRD samplers located in the front section of the robotic arm consistently collected lower mass concentrations than those located towards the back. Characterization of the spatial distribution of welding fume particle concentrations is beyond the scope of this work. However, when considering the data only from the NRD samplers located in the front section of the robotic arm, we find that ~30–50% of Cr and Mn and ~60% of Ni may lie in the nanoparticle fraction. Further investigation of the distribution by size of each metal and of the spatial variability of concentrations with distance from the source is warranted.
The relationship between the composition of the fumes and that of the base metals was not investigated in a rigorous systematic manner as an a priori hypothesis; however, Tables I and III show that there is no apparent relation between the composition by weight of the stainless steel base metal and electrodes and the composition of the fumes. The base metal and electrode contain ~2% Mn and ~20% Cr (Table I) while the Mn mass concentration measured by the NRD is twice that of Cr (Table III). Others have observed similar Mn enrichment in the fumes.(3,45) Keane et al.(3) found that the relative enhancement of manganese depends on the process type. Jenkins(45) has discussed possible pathways and suggested that multiple mechanisms may be responsible for this phenomenon.
CONCLUSION
Current methods for welding fume exposure do not differentiate between nanoparticles and larger particles. The novel method described in this article consisted of collecting welding fumes with a NRD sampler that selectively collects nanoparticles in a way that mimics their respiratory system deposition. The diffusion stages of NRD samplers were analyzed for total Cr, Cr(VI), Mn, and Ni collected from a robotic welding arm performing GMAW of mild and stainless steel plates in a laboratory setting. The results from the NRDs indicate that a substantial portion of the metals under investigation is contained in the <300 nm size fraction. Future studies should focus on investigating the distribution by size of total Cr, Cr(VI), Mn, and Ni in welding fumes as well as in characterizing the spatial variability in concentrations with distance from the source.
The NRD sampler can benefit epidemiological and toxicological studies. Compared to traditional samplers that are based on penetration of particles to different regions of the respiratory system, the NRD sampler allows for characterization of deposited nanoparticles apart from larger particles. This allows for direct assessment of nanoparticle deposition and dose estimation. The NRD sampler is light-weight, fits on a worker’s lapel, and works with traditional sampling pumps, allowing it to be deployed in large quantities in field studies. Additionally, the chemical analysis of the diffusion stage of the sampler described in this work is relatively inexpensive compared to electron microscopy. Linking the exposures measured with the NRD sampler with acute and chronic health effects can streamline epidemiological studies. The NRD sampler provides the concentration of deposited particles. This information is critical in the development of toxicological studies aimed at finding links between welding fume exposure, dose, and adverse health effects.
Supplementary Material
Footnotes
DISCLAIMER
The findings and conclusions in this article are those of the authors and do not necessarily represent the views of the National Institute for Occupational Safety and Health. The mention of any company names or products does not imply an endorsement by NIOSH or the Centers for Disease Control and Prevention, nor does it imply that alternative products are unavailable, or unable to be substituted after appropriate evaluation. This article is not subject to US copyright law.
References
- 1.Bureau of Labor Statistics (BLS) Occupational Employment Statistics: Occupational Employment and Wages, May 2012, Welders, Cutters, Solderers, and Brazers. Available at http://bls.gov/oes/current/oes514121.htm (accessed Feb 12, 2014)
- 2.Zimmer AT, Biswas P. Characterization of the aerosols resulting from arc welding processes. J Aerosol Sci. 2001;32(8):993–1008. [Google Scholar]
- 3.Keane M, Stone S, Chen B. Welding fumes from stainless steel gas metal arc processes contain multiple manganese chemical species. J Environ Monit. 2010;12:1133–1140. doi: 10.1039/b922840c. [DOI] [PubMed] [Google Scholar]
- 4.International Organization for Standards (ISO) Nanotechnologies-Vocabulary - Part 1: Core Terms (ISO/TS 80004-1) Geneva: ISO; 2010. [Standard] [Google Scholar]
- 5.Zhu Y, Hinds WC, Kim S, Sioutas C. Concentration and size distribution of ultrafine particles near a major highway. J Air Waste Manage Assoc. 2002;51(9):1032–1042. doi: 10.1080/10473289.2002.10470842. [DOI] [PubMed] [Google Scholar]
- 6.Moroni B, Viti C. Grainsize, chemistry, and structure of fine and ultrafine particles in stainless steel welding fumes. J Aerosol Sci. 2009;40(11):938–949. [Google Scholar]
- 7.Becker N. Cancer mortality among arc welders exposed to fumes containing chromium and nickel. J Occup Environ Med. 1999;41:294–303. doi: 10.1097/00043764-199904000-00012. [DOI] [PubMed] [Google Scholar]
- 8.Chang C, Demokritou P, Shafer M, Christiani D. Physicochemical and toxicological characteristics of welding fume derived particles generated from real time welding processes. Environ Sci Processes Impacts. 2013;15:214–224. doi: 10.1039/c2em30505d. [DOI] [PubMed] [Google Scholar]
- 9.Korczynsky RE. Occupational health concerns in the welding industry. J Environ Monit. 2000;10:195–220. doi: 10.1080/104732200750051175. [DOI] [PubMed] [Google Scholar]
- 10.Antonini JM. Health effects of welding. Crit Rev Toxicol. 2003;33(1):61–103. doi: 10.1080/713611032. [DOI] [PubMed] [Google Scholar]
- 11.Bowler RM, Nakagawa S, Drezgic M, et al. Sequelae of fume exposure in confined space welding: A neurological and neuropsychological case series. Neurotoxicology. 2007;28(2):298–311. doi: 10.1016/j.neuro.2006.11.001. [DOI] [PubMed] [Google Scholar]
- 12.Flynn MR, Susi P. Manganese, iron, and total particulate exposure to welders. J Occup Environ Hyg. 2010;7(2):115–126. doi: 10.1080/15459620903454600. [DOI] [PubMed] [Google Scholar]
- 13.Jankovic J. Searching for a relationship between manganese and welding and Parkinson’s disease. Neurology. 2005;64(12):2021–2028. doi: 10.1212/01.WNL.0000166916.40902.63. [DOI] [PubMed] [Google Scholar]
- 14.McMillan DE. A brief history of the neurobehavioral toxicity of manganese: Some unanswered questions. Neurotoxicology. 1999;20(2–3):499–507. [PubMed] [Google Scholar]
- 15.Gibb HJ, Lees PS, Pinsky PF, Rooney BC. Lung cancer among workers in chromium chemical production. Am J Ind Med. 2000;38(2):115–126. doi: 10.1002/1097-0274(200008)38:2<115::aid-ajim1>3.0.co;2-y. [DOI] [PubMed] [Google Scholar]
- 16.Park RM, Bena JF, Stayner LT, Smith RJ, Gibb HJ, Lees PSJ. Hexavalent chromium and lung cancer in the chromate industry: A quantitative risk assessment. Risk Anal. 2004;24(5):1099–1108. doi: 10.1111/j.0272-4332.2004.00512.x. [DOI] [PubMed] [Google Scholar]
- 17.Antonini JM, Keane M, Chen BT, et al. Alterations in welding process voltage affect the generation of ultrafine particles, fume composition, and pulmonary toxicity. Nanotoxicology. 2011;5(4):700–710. doi: 10.3109/17435390.2010.550695. [DOI] [PubMed] [Google Scholar]
- 18.Oberdorster G, Ferin J, Lenhert BE. Correlation between particle size, in vivo particle persistence, and lung injury. Environ Health Perspect. 1994;102(5):173–179. doi: 10.1289/ehp.102-1567252. [DOI] [PMC free article] [PubMed] [Google Scholar]
- 19.Grassian VH, Adamcakova-Dodd A, Pettibone JM, O’Shaughnessy PT, Thorne PS. Inflammatory response of mice to manufactured titanium dioxide nanoparticles: Comparison of size effects through different exposure routes. Nanotoxicology. 2007;1(3):211–226. [Google Scholar]
- 20.Byrne JD, Baugh JA. The significance of nanoparticles in particle induced pulmonary fibrosis. McGill J Med. 2008;11(1):43–50. [PMC free article] [PubMed] [Google Scholar]
- 21.Karlsson HL, Gustafsson J, Cronholm P, Möller L. Size-dependent toxicity of metal oxide particles—A comparison between nano- and micrometer size. Toxicol Lett. 2009;188(2):112–118. doi: 10.1016/j.toxlet.2009.03.014. [DOI] [PubMed] [Google Scholar]
- 22.Occupational Safety and Health Administration (OSHA) OSHA Sampling and Analytical Methods Sandy. Utah: OSHA; 2003. Method PV2121. [Google Scholar]
- 23.Meeker J, Susi P, Flynn M. Manganese and welding fume exposure and control in construction. J Occup Environ Hyg. 2007;4(12):943–951. doi: 10.1080/15459620701718867. [DOI] [PubMed] [Google Scholar]
- 24.Gomes JF, Albuquerque PC, Miranda RM, Santos TG, Vieira MT. Comparison of deposited surface area of airborne ultrafine particles generated from two welding processes. Inhalation Toxicol. 2012;24(11):774–781. doi: 10.3109/08958378.2012.717648. [DOI] [PubMed] [Google Scholar]
- 25.Isaxon C, Pagels J, Gudmundsson A, et al. Characteristics of welding fume aerosol investigated in three Swedish workshops. J Phys Conf Ser. 2009;151(1):1–5. [Google Scholar]
- 26.Debia M, Weichenthal S, Dufresne A. Ultrafine particles exposure in apprentice welders. J Occup Environ Hyg. 2014;11(1):D1–D9. doi: 10.1080/15459624.2013.836280. [DOI] [PubMed] [Google Scholar]
- 27.Lehnert M, Pesch B, Lotz A, et al. Exposure to inhalable, respirable, and ultrafine particles in welding fume. Ann Occup Hyg. 2012;56(5):557–567. doi: 10.1093/annhyg/mes025. [DOI] [PMC free article] [PubMed] [Google Scholar]
- 28.Soderholm SC. Proposed international conventions for particle size-selective sampling. Ann Occup Hyg. 1989;33(3):301–320. doi: 10.1093/annhyg/33.3.301. [DOI] [PubMed] [Google Scholar]
- 29.Soderholm SC, McCawley MA. Should dust samplers mimic human lung deposition? Appl Occup Environ Hyg. 1990;5(12):829–835. [Google Scholar]
- 30.Antonini JM, Taylor MD, Zimmer AT, Roberts JR. Pulmonary responses to welding fumes: Role of metal constituents. J Toxicol Environ Health Part A. 2004;67:233–249. doi: 10.1080/15287390490266909. [DOI] [PubMed] [Google Scholar]
- 31.Ellingsen DG, Zibarev E, Kusraeva Z, et al. The bioavailability of manganese in welders in relation to its solubility in welding fumes. Environ Sci Processes Impacts. 2013;15(2):357–365. doi: 10.1039/c2em30750b. [DOI] [PubMed] [Google Scholar]
- 32.Cena LG, Anthony TR, Peters TM. A personal nanoparticle respiratory deposition (NRD) sampler. Environ Sci Technol. 2011;45(15):6483–6490. doi: 10.1021/es201379a. [DOI] [PMC free article] [PubMed] [Google Scholar]
- 33.University of Iowa Research Foundation. Personal nanoparticle respiratory deposition sampler and methods of using the same. Patent Application. United States, filed. 2013 Aug 29; [Google Scholar]
- 34.International Commission on Radiological Protection (ICRP) Human Respiratory Tract Model for Radiological Protection. Oxford, U.K.: Elsevier Science, Ltd; 1994. [Google Scholar]
- 35.National Institute for Occupational Safety and Health (NIOSH) SOP 504: Limits of Detection and Quantitation. Available at http://dart.cdc.gov/lims/labsup/sop/sop504.htm (accessed Feb. 12, 2014)
- 36.Neter J, Kutner MH, Nachtsheim CJ, Wasserman W. Applied Linear Statistical Models. Chicago: Irwin; 1996. [Google Scholar]
- 37.Antonini JM, Afshari AA, Stone S, et al. Design, construction, and characterization of a novel robotic welding fume generator and inhalation exposure system for laboratory animals. J Occup Environ Hyg. 2006;3(4):194–203. doi: 10.1080/15459620600584352. [DOI] [PubMed] [Google Scholar]
- 38.Peters TM, Heitbrink WA, Evans DE. The mapping of fine and ultrafine particle concentrations in an engine machining and assembly facility. Ann Occup Hyg. 2006;50:249–257. doi: 10.1093/annhyg/mei061. [DOI] [PubMed] [Google Scholar]
- 39.Ashley K, Harper M. Closed-face filter cassette (CFC) sampling: Guidance on procedures for inclusion of material adhering to internal sampler surfaces. J Occup Environ Hyg. 2013;10(3):D29–D33. doi: 10.1080/15459624.2012.750554. [DOI] [PMC free article] [PubMed] [Google Scholar]
- 40.National Institute for Occupational Safety and Health (NIOSH) Guidelines for Air Sampling and Analytical Method Development and Evaluation. Washington, D.C.: U.S. Government Printing Office; 1995. [Google Scholar]
- 41.O’Shaughnessy PT, Raabe OG. A comparison of cascade impactor data reduction methods. Aerosol Sci Technol. 2003;37:187–200. [Google Scholar]
- 42.Brockmann JE. Sampling and transport of aerosol. In: Baron PA, Willeke K, editors. Aerosol Measurement: Principles, Techniques, and Applications. New York: Wiley-Interscience; 2001. pp. 143–196. [Google Scholar]
- 43.Peters TM, Volkwein JC. Analysis of sampling line bias on respirable mass measurement. Appl Occup Environ Hyg. 2003;18(6):458–465. doi: 10.1080/10473220301418. [DOI] [PubMed] [Google Scholar]
- 44.Vincent JH. Particle Size-Selective Sampling for Particulate Air Contaminants. Cincinnati, Ohio: American Conference of Governmental Industrial Hygienists (ACGIH®); 1999. [Google Scholar]
- 45.Jenkins NT. Chemistry of Airborne Particles for Metallurgical Processing. Massachussetts Institute of Technology; Cambridge, Mass: 1997. PhD diss. [Google Scholar]
- 46.National Institute for Occupational Safety and Health (NIOSH) NIOSH Manual of Analytical Methods. Washington, D.C.: U.S. Government Printing Office; 2003. [Google Scholar]
Associated Data
This section collects any data citations, data availability statements, or supplementary materials included in this article.