

Abstract
Age effects on cognitive functioning are well-documented, but effects of sex on trajectories of cognitive aging are less clear. We examined cognitive ability across a variety of measures for 1065–2127 participants (mean baseline age 64.1–69.7 years) from the Baltimore Longitudinal Study of Aging who were repeatedly tested over a mean follow-up interval of 3.0–9.0 years with a mean of 2.3–4.4 assessments. Memory and other cognitive tests were administered at each visit, assessing mental status, verbal learning and memory, figural memory, language, attention, perceptuomotor speed and integration, executive function, and visuospatial ability. Importantly, participants free from cognitive impairment at all time points were used in the analyses. Results showed that for all tests, higher age at baseline was significantly associated with lower scores and performance declined over time. In addition, advancing age was associated with accelerated longitudinal declines in performance (trend for mental status). After adjusting for age, education and race, sex differences were observed across most tests of specific cognitive abilities examined. At baseline, males outperformed females on the two tasks of visuospatial ability, and females outperformed males in most other tests of cognition. Sex differences in cognitive change over time indicated steeper rates of decline for men on measures of mental status, perceptuomotor speed and integration, and visuospatial ability, but no measures on which women showed significantly steeper declines. Our results highlight greater resilience to age-related cognitive decline in older women compared with men.
Keywords: Aging, cognitive abilities, sex differences, longitudinal
Introduction
Sex differences in specific cognitive abilities have been reported from childhood through adulthood (Maccoby & Jacklin, 1974; Wilson et al., 1975). Findings that men, on average, outperform women on spatial tasks have been reported since the 1950s (Bieri, Bradburn, & Galinsky, 1958; Witkin et al., 1954). Similarly, there is a long history of research detailing superior average female performance on some tests of verbal ability (Anastasi, 1958; Demo, 1982; Little, 1969). Societal concerns such as the disproportionately low number of women in highly quantitative fields such as science and engineering (as compared with other fields such as medicine and biology), have sparked more recent interest and debate about cognitive sex differences (Berenbaum & Resnick, 2007; Ceci & Williams, 2009).
In addition to the influence of sex on specific cognitive domains, age effects on variation in cognitive functioning are also well documented. Age differences and age-related declines in cognition are most evident in domains such as information processing speed (Salthouse, 1996), free and cued recall (Perlmutter, 1979), inhibitory control (von Hippel & Dunlop, 2005), and mental flexibility and problem solving (Phillips & Henry, 2008). However, the effects of sex on trajectories of cognitive aging are less well studied, but are critically important, as investigations of level of performance at one point in time account for only one aspect of the complex and subtle variations in cognition across the lifespan.
Prior longitudinal studies examining sex differences in cognitive aging frequently report expected sex effects in level of performance. For example, two studies from the Seattle Longitudinal Study have shown sex differences, where, on average, older men outperform women on measures of spatial ability and older women outperform men on tests of reasoning and verbal ability (Caskie, Schaie, & Willis, 1999; Gerstorf, Ram, Hoppmann, Willis, & Schaie, 2011). Consistently, a study of 35–80 year olds found higher average performance in women on tests of episodic memory, verbal recognition and fluency tasks, whereas men demonstrated the expected advantage for visuospatial ability (de Frias, Nilsson, & Herlitz, 2006). Sex differences showing higher episodic memory performance in females (Finkel, Reynolds, McArdle, Gatz, & Pedersen, 2003) and higher male performance for spatial tasks (Finkel et al., 2003; Karlsson, Thorvaldsson, Skoog, Gudmundsson, & Johansson, 2015) have also been reported in other longitudinal studies of aging.
In contrast to consistent findings across studies with respect to sex differences in level of performance, sex differences in rates of cognitive change over time are less clear. In the Seattle Longitudinal Study of Aging women experienced significantly slower rates of decline than men on tests of spatial reasoning (Caskie et al., 1999) and verbal meaning (Gerstorf et al., 2011). In the Swedish Twin Study of Aging, an initial report indicated no significant sex differences in rates of cognitive decline (Finkel et al., 2003), but a later follow-up study revealed differential rates of decline for two tests (faster quadratic decline for women on a test of crystallized ability, and faster linear decline for men on a test of fluid ability) (Finkel, Reynolds, Berg, & Pedersen, 2006). In other longitudinal studies (de Frias et al., 2006; Karlsson et al., 2015), including a study of participants aged 70–100 years in the Berlin Study of Aging (Gerstorf, Herlitz, & Smith, 2006), men and women showed similar rates of cognitive change over time. A recent review article reported that the majority of 13 longitudinal studies assessing sex differences in rates of cognitive decline after age 60 years found similar cognitive trajectories in men and women through 80 years of age (Ferreira, Ferreira Santos-Galduróz, Ferri, & Fernandes Galduróz, 2014). Taken together, how sex differences interact with cognitive aging remains unclear.
The goal of the present study was to examine sex differences in mental status and domain-specific cognitive performance in relation to both levels of performance and rates of change over time, i.e. cognitive trajectories, in a sample of clinically normal older adults. We used data from a large sample (N = 1065–2127) of participants in the Baltimore Longitudinal Study of Aging, a prospective study of physical and behavioral aging. Our study provides advantages over earlier investigations in the large sample of well-characterized older adults with repeated cognitive assessments and up to a 9-year mean follow-up interval. In addition, our study has included prospective diagnoses of dementia since the mid-1980s, avoiding retrospective recall bias, and allowing us to restrict analyses to assessments performed while participants were free of cognitive impairment, to determine whether cognitively normal men and women experience cognitive aging in the same way. Our rich, longitudinal data provide a uniquely powerful opportunity to investigate sex differences in cognitive trajectories. Further, we used a comprehensive battery of tests that sampled a wide range of cognitive abilities, allowing assessment of domain-specific cognitive functions. Consistent with previous literature, we expected that women would show an advantage in level of performance for verbal memory and some language tests, whereas a male advantage was expected on tests of visuospatial ability. Hypotheses regarding sex differences in rates of change were less clear due to the lack of fully consistent findings in prior studies.
Method
Participants
Participants were from the Baltimore Longitudinal Study of Aging (BLSA), a long-term study of human aging established in 1958 and conducted by the National Institute on Aging Intramural Research Program (Shock et al., 1984). The BLSA enrolls community-dwelling volunteers, who tend to be highly educated (mean education = 16.4 years). The number of participants (N ranging from 1065–2127) and years of follow-up (mean follow-up interval of 3.0–9.0 years; range 0–34.1 years) varied depending on the specific measure (Table 1). The majority of participants were white (range = 68.4–79.5%) and approximately 52.7% were men (range = 48.3–55.3%). Because specific measures were introduced at different times and administered to participants with certain age cutoffs, the current analyses are restricted to data from individuals aged 50 years and older. The average baseline age was 64.1–69.7 years old (range 50.0–95.8 years), with approximately four longitudinally repeated assessments. Data points collected after the onset of mild cognitive impairment (MCI) or dementia were excluded, and thus, all participants were considered cognitively normal for the data points included in these analyses.
Table 1.
Demographic characteristics of the sample for each cognitive test.
| Subjects N |
Data points N |
Sex N (% Male) |
Race N (% White) |
Age in yrs at baseline M (SD) Range |
Follow-up time in yrs M (SD) Range |
Repeat visits M (SD) Range |
Education in yrs M (SD) Range |
|
|---|---|---|---|---|---|---|---|---|
| MMSE | 1631 | 7011 | 902 (55.3) |
1296 (79.5) |
69.7 (8.1) 60.0 – 95.8 |
6.9 (6.4) 0 – 24.7 |
4.3 (3.7) 1 – 21 |
16.4(2.6) 8 – 21 |
| CVLT | 1623 | 6901 | 818 (50.4) |
1188 (73.2) |
64.9(11.3) 50.0 – 93.0 |
7.5 (6.3) 0 – 20.3 |
4.3 (3.4) 1 – 19 |
16.4(2.6) 8 – 21 |
| Boston Naming |
1364 | 5488 | 719 (52.7) |
1048 (76.8) |
69.7 (8.3) 60.0 – 95.8 |
6.2 (5.7) 0 – 20.3 |
4.0 (3.3) 1 – 18 |
16.4 (2.6) 8 – 21 |
| Fluency | 1605 | 6801 | 883 (55.0) |
1276 (79.5) |
69.6 (8.1) 60.0 – 95.8 |
6.8 (6.3) 0 – 24.7 |
4.2 (3.5) 1 – 20 |
16.4(2.7) 8 – 21 |
| Digit Symbol |
1065 | 2942 | 514 (48.3) |
728 (68.4) |
68.9 (10.2) 50.2 – 95.3 |
3.0 (2.6) 0 – 8.3 |
2.3 (1.4) 1 – 9 |
16.6 (2.5) 8 – 21 |
| Trails A/B | 1587 | 6608 | 871 (54.9) |
1262 (79.5) |
69.6 (8.0) 60.0 – 95.8 |
6.6 (6.2) 0 – 24.7 |
4.2 (3.5) 1 – 20 |
16.4(2.7) 8 – 21 |
| BVRT | 2127 | 9319 | 1153 (54.2) |
1663 (78.2) |
64.1(11.0) 50.0– 94.8 |
9.0 (8.2) 0 – 34.1 |
4.4 (3.8) 1 – 22 |
16.3(2.7) 8 – 21 |
| Card Rotations | 1621 | 6916 | 824 (50.8) |
1190 (73.4) |
65.0(11.4) 50.0 – 93.0 |
7.5 (6.3) 0 – 20.3 |
4.3 (3.4) 1 – 19 |
16.4(2.6) 8 – 21 |
Clinical and neuropsychological data from BLSA participants were reviewed at a consensus diagnostic case conference if their Clinical Dementia Rating score (Morris, 1993) was ≥ 0.5 or if they had more than three errors on the Blessed Information-Memory-Concentration Test (Fuld, 1978). In addition, all participants were evaluated by case conference upon death or withdrawal. Diagnoses of dementia and Alzheimer’s disease, respectively, were based on criteria outlined in the Diagnostic and Statistical Manual of Mental Disorders, third edition, revised (American Psychiatric Association, 1987) and the National Institute of Neurological and Communication Disorders and Stroke – Alzheimer’s Disease and Related Disorders Association (McKhann et al., 1984). MCI was based on the Petersen criteria (Petersen et al., 1997) and diagnosed when (1) cognitive impairment was evident for a single domain (typically memory) or (2) cognitive impairment in multiple domains occurred without significant functional loss in activities of daily living.
Procedures
Participants were administered a battery of memory and other cognitive tests assessing mental status, verbal learning and memory, figural memory, language, attention, perceptuomotor speed and integration, executive function, and visuospatial ability as part of their BLSA visit. A summary of each test is provided.
The Mini Mental State Examination (MMSE) assesses mental status, including orientation to time and place, immediate and delayed recall, attention and calculation, and language (Folstein, Folstein, & McHugh, 1975). The MMSE has been administered to BLSA participants 70 years and older since 1986, and to BLSA participants 60 years and older since 1990. Total score (out of 30 correct) was the dependent measure used.
The California Verbal Learning Test (CVLT) assesses verbal learning and memory (Delis, Kramer, Kaplan, & Ober, 1987). Five learning trials of 16 shopping items, with four items from each of four semantic categories are presented orally and the sum of the five trials provides a measure of immediate free recall. In addition, short- and long-delayed free recall, short- and long-delayed cued recall, and recognition memory are assessed. The CVLT has been administered to BLSA participants since 1993. Three dependent measures were used in the present analyses: total number of items recalled across the five immediate recall learning trials, short-delay free recall and long-delay free recall, with maximum scores of 80, 16, and 16, respectively.
The Boston Naming Test (Kaplan, Goodglass, & Weintraub, 1983) is a measure of object recognition and semantic retrieval. Participants identify and name a series of line drawings of objects, beginning with common objects and ending with infrequent objects. Administration in the BLSA involves cueing incorrectly named objects, with either a stimulus cue for perceptual errors or a phonemic cue for semantic errors. This test has been administered to BLSA participants since 1993. The dependent measure was the number of words out of 60 correctly named without cues.
Letter and category fluency are measures of fluent language production and executive function. Participants were given 60 seconds to generate as many words as possible beginning with specific letters (F, A, S) (Benton, 1968) and from specific categories (fruits, animals, vegetables) (Newcombe, 1969). Fluency measures have been administered to BLSA participants since 1986. The total numbers of correct words generated in 60 seconds, across the three trials of letter and category fluency, were the dependent measures of interest.
The Digit Symbol Substitution Test (Wechsler, 1981), measures psychomotor speed and visual-perceptual integration, as well as executive function. Participants were given a sheet with numbers from 1–9 and associated codes and had to insert the codes below each number in sequence. Digit Symbol has been administered to all BLSA participants on every visit since 2005. The score was the total number of number-code pairs correctly reproduced in sequence within 90 seconds.
The Trail Making Test Parts A (Trails A) and B (Trails B) assess attention, concentration, visuomotor scanning, perceptuomotor speed, working memory and set-shifting (Reitan, 1992). Trails A involves drawing a line to connect randomly arranged numbers from 1–25 in sequential order, and Trails B involves connecting randomly arranged numbers from 1–13 and letters from A-L in alternating sequence (e.g., 1-A-2-B…). Participants were instructed to draw a line to connect the numbers (and letters) with both speed and accuracy. Trails A and B have been administered to BLSA participants since 1986. Time to completion (in seconds) for Trails A and B was used.
The Benton Visual Retention Test (BVRT) measures visual constructional skill and short-term figural memory. Participants study 10 line drawings including one to three geometric figures for 10 seconds each, and then immediately reproduce them from memory using pencil and paper. The designs become more difficult over the 10 trials. The BVRT has been administered to BLSA participants since the early 1960s. The dependent variable was the total number of errors, which were scored independently by two trained technicians, employing a modified error scoring method, based on the method provided in the BVRT manual (Benton, 1974).
A modified version (Wilson et al., 1975) of the Educational Testing Service Card Rotations test (Ekstrom, French, Harman, & Dermen, 1976) was used to measure visuospatial ability and more specifically, two-dimensional spatial relations. Participants were presented with a target figure and eight alternative figures in the same row. Subjects marked images that could be rotated in plane to match the target, i.e., were not mirror image figures. Card Rotations has been administered to BLSA participants since 1993. Total number correct minus total number incorrect across the two parts (14 targets per part) was the dependent measure. The maximum score was 224.
Data for participants 50 years and older were used for CVLT, BVRT, and Card Rotations. For the MMSE, Boston Naming, fluency measures, Digit Symbol and Trails A and B, data were available for participants 60 years and older because these tests were not historically administered before this age. The date ranges for the data analyzed varied depending on when testing began for each cognitive measure. For the MMSE, fluency measures and Trails A and B, we used data from 1986 – 2013; for the CVLT, Boston Naming and Card Rotations we used data from 1993 – 2013; for Digit Symbol we used data from 2005 – 2013; and for the BVRT we used data from 1979 – 2013. For the BVRT, data before 1978 were excluded, as women have been enrolled into the BLSA study since that date.
Statistical Analyses
Separate linear mixed models (LMM) were performed with each cognitive measure as a dependent variable, with the exception of the MMSE and Boston Naming where generalized estimating equation (GEE) models with a Poisson distribution were used. Given prior studies that implicate level of education (Gerstorf et al., 2006) and race (Garrett et al., 2013) as potential moderating factors in older cohorts, we controlled for these variables in our analyses. The fixed effects of the initial full model for both the LMM and the GEE model included baseline age (in decades), baseline age squared, sex, education, race (white vs. nonwhite), sex*baseline age, sex*baseline age squared, time (in decades), baseline age*time, sex*time, education*time, race*time, and sex*baseline age*time. Random effects for the LMM model included intercept and time, with the conventional unstructured covariance. For the GEE models, we used 30 minus MMSE total score and 60 minus Boston Naming total score as the dependent variables with a Poisson distribution. Various covariance structures for the correlated residuals were used for the GEE models. The results of the fixed effects were very similar, so the exchangeable covariance structure was assumed. A backwards elimination method with the threshold p= 0.1 was used to reduce the fixed effects from each model. Although each initial full model contained all covariates listed above, this method removes non-significant terms from each iteration until the most parsimonious, fully adjusted model is produced. Baseline age, sex, education, race, time, baseline age*time, and sex*time were retained in all final models. We report only effects of interest. Significant effects of sex reflect sex differences at baseline. Baseline age was centered at 65 years and education was centered at 16 years. Sex was coded −0.5 as female, 0.5 as male. Both baseline age and time were divided by 10 such that parameter estimates reflect the effects in decades. All analyses were conducted using SAS 9.3 (Cary, NC).
We further conducted three separate sensitivity analyses. First, due to the possibility that the preclinical phase of dementia may have influenced our results, we performed additional analyses excluding all data points from participants who subsequently developed mild cognitive impairment or dementia. A second set of sensitivity analyses were performed, excluding all data points within 2 years of death, to assess the possibility that terminal decline in cognition influenced our findings given shorter lifespans of men compared with women. Finally, we repeated all analyses restricting the sample to Caucasians.
Results
Table 2 and Figure 1 outline the results of the mixed model analyses for all the cognitive tasks. For Trails A, Trails B and BVRT, higher scores are indicative of worse performance. As shown in Table 2, significant age effects, adjusted for years of education and race, were observed for all cognitive measures. Baseline level of performance on all measures was significantly lower with advanced age, with nonlinear age effects observed for the three CVLT measures and the BVRT. Similarly, significant longitudinal declines in performance over time were observed for all cognitive measures as well as significant accelerated declines with advancing age (except MMSE, which was at trend level).
Table 2.
Results of the mixed model analyses for each cognitive measure.
| Age | Sex | Time | Age*time | Sex*time | |
|---|---|---|---|---|---|
| Estimate (S.E.) Effect Size |
|||||
| MMSE | 0.369*** (0.026) 0.629 |
0.239*** (0.044) 0.386 |
0.261*** (0.027) 0.468 |
−0.026 (0.036) −0.091 |
0.118* (0.047) 0.464 |
| CVLT Immediate |
−3.774*** (0.216) −0.497 |
−6.331*** (0.454) −0.833 |
−3.143*** (0.273) −0.414 |
−0.858** (0.276) −0.160 |
−0.792 (0.518) 0.147 |
| CVLT Short-delay |
−1.060*** (0.068) −0.445 |
−1.433*** (0.142) −0.601 |
−0.767*** (0.076) −0.322 |
−0.290*** (0.077) −0.225 |
−0.234 (0.143) −0.182 |
| CVLT Long-delay |
−1.013*** (0.067) −0.422 |
−1.473*** (0.141) −0.613 |
−0.693*** (0.073) −0.288 |
−0.312*** (0.073) −0.253 |
−0.127 (0.137) −0.103 |
| Boston Naming |
0.304*** (0.026) 0.362 |
−0.074 (0.046) −0.079 |
0.121*** (0.024) 0.105 |
0.101*** (0.025) 0.573 |
0.045 (0.045) 0.087 |
| Letter Fluency | −0.379** (0.127) −0.102 |
−0.487** (0.203) −0.131 |
−0.679*** (0.075) −0.183 |
−0.570*** (0.112) −0.513 |
−0.212 (0.142) −0.191 |
| Category Fluency |
−1.343*** (0.089) −0.543 |
−1.685*** (0.143) −0.682 |
−1.496*** (0.075) −0.697 |
−1.073*** (0.111) −0.864 |
−0.248 (0.142) −0.200 |
| Digit Symbol | −6.014*** (0.293) −0.690 |
−5.314*** (0.627) −0.610 |
−10.111*** (0.497) −1.161 |
−2.188*** (0.496) −0.459 |
−2.014* (0.920) −0.422 |
| Trails A (seconds) |
8.406*** (0.386) 0.868 |
1.355* (0.610) 0.140 |
2.537*** (0.399) 0.262 |
3.035*** (0.587) 0.487 |
0.387 (0.760) 0.062 |
| Trails B (seconds) |
23.010*** (1.187) 0.759 |
3.023 (1.872) 0.100 |
15.541*** (1.204) 0.513 |
16.268*** (1.796) 0.831 |
3.468 (2.291) 0.177 |
| BVRT (errors) |
1.843*** (0.064) 0.727 |
−0.490*** (0.140) −0.194 |
2.177*** (0.084) 0.860 |
0.523*** (0.078) 0.357 |
0.596*** (0.132) 0.406 |
| Card Rotations |
−15.281*** (0.766) −0.515 |
15.046*** (1.614) 0.507 |
−4.552* (0.591) −0.153 |
−3.567*** (0.611) −0.348 |
−4.874*** (1.115) −0.476 |
Note: the MMSE and Boston Naming estimates are derived from 30-MMSE and 60-Boston Naming scores, respectively. Parameter estimates reflect age and time in decades. All models included baseline age, sex, education, race, time, baseline age*time and sex*time terms. Additional significant terms in final models were: baseline age squared for CVLT and BVRT measures; sex*baseline age for DSST; race*time for BVRT and Boston Naming; education*time for CVLT Long-delay andTrails A.
p<.05;
p<.01;
p<.001
Figures 1.
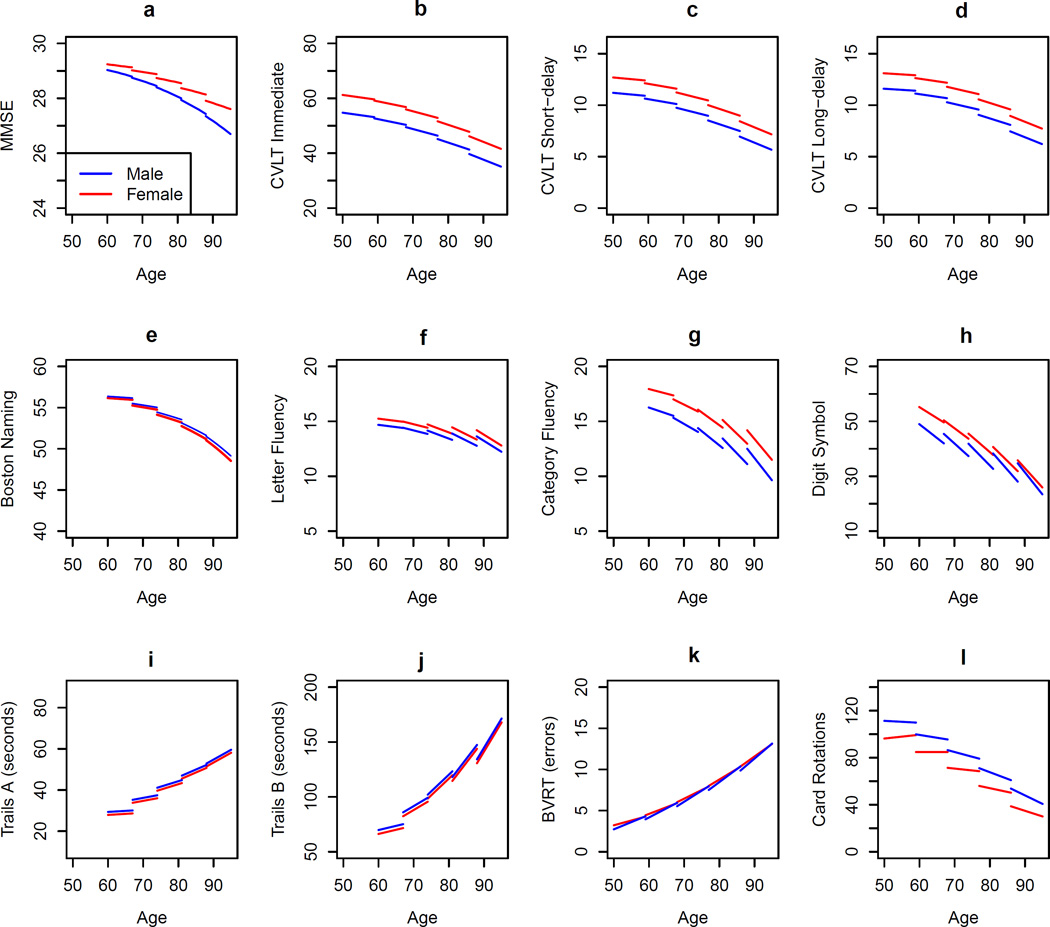
a–l: Longitudinal cognitive trajectories by sex for each cognitive measure.
Significant sex effects, adjusted for years of education, race and age are listed for each cognitive task below.
Mental status
Sex differences were significant in level of performance at baseline and in longitudinal rates of change for the MMSE. Men on average scored 0.31 points lower than women and declined at a rate of 0.25 points per decade more than women (Figure 1a). (Note, because a GEE Poisson model was used with 30-MMSE as the dependent variable, the parameter estimates in the results table have been transformed accordingly to be interpreted meaningfully).
Verbal learning and memory
As shown in Figures 1b–d, there were significant sex differences at baseline, with women outperforming men in all three CVLT measures. Women learned 6.3 more words than men over the five verbal learning trials, and remembered 1.4 and 1.5 words more than men during short- and long-delayed free recall, respectively. In contrast to the sex differences observed at baseline, there were no significant sex differences in longitudinal rates of change, reflecting similar cognitive decline over time in men and women for all three CVLT measures.
Object recognition and semantic retrieval
As shown in Figure 1e, there were neither sex differences in baseline level nor longitudinal rates of change for the Boston Naming Test.
Fluent language production
There were significant sex differences in level of performance at baseline for both fluency tasks. Men generated 0.5 fewer letter fluency words and 1.7 fewer category fluency words than women. There was no significant sex difference in longitudinal rate of change for letter fluency, but there was a trend toward a sex difference in rate of change for category fluency (p =. 083). Men had a slightly steeper rate of longitudinal decline in category fluency than women (men generated 0.3 fewer category fluency words per decade than women). See Figures 1f–g.
To assess whether category fluency differed across the sexes as a function of the content of the category items, we conducted further analyses separating “Animal” fluency from “Fruits and Vegetables” fluency. There were neither significant sex differences at baseline nor in longitudinal change for the “Animals” category. However, there was a significant baseline sex effect for the “Fruits and Vegetables” category (p < .001) favoring women, and a trend toward a sex difference in longitudinal rate of change (p = .076), where the men had a slightly steeper rate of decline than women.
Psychomotor speed and integration
Sex differences were significant in level of performance at baseline for Digit Symbol where women completed 5.3 more number-code pairs than men. The men showed a significantly steeper rate of decline over time compared to women (men completed 2.0 fewer number-code pairs per decade than women). See Figure 1h.
Attention, perceptuomotor speed and executive function
As shown in Figures 1i–j, sex differences in baseline level of performance were marginally significant for Trails A but not for Trails B. Men on average were 1.4 seconds slower than women on Trails A. There were no significant sex differences in longitudinal rates of change for Trails A or B, indicating similar rates of slowing over time for men and women.
Visual memory
Figure 1k shows that sex differences in baseline level of performance and longitudinal rates of change were significant for the BVRT. While men on average scored 0.49 fewer errors than women at baseline, they showed faster increases in errors than women longitudinally (errors increased 0.6 faster per decade in men than women).
Visuospatial abilities
Sex differences in performance on the Card Rotations Test were significant at baseline and in longitudinal rates of change (Figure 1l). While men had scores 15.0 points higher than those of women, they showed faster rates of decline over time (by 4.9 points per decade).
Sensitivity analyses
Our first sensitivity analysis excluded all data points of participants who subsequently developed mild cognitive impairment or dementia (omission of 2.7–19.6% of data points depending on the test). The results were qualitatively similar to the analyses excluding data points after onset of cognitive impairment only. Sex differences in baseline levels of performance were identical to our primary analyses. Sex differences in rates of decline in immediate recall and short-delay free recall on the CVLT reached significance (both ps < 0.05), with men declining significantly faster than women in the more restricted analysis.
The second sensitivity analysis excluded data points within 2 years of death for both men and women (omission of 1.1–2.2% of data points depending on the test). Patterns of significant findings were identical to our primary analyses.
Finally, restriction of the sample to Caucasian participants (omission of 18.1–31.3% of data points depending on the test) showed results that were qualitatively similar to the original analyses. There were two instances where marginally significant effects became non-significant (sex differences at baseline for Trails A and sex differences in longitudinal rate of change for Digit Symbol), and one where a non-significant effect became significant (p < 0.05; baseline sex differences for the Boston Naming Test favoring men).
Discussion
The aims of this study were to investigate sex differences in baseline levels of performance and rates of change in mental status and domain-specific cognitive abilities in a large sample of well characterized older adults without cognitive impairment. In addition to the expected cognitive decline with age, the main findings were that sex differences at baseline were present across almost all tests of specific cognitive abilities examined, mostly favoring women, and that older men and women showed differences in rate of change over time for some but not all cognitive domains. Whereas four measures demonstrated faster rates of decline for males, there was no measure where females exhibited significantly steeper declines compared to males.
As expected, across all age groups women outperformed men on tests of verbal learning and memory and fluent language production. Consistent with previous research (de Frias et al., 2006; Gerstorf et al., 2006; Hogervorst, Rahardjo, Jolles, Brayne, & Henderson, 2012; Lamar, Resnick, & Zonderman, 2003), we did not observe significant sex differences in longitudinal rates of change for CVLT nor verbal fluency measures. For verbal fluency performance, sex differences at baseline were influenced by category content, with higher performance for women on fruits and vegetables combined but not animals. This likely reflects greater exposure of women to varieties of foods because women are more likely to be responsible for grocery shopping and cooking. Prior studies using only “animals” for category fluency tests have similarly reported no sex differences in older adults (Weber, Skirbekk, Freund, & Herlitz, 2014).
Higher average baseline performance in women than men was also observed on the tests of mental status (MMSE) and psychomotor speed and perceptual integration (Digit Symbol). Women also showed slower cognitive decline than men over time on these tests. Consistent with our findings, prior cross-sectional studies have reported higher Digit Symbol scores for older women than men (Fuchs, Busch, Gosswald, Holling, Kuhnert, & Scheidt-Nave, 2013; Rosano, Simonsick, Harris, Kritchevsky, Brach, Visser et al., 2005). As episodic memory influences Digit Symbol performance, it is possible that better recall performance in women compared to men contributes to observations of a female advantage on the Digit Symbol task. Prior studies of sex differences on the MMSE have not yielded consistent findings, with many reporting no differences between men and women in overall performance (Bleecker, Bolla-Wilson, Kawas, & Agnew, 1988; Buckwalter, Sobel, Dunn, Diz, & Henderson, 1993; Munro et al., 2012; O'Connor, Pollitt, Treasure, Brook, & Reiss, 1989), although at least one longitudinal study of aging reported a female advantage in baseline MMSE performance (Proust-Lima, Amieva, Dartigues, & Jacqmin-Gadda, 2007). In contrast to our results, Proust-Lima et al. (2007) reported steeper longitudinal declines in MMSE and Digit Symbol performance in older women than older men. Variability in sample characteristics may have contributed to differences across studies as participants in the Proust-Lima et al. study were older at baseline with a mean age of 75.2 years and were generally less educated than those in the BLSA (a large percentage not having finished primary school).
In contrast to the generally higher baseline level of performance of women across cognitive domains, men in our sample showed the well-documented advantage on tests including a visuospatial component (de Frias et al., 2006; Halpern & Tan, 2001; Herlitz, Airaksinen, & Nordström, 1999; Moffat, Hampson, & Hatzipantelis, 1998; Munro et al., 2012; Resnick, 1993; Voyer, Voyer, & Bryden, 1995). While our results demonstrate that this male advantage in visuospatial ability prevails in late adulthood, men showed steeper rates of decline despite maintaining higher mean performance. To some extent, enduring sex differences in spatial ability may reflect contributions of sex steroid hormones. Although findings are inconclusive, some studies report that androgens, such as testosterone, may have early organizational and later activational effects on spatial ability (Hines et al., 2003; Resnick, Berenbaum, Gottesman, & Bouchard Jr, 1986; Silverman, Kastuk, Choi, & Phillips, 1999), even in older men (Moffat et al., 2002).
In our sample, the male advantage on the Card Rotations Test was more pronounced than that for the BVRT. While both measures tap visuospatial abilities, successful performance on the BVRT is also dependent on memory and visuo-constructional performance whereas the Card Rotations Test requires mental rotation skills with a minimal short-term memory component. As mentioned, verbal recall performance was higher in women and this memory advantage may have partially offset a greater male advantage as with Card Rotations. In addition, despite demonstrating higher average overall performance at baseline, men showed steeper rates of age-related cognitive decline on the Card Rotations Test and the BVRT, replicating the sex difference in rate of change for spatial abilities reported in prior studies (Caskie et al., 1999; Finkel et al., 2006). Interestingly, in our study, the women in the younger age groups demonstrated an increase in performance for Card Rotations over time, most likely stemming from practice effects. The greater practice effect in women compared with men cannot be attributed to ceiling effects in male performance, as room for improvement was available for both visuospatial tasks.
Taken together, our observations are consistent with some prior longitudinal studies demonstrating less rapid decline in older women compared with men for specific cognitive domains (Caskie et al., 1999; Gerstorf et al., 2011; McDowell, Xi, Lindsay, & Tuokko, 2004). In general, the cognitive measures that did not show significant sex differences over time in our primary analyses were verbally based (with the exception of Trails A and B), while measures of mental status, perceptual integration and speed, and spatial ability showed faster age-related decline in men. However, it is of interest that men also showed faster rates of decline than women in verbal memory in secondary sensitivity analyses excluding all participants who subsequently developed cognitive impairment. This observation suggests that sex differences in cognitive aging may be even more pronounced in cognitively normal individuals after exclusion of those who likely are in preclinical stages of dementia.
Given that a number of studies suggest that risk for Alzheimer’s Disease is greater in older women than older men (Andersen et al., 1999; Gao, Hendrie, & Hall, 1998; Launer et al., 1999), our results demonstrating lower performance and steeper rates of cognitive decline in men may seem paradoxical. However, when taken into consideration that age is the most important risk factor for dementia (Evans et al., 1989; Gao et al., 1998; Ritchie & Kildea, 1995), greater longevity in women no doubt contributes to their increased risk for the disease. In our primary analyses, we excluded assessments after the onset of cognitive impairment but included data points when individuals may have been in a preclinical stage of disease, such as Alzheimer’s Disease. We performed secondary sensitivity analyses excluding all participants who subsequently developed mild cognitive impairment or dementia and obtained qualitatively similar results. We also performed sensitivity analyses excluding data points within two years of death and found quantitatively similar results. Therefore, it seems unlikely that our pattern of results can be explained by preclinical dementia or terminal cognitive decline.
As biological contributions to cognitive sex differences have been documented in animal models and in humans (Arnold & Gorski, 1984), it is possible that sex effects in cognitive aging may be influenced by sex differences in regional brain structure. Although not all brain studies demonstrate such differences (Raz, Ghisletta, Rodrigue, Kennedy, & Lindenberger, 2010; Raz et al., 2012; Takao, Hayashi, & Ohtomo, 2012), a female advantage has been reported in proportion of gray matter volumes (Good et al., 2001; Gur et al., 1999; Leonard et al., 2008), white matter volumes (Resnick et al., 2000), cerebrospinal fluid volumes (Coffey et al., 1998), and in corpus callosum morphology (Mitchell et al., 2003). Further, males have lower cortical thickness (Luders et al., 2006; Sowell et al., 2007), exhibit greater age-related reductions in frontal and temporal brain volumes (Cowell et al., 1994), and experience age-related cortical thinning at a greater rate than females (Pacheco, Goh, Kraut, Ferrucci, & Resnick, 2015). Taken together, women appear to be less vulnerable to the macrostructural and potential functional brain changes negatively associated with age, which in turn may render them less susceptible to age-related changes in cognition. Future studies linking longitudinal brain changes to cognition are necessary to address these important considerations.
Another potential explanation for our pattern of results relates to changing societal conditions disproportionately improving for women more than men. Weber et al. (2014) cite increased exposure to cognitive stimulation, economic prosperity, health improvements and changes in average family size as particularly advantaging women over time. It is possible that changing societal conditions may confer greater resilience to age-related cognitive change to women in our sample of highly educated older women and men.
Some limitations in our report merit attention. Although our rich data set enables longitudinal assessment of a large sample of well characterized older adults, the study included individuals from different cohorts with different experiences. Thus, cohort and differential survivor effects could contribute to our findings. Second, being more educated and of higher socioeconomic status than the general population, the generalizability of the BLSA sample is limited.
In summary, many cognitive abilities are subject to age-related declines in older adulthood, with subtle but robust sex differences evident within these skills. In this large and diverse sample of older men and women, our overall pattern of observations were that women experience greater resilience to age-related cognitive decline in older adulthood than their male counterparts.
Acknowledgments
This research was supported entirely by the Intramural Research Program of the NIH, National Institute on Aging.
References
- American Psychiatric Association. Diagnostic and statistical manual of mental disorders. 3rd. Washington: American Psychiatric Association; 1987. [Google Scholar]
- Anastasi A. Differential psychology. 3rd. New York: Macmillan; 1958. [Google Scholar]
- Andersen K, Launer LJ, Dewey ME, Letenneur L, Ott A, Copeland J, et al. Gender differences in the incidence of AD and vascular dementia. The EURODEM Studies. Neurology. 1999;53(9):1992–1992. doi: 10.1212/wnl.53.9.1992. [DOI] [PubMed] [Google Scholar]
- Arnold AP, Gorski RA. Gonadal steroid induction of structural sex differences in the central nervous system. Annual Review of Neuroscience. 1984;7(1):413–442. doi: 10.1146/annurev.ne.07.030184.002213. [DOI] [PubMed] [Google Scholar]
- Benton AL. Differential behavioral effects in frontal lobe disease. Neuropsychologia. 1968;6(1):53–60. [Google Scholar]
- Benton AL. Visual retention test. Psychological Corporation; 1974. [Google Scholar]
- Berenbaum SA, Resnick S. The seeds of career choices: Prenatal sex hormone effects on psychological sex differences. In: Ceci SJ, Williams WM, editors. Why aren't more women in science?: Top researchers debate the evidence. Washington, DC, US: American Psychological Association; 2007. pp. 147–157. [Google Scholar]
- Bieri J, Bradburn WM, Galinsky MD. Sex differences in perceptual behavior. Journal of Personality. 1958;26(1):1–12. doi: 10.1111/j.1467-6494.1958.tb01566.x. [DOI] [PubMed] [Google Scholar]
- Bleecker ML, Bolla-Wilson K, Kawas C, Agnew J. Age-specific norms for the Mini-Mental State Exam. Neurology. 1988;38(10):1565–1565. doi: 10.1212/wnl.38.10.1565. [DOI] [PubMed] [Google Scholar]
- Buckwalter JG, Sobel E, Dunn ME, Diz MM, Henderson VW. Gender differences on a brief measure of cognitive functioning in Alzheimer's disease. Archives of Neurology. 1993;50(7):757–760. doi: 10.1001/archneur.1993.00540070069018. [DOI] [PubMed] [Google Scholar]
- Caskie GI, Schaie KW, Willis SL. Individual differences in the rate of change in cognitive abilities during adulthood. Paper presented at the Gerontological Society of America Conference; San Francisco, USA. 1999. [Google Scholar]
- Ceci SJ, Williams WM. The mathematics of sex: How biology and society conspire to limit talented women and girls. Oxford: Oxford University Press; 2009. [Google Scholar]
- Coffey CE, Lucke JF, Saxton JA, Ratcliff G, Unitas LJ, Billig B, et al. Sex differences in brain aging: A quantitative magnetic resonance imaging study. Archives of Neurology. 1998;55(2):169–179. doi: 10.1001/archneur.55.2.169. [DOI] [PubMed] [Google Scholar]
- Cowell PE, Turetsky BI, Gur RC, Grossman RI, Shtasel D, Gur R. Sex differences in aging of the human frontal and temporal lobes. Journal of Neuroscience. 1994;14(8):4748–4755. doi: 10.1523/JNEUROSCI.14-08-04748.1994. [DOI] [PMC free article] [PubMed] [Google Scholar]
- de Frias CM, Nilsson LG, Herlitz A. Sex differences in cognition are stable over a 10-year period in adulthood and old age. Aging, Neuropsychology, and Cognition: A Journal on Normal and Dysfunctional Development. 2006;13(3–4):574–587. doi: 10.1080/13825580600678418. [DOI] [PubMed] [Google Scholar]
- Delis D, Kramer J, Kaplan E, Ober B. California verbal learning test, research edition. New York: The Psychological Corporation. 1987 [Google Scholar]
- Demo D. Sex differences in cognition: A review and critique of the longitudinal evidence. Adolescence. 1982;17(68):779–788. [Google Scholar]
- Ekstrom RB, French JW, Harman HH, Dermen D. Manual for kit of factor referenced cognitive tests. Educational Testing Service; 1976. [Google Scholar]
- Evans DA, Funkenstein HH, Albert MS, Scherr PA, Cook NR, Chown MJ, et al. Prevalence of Alzheimer's disease in a community population of older persons: Higher than previously reported. The Journal of the American Medical Association. 1989;262(18):2551–2556. [PubMed] [Google Scholar]
- Ferreira L, Ferreira Santos-Galduróz R, Ferri CP, Fernandes Galduróz JC. Rate of cognitive decline in relation to sex after 60 years-of-age: A systematic review. Geriatrics & Gerontology International. 2014;14(1):23–31. doi: 10.1111/ggi.12093. [DOI] [PubMed] [Google Scholar]
- Finkel D, Reynolds CA, Berg S, Pedersen NL. Surprising lack of sex differences in normal cognitive aging in twins. The International Journal of Aging and Human Development. 2006;62(4):335–357. doi: 10.2190/C39X-9QHY-49DM-X9GJ. [DOI] [PubMed] [Google Scholar]
- Finkel D, Reynolds CA, McArdle JJ, Gatz M, Pedersen NL. Latent growth curve analyses of accelerating decline in cognitive abilities in late adulthood. Developmental Psychology. 2003;39(3):535–550. doi: 10.1037/0012-1649.39.3.535. [DOI] [PubMed] [Google Scholar]
- Folstein MF, Folstein SE, McHugh PR. “Mini-mental state”: A practical method for grading the cognitive state of patients for the clinician. Journal of Psychiatric Research. 1975;12(3):189–198. doi: 10.1016/0022-3956(75)90026-6. [DOI] [PubMed] [Google Scholar]
- Fuld PA. Psychological testing in the differential diagnosis of the dementias. In: Katzman R, Terry RD, Bick KL, editors. Alzheimer’s disease: Senile dementia and related disorders. New York: Raven Press; 1978. [Google Scholar]
- Gao S, Hendrie HC, Hall KS. The relationships between age, sex, and the incidence of dementia and Alzheimer disease: A meta-analysis. Archives of General Psychiatry. 1998;55(9):809–815. doi: 10.1001/archpsyc.55.9.809. [DOI] [PubMed] [Google Scholar]
- Garrett SL, Sawyer P, Kennedy RE, McGuire D, Simon RP, Strothers HS, 3rd, et al. Racial and sex differences in associations between activities of daily living and cognition in community-dwelling older adults. Journal of the American Geriatrics Society. 2013;61(12):2174–2180. doi: 10.1111/jgs.12543. [DOI] [PMC free article] [PubMed] [Google Scholar]
- Gerstorf D, Herlitz A, Smith J. Stability of sex differences in cognition in advanced old age: The role of education and attrition. The Journals of Gerontology Series B. Psychological Sciences and Social Sciences. 2006;61(4):245–249. doi: 10.1093/geronb/61.4.p245. [DOI] [PubMed] [Google Scholar]
- Gerstorf D, Ram N, Hoppmann C, Willis SL, Schaie KW. Cohort differences in cognitive aging and terminal decline in the Seattle Longitudinal Study. Developmental Psychology. 2011;47(4):1026–1041. doi: 10.1037/a0023426. [DOI] [PMC free article] [PubMed] [Google Scholar]
- Good CD, Johnsrude IS, Ashburner J, Henson RN, Fristen K, Frackowiak RS. A voxel-based morphometric study of ageing in 465 normal adult human brains. Neuroimage. 2001;14:21–36. doi: 10.1006/nimg.2001.0786. [DOI] [PubMed] [Google Scholar]
- Gur RC, Turetsky BI, Matsui M, Yan M, Bilker W, Hughett P, et al. Sex differences in brain gray and white matter in healthy young adults: Correlations with cognitive performance. Journal of Neuroscience. 1999;19(10):4065–4072. doi: 10.1523/JNEUROSCI.19-10-04065.1999. [DOI] [PMC free article] [PubMed] [Google Scholar]
- Halpern DF, Tan U. Stereotypes and steroids: Using a psychobiosocial model to understand cognitive sex differences. Brain and Cognition. 2001;45(3):392–414. doi: 10.1006/brcg.2001.1287. [DOI] [PubMed] [Google Scholar]
- Herlitz A, Airaksinen E, Nordström E. Sex differences in episodic memory: the impact of verbal and visuospatial ability. Neuropsychology. 1999;13(4):590–597. doi: 10.1037//0894-4105.13.4.590. [DOI] [PubMed] [Google Scholar]
- Hines M, Fane BA, Pasterski VL, Mathews GA, Conway GS, Brook C. Spatial abilities following prenatal androgen abnormality: Targeting and mental rotations performance in individuals with congenital adrenal hyperplasia. Psychoneuroendocrinology. 2003;28(8):1010–1026. doi: 10.1016/s0306-4530(02)00121-x. [DOI] [PubMed] [Google Scholar]
- Hogervorst E, Rahardjo TB, Jolles J, Brayne C, Henderson VW. Gender differences in verbal learning in older participants. Aging Health. 2012;8(5):493–507. [Google Scholar]
- Kaplan E, Goodglass H, Weintraub S. The Boston Naming Test. 2nd. Philadelphia: Lea & Febiger; 1983. [Google Scholar]
- Karlsson P, Thorvaldsson V, Skoog I, Gudmundsson P, Johansson B. Birth cohort differences in fluid cognition in old age: Comparisons of trends in levels and change trajectories over 30 years in three population-based samples. Psychology and Aging. 2015;30(1):83–94. doi: 10.1037/a0038643. [DOI] [PubMed] [Google Scholar]
- Lamar M, Resnick SM, Zonderman AB. Longitudinal changes in verbal memory in older adults: Distinguishing the effects of age from repeat testing. Neurology. 2003;60(1):82–86. doi: 10.1212/wnl.60.1.82. [DOI] [PubMed] [Google Scholar]
- Launer L, Andersen K, Dewey M, Letenneur L, Ott A, Amaducci L, et al. Rates and risk factors for dementia and Alzheimer’s disease. Results from EURODEM pooled analyses. Neurology. 1999;52(1):78–78. doi: 10.1212/wnl.52.1.78. [DOI] [PubMed] [Google Scholar]
- Leonard CM, Towler S, Welcome S, Halderman LK, Otto R, Eckert MA, et al. Size matters: cerebral volume influences sex differences in neuroanatomy. Cerebral Cortex. 2008;18(12):2920–2931. doi: 10.1093/cercor/bhn052. [DOI] [PMC free article] [PubMed] [Google Scholar]
- Little BR. Sex differences and comparability of three measures of cognitive complexity. Psychological Reports. 1969;24(2):607–609. [Google Scholar]
- Luders E, Narr KL, Thompson PM, Rex DE, Woods RP, DeLuca H, et al. Gender effects on cortical thickness and the influence of scaling. Human Brain Mapping. 2006;27(4):314–324. doi: 10.1002/hbm.20187. [DOI] [PMC free article] [PubMed] [Google Scholar]
- Maccoby EE, Jacklin CN. The psychology of sex differences. Stanford, USA: Stanford University Press; 1974. [Google Scholar]
- McDowell I, Xi G, Lindsay J, Tuokko H. Canadian Study of Health and Aging: Study description and patterns of early cognitive decline. Aging, Neuropsychology and Cognition. 2004;11(2–3):149–168. [Google Scholar]
- McKhann G, Drachman D, Folstein M, Katzman R, Price D, Stadlan EM. Clinical diagnosis of Alzheimer's disease: Report of the NINCDS-ADRDA Work Group under the auspices of Department of Health and Human Services Task Force on Alzheimer's Disease. Neurology. 1984;34(7):939–944. doi: 10.1212/wnl.34.7.939. [DOI] [PubMed] [Google Scholar]
- Mitchell TN, Free SL, Merschhemke M, Lemieux L, Sisodiya SM, Shorvon SD. Reliable callosal measurement: Population normative data confirm sex-related differences. American Journal of Neuroradiology. 2003;24(3):410–418. [PMC free article] [PubMed] [Google Scholar]
- Moffat SD, Hampson E, Hatzipantelis M. Navigation in a “virtual” maze: Sex differences and correlation with psychometric measures of spatial ability in humans. Evolution and Human Behavior. 1998;19(2):73–87. [Google Scholar]
- Moffat SD, Zonderman AB, Metter EJ, Blackman MR, Harman SM, Resnick SM. Longitudinal assessment of serum free testosterone concentration predicts memory performance and cognitive status in elderly men. The Journal of Clinical Endocrinology & Metabolism. 2002;87(11):5001–5007. doi: 10.1210/jc.2002-020419. [DOI] [PubMed] [Google Scholar]
- Morris JC. Clinical Dementia Rating. Neurology. 1993;43:2412–2414. doi: 10.1212/wnl.43.11.2412-a. [DOI] [PubMed] [Google Scholar]
- Munro CA, Winicki JM, Schretlen DJ, Gower EW, Turano KA, Munoz B, et al. Sex differences in cognition in healthy elderly individuals. Aging, Neuropsychology, and Cognition: A Journal on Normal and Dysfunctional Development. 2012;19(6):759–768. doi: 10.1080/13825585.2012.690366. [DOI] [PMC free article] [PubMed] [Google Scholar]
- Newcombe F. Missile wounds of the brain: A study of psychological deficits. Oxford, England: Oxford University Press; 1969. [Google Scholar]
- O'Connor D, Pollitt P, Treasure F, Brook C, Reiss B. The influence of education, social class and sex on Mini-Mental State scores. Psychological Medicine. 1989;19(03):771–776. doi: 10.1017/s0033291700024375. [DOI] [PubMed] [Google Scholar]
- Pacheco J, Goh JO, Kraut MA, Ferrucci L, Resnick SM. Greater cortical thinning in normal older adults predicts later cognitive impairment. Neurobiology of Aging. 2015;36(2):903–908. doi: 10.1016/j.neurobiolaging.2014.08.031. [DOI] [PMC free article] [PubMed] [Google Scholar]
- Perlmutter M. Age differences in adults' free recall, cued recall, and recognition. Journal of Gerontology. 1979;34(4):533–539. doi: 10.1093/geronj/34.4.533. [DOI] [PubMed] [Google Scholar]
- Petersen RC, Smith GE, Waring SC, Ivnik RJ, Kokmen E, Tangelos EG. Aging, memory, and mild cognitive impairment. International Psychogeriatrics. 1997;9(Suppl. 1):65–69. doi: 10.1017/s1041610297004717. [DOI] [PubMed] [Google Scholar]
- Phillips LH, Henry JD. Adult aging and executive functioning. In: Anderson V, Anderson P, Jacobs R, editors. Executive functions and the frontal lobes: A lifespan perspective. Hove: Psychology Press; 2008. pp. 57–79. [Google Scholar]
- Proust-Lima C, Amieva H, Dartigues J-F, Jacqmin-Gadda H. Sensitivity of four psychometric tests to measure cognitive changes in brain aging-population–based studies. American Journal of Epidemiology. 2007;165(3):344–350. doi: 10.1093/aje/kwk017. [DOI] [PMC free article] [PubMed] [Google Scholar]
- Raz N, Ghisletta P, Rodrigue KM, Kennedy KM, Lindenberger U. Trajectories of brain aging in middle-aged and older adults: Regional and individual differences. Neuroimage. 2010;51(2):501–511. doi: 10.1016/j.neuroimage.2010.03.020. [DOI] [PMC free article] [PubMed] [Google Scholar]
- Raz N, Yang YQ, Rodrigue KM, Kennedy KM, Lindenberger U, Ghisletta P. White matter deterioration in 15 months: Latent growth curve models in healthy adults. Neurobiology of Aging. 2012;33(2):429e421–429e425. doi: 10.1016/j.neurobiolaging.2010.11.018. [DOI] [PMC free article] [PubMed] [Google Scholar]
- Reitan RM. Trail Making Test: Manual for administration and scoring. Reitan Neuropsychology Laboratory; 1992. [Google Scholar]
- Resnick SM. Sex differences in mental rotations: An effect of time limits? Brain and Cognition. 1993;21(1):71–79. doi: 10.1006/brcg.1993.1005. [DOI] [PubMed] [Google Scholar]
- Resnick SM, Berenbaum SA, Gottesman II, Bouchard TJ., Jr Early hormonal influences on cognitive functioning in congenital adrenal hyperplasia. Developmental Psychology. 1986;22(2):191–198. [Google Scholar]
- Resnick SM, Goldszal AF, Davatzikos C, Golski S, Kraut MA, Metter EJ, et al. One-year age changes in MRI brain volumes in older adults. Cerebral Cortex. 2000;10(5):464–472. doi: 10.1093/cercor/10.5.464. [DOI] [PubMed] [Google Scholar]
- Ritchie K, Kildea D. Is senile dementia "age-related" or "aging-related"? - evidence from metaanalysis of dementia prevalence in the oldest old. Lancet. 1995;346(8980):931–934. doi: 10.1016/s0140-6736(95)91556-7. [DOI] [PubMed] [Google Scholar]
- Salthouse TA. The processing-speed theory of adult age differences in cognition. Psychological Review. 1996;103(3):403–428. doi: 10.1037/0033-295x.103.3.403. [DOI] [PubMed] [Google Scholar]
- Shock NW, Gruelich R, Andres R, Arenberg D, Costa PT, Lakatta E, et al. Normal human aging. The Baltimore Longitudinal Study of Aging. Washington, DC. US Government Printing Office. 1984 [Google Scholar]
- Silverman I, Kastuk D, Choi J, Phillips K. Testosterone levels and spatial ability in men. Psychoneuroendocrinology. 1999;24(8):813–822. doi: 10.1016/s0306-4530(99)00031-1. [DOI] [PubMed] [Google Scholar]
- Sowell ER, Peterson BS, Kan E, Woods RP, Yoshii J, Bansal R, et al. Sex differences in cortical thickness mapped in 176 healthy individuals between 7 and 87 years of age. Cerebral Cortex. 2007;17(7):1550–1560. doi: 10.1093/cercor/bhl066. [DOI] [PMC free article] [PubMed] [Google Scholar]
- Takao H, Hayashi N, Ohtomo K. A longitudinal study of brain volume changes in normal aging. European Journal of Radiology. 2012;81(10):2801–2804. doi: 10.1016/j.ejrad.2011.10.011. [DOI] [PubMed] [Google Scholar]
- von Hippel W, Dunlop SM. Aging, inhibition, and social inappropriateness. Psychology and Aging. 2005;20(3):519–523. doi: 10.1037/0882-7974.20.3.519. [DOI] [PubMed] [Google Scholar]
- Voyer D, Voyer S, Bryden MP. Magnitude of sex differences in spatial abilities: A meta-analysis and consideration of critical variables. Psychological Bulletin. 1995;117(2):250–270. doi: 10.1037/0033-2909.117.2.250. [DOI] [PubMed] [Google Scholar]
- Weber D, Skirbekk V, Freund I, Herlitz A. The changing face of cognitive gender differences in Europe. Proceedings of the National Academy of Sciences. 2014;111(32):11673–11678. doi: 10.1073/pnas.1319538111. [DOI] [PMC free article] [PubMed] [Google Scholar]
- Wechsler D. Wechsler Adult Intelligence Scale-Revised. Vol. 1. New York: Psychological Corporation; 1981. [Google Scholar]
- Wilson JR, De Fries J, McClearn G, Van Denberg S, Johnson R, Rashad M. Cognitive abilities: Use of family data as a control to assess sex and age differences in two ethnic groups. The International Journal of Aging and Human Development. 1975;6(3):261–276. doi: 10.2190/BBJP-XKUG-C6EW-KYB7. [DOI] [PubMed] [Google Scholar]
- Witkin HA, Lewis HB, Hertzman M, Machover K, Meissner PB, Wapner S. Personality through perception: An experimental and clinical study. Oxford, England: Harper; 1954. [Google Scholar]