

Abstract
Objectives
Small intestinal neuroendocrine tumors (SI-NETs) are often detected after they have become metastatic. Using a novel protein array, we identified pathways important in SI-NET metastasis development in surgically resected patients.
Methods
Paired primary tumors and liver metastases from 25 patients undergoing surgical resection for metastatic SI-NETs were harvested. Extracted proteins were separated by SDS gel, and multiplex immunoblots were performed with 136 antibodies. Significant Analysis of Microarray was used to select for differentially expressed proteins. A tissue microarray was constructed from 27 archived specimens and stained by immunohistochemistry.
Results
Comparing primary SI-NETs to matched normal small bowel mucosa, 9 proteins were upregulated and Cyclin E was down-regulated. SI-NET liver metastases demonstrated up-regulation of P-ERK and p27 but down-regulation of CDK2 and CDC25B. When comparing primary SI-NET with their paired liver metastases, cyclin E demonstrated a significant up-regulation in the liver metastasis. Tissue microarray demonstrated higher p38 expression and lower Cdc 25b expression in SI-NETs vs liver metastases and confirmed higher expression of p27 in liver metastases vs normal liver.
Conclusions
Few studies have compared protein expression in paired primary and metastatic SI-NETs. Our findings reveal changes in a limited number of proteins, suggesting these may be targets for therapy.
Keywords: carcinoid, neuroendocrine, small bowel, liver metastasis, proteomics
Introduction
The prevalence and incidence of small intestinal neuroendocrine tumors (SI-NETs) is on the rise.[1, 2] Often presenting late with advanced disease, patients frequently die of their liver metastases. Limited information is currently available regarding the pathways important in the development of metastatic disease. In addition, the biologic behavior of SI-NETs is quite heterogeneous, making outcomes difficult to predict. For this reason, it would be helpful to identify biomarkers that could help to clarify prognosis or to predict response to therapy.
Currently, there are few known clinical, biochemical, and pathologic biomarkers that may help to prognosticate patients. Carcinoid syndrome and carcinoid heart disease are markers of advanced disease and predict poor prognosis. The biomarker chromogranin A is often helpful in diagnosis and surveillance of patients with neuroendocrine tumors, but is also falsely elevated by proton pump inhibition.[3–8] Pathologic features such as Ki67 or mitotic indices provide important but limited information in prediction of prognosis.[9, 10]
Most previous studies on molecular alterations in NET development, proliferation, and metastasis have focused on NETs from primary sites other than small bowel. The importance of the mTOR (mammalian target of rapamycin) pathway in NET pathogenesis has been demonstrated in multiple studies, and is confirmed by clinical trials demonstrating the efficacy of mTOR inhibitors in patients with pancreatic NETS.[11–14] Other groups have similarly shown the importance of the phosphatidylinositol-3-kinase (PI3K)-AKT pathway in tumor cell growth and angiogenesis in pancreatic NET cell lines, as well as in human clinical trials.[15–17]
We have developed and applied a protein array entitled Protein Pathway Array to study tumor biology in a variety of tumor types.[18, 19] Rather than being a nonspecific survey of proteins, this array encompasses proteins and phosphoproteins known to participate in well characterized biologic pathways important for cancer development (Table 1). This array permits an analysis of whether such proteins are up- or down-regulated. The aim of our study was to identify potential proteomic differences between primary SI-NETs and their liver metastases and to elucidate pathways important in metastasis development.
Table 1.
Selected proteins/phosphoproteins used in Protein Pathway Array
| Angiogenesis: FGF, EPO, VEGF, VEGFR, NRP-1, Ang1, PDGF, PDGFR, TGF-beta, TGF-beta Receptor, Endoglin, VE-cadherin, CD31, NOS, COX-2, Id1/Id3, AC133, Angiopoietin, Laminin, Stabilin, Neuropilin, KDR, FLT1, IL8, Prokineticin, TNF alpha, IFN, IL6, COX1, MMP2, MMP9 |
| Apoptosis/Autophagy: Bax, FAS, BAD, BCL2, BIK, BID, BAK, cleaved Caspase 3, cleaved Casepase 7, cleaved Caspase 8, cleaved Caspase 9, TRAF, FADD, TRADD, p53, CD27, BRAF, PARP, XIAP, NFKB, IKB, TAK1, RIP1, Bcl-xL, FLIP, Smac, Cytochrome C, Apaf-1, LC-3I, LC-3II, Raptor, VPS15, Beclin1, TNF |
| Cell signaling: ERK1/2, p-ERK1/2 (Thr202/Tyr204), Akt, p-AKT (Ser473), HGF, HGFR, pHGFR (Y1234/Y1235), IGF, IGFR, TGF, TGFR, Notch 4, Notch 1, p38, p-p38 (Thr180/Tyr182), JNK, p-JNK (Thr183/Tyr185), FGFR, p-FGFR (Tyr653/654), VEGFR, p-VEGFR (Tyr951), PKC, p-PKCalpha (Ser657), p-PKCalpha/beta (Thr638/641), PTEN, p-PTEN (Ser380), PI3K, Ras, Raf, EGFR, p-EGFR (Tyr1068), p-EGFR (Tyr1148), p-EGFR (Tyr1173), Her2, p-Her2 (Tyr1221/1222), PDK1, p-PDK1 (Ser241), mTor, p-mTor (Ser2448), HSP90, NF-kB, IKB, c-Kit, c-Kit (Tyr719), PDGFR, GSK3, beta-catenin, p-beta-catenin (Ser33/37/Thr41), stat3, p-stat3 (Ser727), stat5, p-stat5 (Tyr694), smad, p-smad (Ser463/465), CREB, p-CREB (Ser133) |
| Cell Growth/Cell Proliferation: Rb, P21, P27, P15, P16, P18, P19, CHK1, CHK2, DP-1, MDM2, BRCA1, BRCA2, GADD45, 14-3-3, Myt1, IL18, |
| Cell cycle: CDK2, CDK4, CDK6, CDC2p34, CDC25A, CDC25B, CDC25C, CyclinA, Cyclin B, Cyclin D, Cyclin E, Rb, CyclinA, Cyclin B, Cyclin D, Cyclin E, CDK7 |
| DNA repair: 53BP1, Ape1, ATM, ATR, BLM, Brg1, CK1, CK2, REDD1, Claspin, ERCC1, ERCC2, P53, Rad1, Rad9, Rad50, Rad51, Rad52, Mre11, MSH2, XRCC1 |
| Epithelial-to-mesenchymal transition/Adhesion: CD44, ICAM1, VCAM1, E-Cadherin, Collagen, ECM1, HAS1, Catenin, Integrin, Laminin, MMP1, MMP10, Selectin E, Selectin L, Thrombospondin, |
| Invasion/metastasis: uPA, uPAR, NF-kappaB, AP-1, MMP1, MMP2, MMP9, MMP13, CDH1, CDH2, E-cadherin, N-cadherin, ICAM-1, laminin-5, CD44, osteopontin, VEGF, Connexin 43 (Cx43), Slit2, Robo1, Cas, NM23, MKK4, CCR7, CXCR4 |
| Transcription factor: AR, MYC, CEBF, DR1, E2F, EGR1, ELK1, ETS, FOXA2, FOXO1, ESR1, FOS, GATA, Jun, JunB, JunD, MYB, STAT, TBP, SMAD, PPAR, RB1, REL, E2F1, ER, PR |
Methods
Tissue Specimens and Patient Data
Under an IRB-approved protocol, we retrieved tissue from surgically obtained specimens of SI-NETs and their liver metastases from the prospective Mount Sinai Tissue Bank. Fresh frozen specimens from primary and metastatic sites were collected. Adjacent normal small intestine and normal liver specimens were also harvested.
Protein Pathway Array Analysis
Proteins were extracted, separated on an SDS gel and blotted on a multichannel manifold with 136 antibodies as described elsewhere (Table 1).[18, 19] The correct bands were identified and band densities were determined using BioRad Image system. Significant Analysis of Microarray (SAM) (http://www-stat.stanford.edu/~tibs/SAM/) was used to select the proteins differentially expressed between different groups. Unsupervised hierarchical clustering analysis was performed using BRB Array Tools software v.3.3.0 (htt://linus.nci.nih.gov/BRB-ArrayTools.html).
Tissue Microarray Analysis
We created a tissue microarray with formalin-fixed paraffin-embedded SI-NETs retrieved from the Department of Pathology archives between 1998 and 2010. Formalin-fixed paraffin-embedded tissue from 27 specimens were processed with a manual tissue arrayer (Advanced Tissue Arrayer ATA100, Chemicon International, Temecula, CA) using 1-mm diameter cores in triplicate for tumors and for normal tissue sections. One H&E-stained section for each tissue microarray was prepared for histological confirmation of the tissue sections. 25 specimens had both primary and matched liver tumors.
Four-micrometer-thick histology sections were cut, and immunohistochemical staining was performed.17 Antibodies for p38 (1:50 dilution), XIAP (1:200), p27 (1:200), cyclin E (1:200), Cdc25b (1:50), Stat 3 (1:50), and Cdk4 (1:200) were used. Corresponding negative controls were incubated in the absence of primary antibody. Antibodies specific for NETs, such as chromogranin A, synaptophysin, and neuron-specific enolase were included in the panel as positive controls. A single pathologist (S.W.) examined the immunohistochemical expression profile of the antigens based on their staining intensity and localization pattern (i.e. cell membrane, cytoplasmic or nuclear). Both the extent of distribution and intensity of immunopositivity were recorded for the membrane and cytoplasmic immunostaining, with intensity grading ranging from 0 to 3 and the distribution extent of staining from 0% to 100%. The final staining score (range = 0–300) was obtained by multiplying both scores. For nuclear immunostaining, the percentage of positive nuclei in 200 cells was calculated.
Results
Identification of differentially expressed proteins using Protein Pathway Array
Nine pairs of SI-NET and liver metastasis tissues were obtained from the Mount Sinai Tissue Bank. Of the 136 proteins analyzed, 52 proteins were expressed in these samples (Table 1). 9 proteins were up-regulated in primary SI-NETs compared with matched normal small bowel mucosa (Table 2). These included p-PDK1, PTEN, cdk4, MetRS, p27, XIAP, p38, Stat3, and alpha-tubulin. The degree of overexpression ranged from 3.4- to 21.5-fold in SI-NETs as compared to normal small intestinal tissue. Cyclin E was markedly downregulated in primary SI-NET tissue as compared to normal small bowel mucosa.
Table 2.
Differentially expressed proteins in SI-NET primary and liver metastases as determined by PPA
| A. SI-NET primary vs normal small intestine | ||
|---|---|---|
| Protein | Ratio: Tumor/Normal (fold change) | SAM (q%) |
| p-PDK1 | +3.41 | 4.44 |
| PTEN | +21.47 | 4.44 |
| Cdk4 | +8.53 | 0 |
| MetRS | +8.53 | 0 |
| P27 | +11.95 | 0 |
| XIAP | +9.75 | 0 |
| P38 | +9.66 | 0 |
| Stat 3 | +10.38 | 0 |
| Alpha-tubulin | +11.90 | 0 |
| Cyclin E | −6.67 | 6.67 |
| B. SI-NET liver metastasis vs normal liver | ||
| p-ERK | +5.27 | 0 |
| P27 | +9.61 | 0 |
| Cdk2 | −1.78 | 0 |
| Cdc25B | −50.00 | 0 |
| C. SI-NET liver metastasis vs SI-NET primary | ||
| Cyclin E | +3.48 | 0 |
SI-NET: Small intestinal neuroendocrine tumor; PPA: Protein Pathway Array SAM: Significant Analysis of Microarray
Compared to normal liver tissue, SI-NET liver metastases demonstrated up-regulation of P-ERK and p27 but down-regulation of CDK2 and CDC25B.
When comparing primary SI-NET with their paired liver metastases, cyclin E was the only protein to demonstrate differential expression; there was significant upregulation in the liver metastasis as compared to the primary lesion.
Validation using Tissue Microarray
To validate the PPA results, we selected several proteins to assess their expression on a TMA (Table 3). We chose proteins where there was more than two-fold change in expression between cancer and normal tissue based on PPA and where antibodies were available for Immunohistochemistry assay. We tested p38, XIAP, p27, cyclin E, Cdc25b, Stat3, and Cdk4 in our TMA.
Table 3.
Protein expression patterns determined by TMA
| A. SI-NET primary vs normal small bowel | |||
|---|---|---|---|
| Protein | Number (%) in SI-NET | Number (%) in Normal SI | p |
| P38 nuclear | 20/27 (74.1) | 17/19 (89.5) | 0.27 |
| P38 cytoplasmic | 18/27 (66.7) | 2/19 (10.5) | 0.0002 |
| Cdc25b nuclear | 10/26 (38.4) | 19/19 (100) | <0.0001 |
| Cdc25b cytoplasmic | 5/26 (10.2) | 8/19 (42.1) | 0.11 |
| P27 nuclear | 22/27 (81.5) | 15/19 (78.9) | 1.00 |
| Cyclin E | 27/27 (100) | 19/19 (100) | 1.00 |
| Cdk4 | 12/27 (44.4) | 19/19 (100) | <0.0001 |
| B. SI-NET liver metastasis vs normal liver | |||
|---|---|---|---|
| Protein | Number (%) in Liver Met | Number (%) in Normal Liver | p |
| P38 nuclear | 8/25 (32.0) | 1/21 (4.8) | 0.03 |
| P38 cytoplasmic | 7/25 (28.0) | 0/21 (0) | 0.01 |
| Cdc25b cytoplasmic | 12/25 (48) | 21/21 (100) | 0.03 |
| P27 nuclear | 20/25 (80) | 4/21 (19) | <0.0001 |
| Cyclin E | 25/25 (100) | 13/21 (62) | 0.0008 |
| Cdk4 | 12/25 (48) | 0/21 (0) | 0.0001 |
| C. SI-NET vs SI-NET liver metastasis | |||
|---|---|---|---|
| Protein | Number (%) in SI-NET | Number (%) in Liver Met | p |
| P38 nuclear | 20/27 (74.1) | 8/25 (32) | 0.0002 |
| P38 cytoplasmic | 18/27 (66.7) | 7/25 (28) | 0.0005 |
| Cdc25b cytoplasmic | 5/26 (19.2) | 12/25 (48) | 0.03 |
| P27 nuclear | 22/27 (81.5) | 20/25 (80) | 1.00 |
| Cyclin E | 27/27 (100) | 25/25 (100) | 1.00 |
| Cdk4 | 12/27 (44.4) | 12/25 (48) | 1.00 |
TMA: Tissue Microarray; SI-NET: Small intestinal neuroendocrine tumor; SI: small intestine
In comparing primary SI-NETs and normal small bowel, TMA demonstrated statistically significant upregulation of cytoplasmic p38 MAP kinase, confirming the findings of the Protein Pathway Array (Figure 1, Table 2). TMA also demonstrated statistically significant downregulation of nuclear Cdc25B and Cdk4. The finding of the downregulation of Cdk4 is different from the findings of the Protein Pathway Array, which found upregulation of Cdk4 in the SI-NET as compared to normal small bowel.
Figure 1.
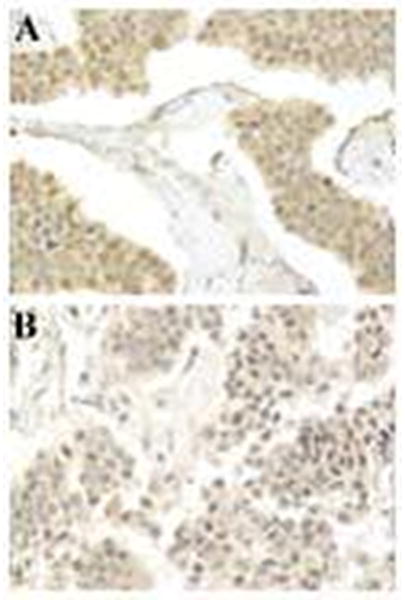
Immunohistochemical stain for p38 shows increased nuclear and cytoplasmic expression in a primary small intestinal NET (A) compared with the metastatic liver tumor (B) from the same patient (magnification X 400).
Compared to normal liver tissue, SI-NET liver metastases demonstrated statistically significant upregulation of p27, confirming the findings of the Protein Pathway Array. TMA also demonstrated statistically significant upregulation of p38, Cdk4, and Cyclin E. SI-NETs liver metastases also revealed downregulation of Cdc25B.
In comparison of SI-NETs and their liver metastases, TMA demonstrated higher p38 expression and lower Cdc 25b expression in SI-NETs vs liver metastases (Figure 1 and Table 2).
Discussion
Small intestinal NETs have heterogeneous behavior that often presents clinical challenges. Because deaths due to SI-NETs are usually caused by metastatic disease, it is important to understand important pathways in tumor growth and metastasis development.
TMA confirmed some, but not all, specific PPA findings. Both PPA and TMA confirmed statistically significant up-regulation of cytoplasmic p38 in primary SI-NETs, as compared to normal small bowel. PPA and TMA also confirmed up-regulation of p27 in liver metastases compared to normal liver.
In some instances, TMA results were different from PPA findings, or elicited new findings. For instance, TMA demonstrated Cdk4 down-regulation in primary SI-NETs as compared to normal small bowel; this contrasted with PPA, which showed up-regulation of Cdk4 in SI-NET as compared to normal small bowel. TMA alone demonstrated significant up-regulation of p38, Cdk4, and Cyclin E and down-regulation of Cdc25B in liver metastases compared to normal liver. TMA alone also demonstrate higher p38 expression and lower Cdc25b expression in SI-NETs as compared to liver metastases. Cdc25b plays an important role in the initial activation of the cell cycle, allowing mitosis to occur. Cdc25b has been found to be overexpressed in many neoplasms, including breast, thyroid, laryngeal, esophageal, gastric, and other cancers.[20] Overexpression may be associated with poor prognosis and high grade tumors.[20]
Our data demonstrated increased p27 expression in SI-NETs hepatic metastases compared to adjacent normal liver tissue. P27 is a member of the kinase inhibitor protein (KIP) family, with a negative effect on cyclin E/CDK2 and cyclin A/CDK2 and a positive effect on cyclin D/CDK complexes. A loss of p27 seems to have prognostic potential in breast, lung, colon, ovary, and prostate carcinomas.[21]
Our data also demonstrated increased p38 in primary SI-NETs as compared to normal small bowel. P38 catalyzes activation of other downstream kinases in cell-cell signaling.[22]
A strength of our study is that we analyzed primary and metastatic tissues from the same patients, as well as adjacent normal small intestine and liver. Previous studies have focused mainly on pancreatic NETs or a heterogeneous population of gastroenteropancreatic NETs, and analyzed a group of primary tumors that were not necessarily linked to metastases from the same patients.[23, 24] In addition, we applied a protein pathway approach that allowed us to identify pathways that are well known to play a role in tumor cell biology. By designing TMAs, we were able to confirm some of the findings of the PPA using an independent set of tumor tissues. The advantage of analyzing proteins and phosphoproteins is that we obtain a better understanding of the post-translational processing of DNA or RNA (used in other studies) which should provide a closer approximation of pathways that are indeed active in these tumors.
Despite this, our study does have some limitations. Because it is difficult to obtain tissue from synchronous primary and liver metastases of patients with SI-NETs, our sample size is limited. In addition, some of the markers that emerged as being either up- or down-regulated by PPA were not confirmed by TMA, which has been observed in our previous study.[25] It is probably due to the fact that IHC can determine the localization while PPA measures total protein, suggesting that these methods are complementary to each other.
Our study found that after analyzing many proteins involved in different cancer biology pathways, the proteins that seemed to be most important were those involved in cell cycle and proliferation. This confirms the importance of the mitotic index as an important component of how we predict tumor aggressiveness in SI-NETs. Future studies are needed to determine whether other pathways for which therapeutic agents are already developed, such as MAPK or others, might enhance our ability to treat SI-NETs or possibly predict clinical outcome.
Acknowledgments
Funding: This work was supported by the National Center for Advancing Translational Sciences at the National Institutes of Health [Grant No. KL2TR000069 to MK Kim] and in part by the American Cancer Society [MRSG-14-014-01-CCE to MK Kim].
Footnotes
Disclosure: The authors declare the following conflicts of interest: MKK, FY, DW, MC, SCW, RRPW, M. Shafir, M. Schwartz, DYZ, SI (no conflicts); SR (Ethicon).
References
- 1.Lawrence B, Gustafsson BI, Chan A, et al. The epidemiology of gastroenteropancreatic neuroendocrine tumors. Endocrinol Metab Clin North Am. 2011;40:1–18. vii. doi: 10.1016/j.ecl.2010.12.005. [DOI] [PubMed] [Google Scholar]
- 2.Yao JC, Hassan M, Phan A, et al. One hundred years after “carcinoid”: epidemiology of and prognostic factors for neuroendocrine tumors in 35,825 cases in the United States. J Clin Oncol. 2008;26:3063–3072. doi: 10.1200/JCO.2007.15.4377. [DOI] [PubMed] [Google Scholar]
- 3.Nikou GC, Marinou K, Thomakos P, et al. Chromogranin a levels in diagnosis, treatment and follow-up of 42 patients with non-functioning pancreatic endocrine tumours. Pancreatology. 2008;8:510–519. doi: 10.1159/000152000. [DOI] [PubMed] [Google Scholar]
- 4.Ter-Minassian M, Chan JA, Hooshmand SM, et al. Clinical presentation, recurrence, and survival in patients with neuroendocrine tumors: results from a prospective institutional database. Endocr Relat Cancer. 2013;20:187–196. doi: 10.1530/ERC-12-0340. [DOI] [PMC free article] [PubMed] [Google Scholar]
- 5.Turner GB, Johnston BT, McCance DR, et al. Circulating markers of prognosis and response to treatment in patients with midgut carcinoid tumours. Gut. 2006;55:1586–1591. doi: 10.1136/gut.2006.092320. [DOI] [PMC free article] [PubMed] [Google Scholar]
- 6.Vinik AI, Silva MP, Woltering EA, et al. Biochemical testing for neuroendocrine tumors. Pancreas. 2009;38:876–889. doi: 10.1097/MPA.0b013e3181bc0e77. [DOI] [PubMed] [Google Scholar]
- 7.Stridsberg M. The use of chromogranin, synaptophysin and islet amyloid polypeptide as markers for neuroendocrine tumours. Ups J Med Sci. 1995;100:169–199. doi: 10.3109/03009739509178905. [DOI] [PubMed] [Google Scholar]
- 8.Stridsberg M, Oberg K, Li Q, et al. Measurements of chromogranin A, chromogranin B (secretogranin I), chromogranin C (secretogranin II) and pancreastatin in plasma and urine from patients with carcinoid tumours and endocrine pancreatic tumours. J Endocrinol. 1995;144:49–59. doi: 10.1677/joe.0.1440049. [DOI] [PubMed] [Google Scholar]
- 9.Rindi G, Kloppel G, Couvelard A, et al. TNM staging of midgut and hindgut (neuro) endocrine tumors: a consensus proposal including a grading system. Virchows Arch. 2007;451:757–762. doi: 10.1007/s00428-007-0452-1. [DOI] [PubMed] [Google Scholar]
- 10.Edge SB, Compton CC. The American Joint Committee on Cancer: the 7th edition of the AJCC cancer staging manual and the future of TNM. Ann Surg Oncol. 2010;17:1471–1474. doi: 10.1245/s10434-010-0985-4. [DOI] [PubMed] [Google Scholar]
- 11.Jiao Y, Shi C, Edil BH, et al. DAXX/ATRX, MEN1, and mTOR pathway genes are frequently altered in pancreatic neuroendocrine tumors. Science. 2011;331:1199–1203. doi: 10.1126/science.1200609. [DOI] [PMC free article] [PubMed] [Google Scholar]
- 12.Missiaglia E, Dalai I, Barbi S, et al. Pancreatic endocrine tumors: expression profiling evidences a role for AKT-mTOR pathway. J Clin Oncol. 2010;28:245–255. doi: 10.1200/JCO.2008.21.5988. [DOI] [PMC free article] [PubMed] [Google Scholar]
- 13.Yao JC, Shah MH, Ito T, et al. Everolimus for advanced pancreatic neuroendocrine tumors. N Engl J Med. 2011;364:514–523. doi: 10.1056/NEJMoa1009290. [DOI] [PMC free article] [PubMed] [Google Scholar]
- 14.Pavel ME, Hainsworth JD, Baudin E, et al. Everolimus plus octreotide long-acting repeatable for the treatment of advanced neuroendocrine tumours associated with carcinoid syndrome (RADIANT-2): a randomised, placebo-controlled, phase 3 study. Lancet. 2011;378:2005–2012. doi: 10.1016/S0140-6736(11)61742-X. [DOI] [PubMed] [Google Scholar]
- 15.Gloesenkamp CR, Nitzsche B, Ocker M, et al. AKT inhibition by triciribine alone or as combination therapy for growth control of gastroenteropancreatic neuroendocrine tumors. Int J Oncol. 2012;40:876–888. doi: 10.3892/ijo.2011.1256. [DOI] [PubMed] [Google Scholar]
- 16.Hopfner M, Schuppan D, Scherubl H. Treatment of gastrointestinal neuroendocrine tumors with inhibitors of growth factor receptors and their signaling pathways: recent advances and future perspectives. World J Gastroenterol. 2008;14:2461–2473. doi: 10.3748/wjg.14.2461. [DOI] [PMC free article] [PubMed] [Google Scholar]
- 17.Yao JC, Phan A, Hoff PM, et al. Targeting vascular endothelial growth factor in advanced carcinoid tumor: a random assignment phase II study of depot octreotide with bevacizumab and pegylated interferon alpha-2b. J Clin Oncol. 2008;26:1316–1323. doi: 10.1200/JCO.2007.13.6374. [DOI] [PubMed] [Google Scholar]
- 18.Ye F, Che Y, McMillen E, et al. The effect of Scutellaria baicalensis on the signaling network in hepatocellular carcinoma cells. Nutr Cancer. 2009;61:530–537. doi: 10.1080/01635580902803719. [DOI] [PubMed] [Google Scholar]
- 19.Zhang DY, Wu J, Ye F, et al. Inhibition of cancer cell proliferation and prostaglandin E2 synthesis by Scutellaria baicalensis. Cancer Res. 2003;63:4037–4043. [PubMed] [Google Scholar]
- 20.Boutros R, Lobjois V, Ducommun B. CDC25 phosphatases in cancer cells: key players? Good targets? Nat Rev Cancer. 2007;7:495–507. doi: 10.1038/nrc2169. [DOI] [PubMed] [Google Scholar]
- 21.Chiarle R, Pagano M, Inghirami G. The cyclin dependent kinase inhibitor p27 and its prognostic role in breast cancer. Breast Cancer Res. 2001;3:91–94. doi: 10.1186/bcr277. [DOI] [PMC free article] [PubMed] [Google Scholar]
- 22.Roux PP, Blenis J. ERK and p38 MAPK-activated protein kinases: a family of protein kinases with diverse biological functions. Microbiol Mol Biol Rev. 2004;68:320–344. doi: 10.1128/MMBR.68.2.320-344.2004. [DOI] [PMC free article] [PubMed] [Google Scholar]
- 23.Marinoni I, Kurrer AS, Vassella E, et al. Loss of DAXX and ATRX are associated with chromosome instability and reduced survival of patients with pancreatic neuroendocrine tumors. Gastroenterology. 2014;146:453–460. e455. doi: 10.1053/j.gastro.2013.10.020. [DOI] [PubMed] [Google Scholar]
- 24.Kim HS, Lee HS, Nam KH, et al. p27 Loss Is Associated with Poor Prognosis in Gastroenteropancreatic Neuroendocrine Tumors. Cancer Res Treat. 2014;46:383–392. doi: 10.4143/crt.2013.102. [DOI] [PMC free article] [PubMed] [Google Scholar]
- 25.Liu W, Wu Y, Wang L, et al. Protein signature for non-small cell lung cancer prognosis. Am J Cancer Res. 2014;4:256–269. [PMC free article] [PubMed] [Google Scholar]