

Abstract
The purpose of this pilot study was to determine whether blood-borne microvesicles from newly diagnosed glioblastoma patients could be used as biomarkers. We collected 2.8 mL blood from 16 post-operative patients at the time that they were being simulated for chemoradiation therapy (radiation with concurrent temozolomide). Two additional samples were collected during chemoradiation therapy and a final sample was collected at the end of chemoradiation therapy. Patients continued with the therapy suggested by their physicians, based on tumor conference consensus and were followed for recurrence and overall survival. Microvesicles were isolated using serial centrifugation and stained for surface markers (Annexin V for phosphotidyl serine, CD41 for platelets, anti-EGFR for tumor cells, and CD235 for red blood cells). Flow cytometry analysis was performed. Our findings provide initial evidence that increases in Annexin V positive microvesicle levels during chemoradiation therapy are associated with earlier recurrence and shorter overall survival in newly diagnosed glioblastoma patients. The effect is dramatic, with over a four-fold increase in the hazard ratio for an individual at the 75th versus the 25th percentile. Moreover the pattern of Annexin V positive microvesicles remain significant after adjustment for confounding clinical variables that have previously been shown to be prognostic for recurrence and survival. Inclusion of neutrophil levels at the start of chemoradiation therapy in the model yielded the largest attenuation of the observed association. Further studies will be needed to verify and further investigate the association between these two entities.
Keywords: Glioblastoma, Microvesicles, Outcome, Biomarker, Exosomes, Circulating vesicles
Introduction
Glioblastoma (GB) is a devastating disease, with a median survival of 14.2 months in patients treated with the current standard of care (SOC)—surgical resection followed by concurrent and adjuvant chemoradiation therapy (CRT) based on the Stupp protocol [1]. Recent data suggests that using low intensity, alternating electric fields prevents the normal mitotic process and causes cancer cell death, improving outcome in newly diagnosed patients (TT Fields, Novocure) [2, 3]. However, none of the drug therapies that have been added to the SOC appear to increase time to recurrence or survival. In a review, Batchelor et al. conclude that “Despite promising phase II clinical [therapeutic drug] trial results and patient benefit in terms of clinical improvement and longer progression-free survival, [for example] an overall survival benefit has not been demonstrated in four randomized phase III trials of bevacizumab in newly diagnosed GB [4].” Vaccines against EGFRvIII [5] and CAR-T [6] cells are being studied in animal models and experimentally in humans, but to date, neither have demonstrated efficacy in newly diagnosed patients.
Information provided by biomarkers has the potential to aid in the identification of adjuvant therap(ies) for GB. Biomarkers are “a characteristic that is objectively measured and evaluated as an indicator of normal biologic processes, pathogenic processes or pharmacological responses to a therapeutic intervention [7].” They have the potential to aid physicians in identifying patients at highest risk of recurrence and/or death, help select therapeutic targets and stratify patients for clinical trials of therapeutic medicines or devices. Biomarkers based on blood or other body fluids can be particularly useful, as they are minimally invasive [8] and repeatable. Examples of these ‘liquid biopsies’ include extracellular circulating vesicles (ECV), also referred to exosomes, microvesicles (MV), and/or microparticles, fragments of tumor DNA and RNA that are shed into the blood, and circulating tumor cells (CTCs). ECV uniquely have the ability to provide information on body systems that modulate tumor biology i.e. the immune system in addition to the tumor cell information. CTC and DNA/RNA analyses provide important biologic information, but are limited to the neoplastic cells.
ECV are 50–3000 nm diameter bodies with a bi-lipid membrane that are released from normal and neoplastic cells [9, 10] under conditions of stress, activation and/or proliferation. ECVs contain proteins, DNA, miRNA, RNA, and lipids representing a subproteome of the cell of origin [9–12]. Their presence and number can be prognostic and/ or predictive, and our understanding of their role in many diseases, including cancer, is growing [8, 13, 14]. ECV are known to be important as intercellular signaling sources and this mechanism is thought to be responsible for their ability to act as measurable indicators of disease.
Our recent published work showed that the mean number of Annexin V1 positive (AnnV+) ECV > 300 nm diameter differs between GB patients treated with the Stupp protocol who go on to experience pseudoprogression versus true progression [15]. Herein, we describe an association between an increase in the number of AnnV + MV in the blood during chemoradiation therapy (CRT) and poor patient outcome. We have also probed several other tumor and clinical features and our findings provide initial intriguing evidence that the number of MV, their trend over time and/or the presence of several surface marker may ultimately be valuable in the management of GB patients.
Methods
Patients
The University of Pennsylvania Institutional Review Board (IRB) approved informed consent for this study. All patients had a diagnosis of GB, and surgery (including biopsy, with or without steroids and/or anticonvulsants) was their only treatment prior to protocol entry. Patients were asked to provide blood samples before, twice during and at the end of CRT. Patients were taken off study at their or their physician’s request. Table 1 summarizes the demographics of the 16 newly diagnosed GB patients, their clinical and tumor findings, and their treatments. A subset of these patients was included in the previous report on MV number where we assessed the ability of MV to differentiate true progression from pseudoprogression (treatment effect) [15]. Data on the number of MV in normal volunteers was also included in that report.
Table 1.
Demographic and tumor information, and clinical predictors for 16 patients with newly diagnosed GB
| Category | Category | Value |
|---|---|---|
| Age at diagnosis (years) | NA | 59 (55–67) |
| Sex | Male | 10 (62 %) |
| Female | 6 (38 %) | |
| Extent of resection | Sub total resection | 5 (31.3 %) |
| Gross total resection | 5 (31.3 %) | |
| Near total resection | 4 (25 %) | |
| Biopsy/Partial resection | 2 (12.5 %) | |
| EGFR vIII status | Positive | 9 (56.3 %) |
| Negative | 6 (37.5 %) | |
| No data | 1 (6.25 %) | |
| Ki67 proliferation (percent of cells in 10 high power fields) |
Average | 28 % |
| Range | 5–70 % | |
| NR | 2% | |
| MGMT (methylguanine-DNA-methyltransferase) methylation status |
Methylated | 3 (18.75 %) |
| Not methylated | 12 (75 %) | |
| NP | 1 (6.25 %) | |
| KPS (Karnofsky performance status) | Pre-op | 88.8 (90, 90) |
| ECOG (Eastern Cooperative Oncology Group) performance status |
Pre-op | 0.75 (0–3.0) |
| RPA (Recursive partitioning analysis) | Pre-op | 4.19 (4.0–5.0) |
| Growth post-operatively or during CRT | Growth | 7 (43.75 |
| No growth | 9 (56.25) | |
| Therapy during CRT | Avastin | 1 (6 %) |
| Steroids | 1 (6 %) | |
| No additional therapy | 14 (88 %) | |
| Additional treatments after recurrence | Surgery | 6 (20.7 %) |
| None | 5 (17.2 %) | |
| Avastin | 5(17.2 %) | |
| EGFR vIII vaccine | 5(17.2 %) | |
| Chemotherapy | 5(17.2 %) | |
| CAR-T cells | 2 (7.9 %) | |
| Novocure/optune | 1 (3.7 %) | |
| Neutrophil count (thousand per μL blood) | Pre-op | 7.9 (4.5, 10.1) |
| At start of CRT | 7.0 (4.1, 10.1) | |
| At end of CRT | 3.9 (1.9, 5.9) | |
| Neutrophil:lymphocyte ratio | Pre-op | 5.2 (2.1, 6.9) |
| At start of CRT | 5.33 (2.1, 6.7) | |
| At end of CRT | 5.03 (2.6, 6.8) |
Values shown are medians with interquartile range (IQR) or counts with percentages
NP not performed because there were either too many small groups or not enough samples, NR not reported
Clinical assessments
After tissue diagnosis of GB, patients were followed post operatively, during and following CRT and then at intervals as defined by their treatment team. MRI images were made following surgery, at simulation and at the completion of CRT; additional imaging studies were made at intervals determined by the treating physician.
Therapy
Maximum safe surgical resection was performed followed by CT/MRI-based treatment planning. The initial volume of the cavity plus the MRI-determined enhancing tumor and flair abnormality volumes were expanded by 1.5 cm and treated at 200 cGy per fraction to 4600 cGy. The fields were then decreased in size to include the cavity and enhancing tissue and continued at 200 cGy per fraction to 6000 cGy for a total of 30 fractions. One of the patients received protons as part of their therapy. All patients received concurrent daily TMZ at 75 mg/m2 and began adjuvant TMZ approximately one-month post radiation. One patient received steroids during therapy and one patient began Avastin in the last portion of his/her CRT, both attributable to increasing symptoms/MRI findings. When patients experienced symptoms and/or treatment progression, they were assigned to an additional treatment or a clinical trial considered optimal by their physician.
Blood collection
2.8 mL peripheral blood was collected from GB patients into a plastic sodium citrate vacutainer tube (BD Scientific, 363083) at the time points described above. Blood tubes were maintained in a vertical position at room temperature until addition of a fixative (Caltag, Fix and Perm part A), approximately 1 h after blood collection.
Blood processing
The technical aspects of blood processing have been previously described [15]. Briefly, 0.9 mL blood was added to 0.1 mL of filtered Caltag A and allowed to sit at room temperature for 60 min. This was centrifuged at 300g for 20 min at RT. 0.36 mL of the plasma supernatant was mixed with 0.6 mL of minimal buffer (isotonic NaCl and KCl with 10 mM Hepes) and 11 mM citrate. This was centrifuged at 2500g for 20 min at RT to remove platelets. Finally, the platelet-free supernatant was centrifuged at 15,000g (30 min at RT) to give a high-speed supernatant (HSS) and pellet (HSP). Pellets were resuspended in 150 μL of their appropriate supernatant. Resuspended pellets and supernatants were then diluted with an equal volume of minimal buffer containing 10 % DMSO and frozen at −75 °C. MV from the final pellet (high speed pellet, HSP) were assessed for this study.
Cryo-electron microscopy
C-flat holey carbon transmission electron microscope grids (Protochips, Raleigh, NC) were glow discharged for 20 s at 25 mA to create a hydrophilic surface for 3 μL of blood plasma. A thin film was formed by blotting the grid with filter paper. Vitreous ice was formed by rapid plunging of the grid into liquid ethane cooled to −180 °C by liquid nitrogen. Grids were cryogenically observed at −178 °C in an FEI (Hillsboro, OR) Tecnai-12 microscope, which was operated at 80 keV. Images were recorded on a Gatan (Warrendale, PA) US 1000 20482 CCD camera.
Flow cytometry
The methods for preparation, running and analysis of flow cytometry of the HSP have been previously described [15]. Briefly, samples were thawed at 37 °C and gently vortexed. To detect MV, minimal buffer with 3 mM Ca++ was supplemented with Pacific Blue labeled Annexin V and fluorescently labeled anti-EGFR for tumor-derived MV [17], anti-CD41 for MV from platelets [18] and anti-CD235 for MV from RBC [19]. A FACS-Canto, 3-laser instrument (violet, blue, red) was set so that 3-μ polystyrene beads were situated at about 105 on both FSC & SSC log scales. Under these conditions 1-μ beads were easily observed, but 0.3 μ beads were only partially resolved depending on the daily “mood” of the cytometer. The fluorescent scales were set so that background fluorescence from the 3 μ beads was at ~2000. Each sample was run at medium speed until 4000 beads were counted (0.08 mL ~ 80 s) and the results were analyzed using FlowJo software (FlowJo, LLC, Ashland Oregon).
Statistical analyses
The linear rate of change in each proposed biomarker between the time of simulation and the end of CRT was determined using least squares. We described the Ann + ve MV at the end of CRT and the rates of change in the proposed biomarkers using medians and the interquartile range (IQR). The demographic and clinical characteristics of the sample were similarly described, and the categorical variables were described using percentages. We used the Kaplan–Meier method to estimate the median time to recurrence and overall survival time for the cohort as a whole and for subgroups of interest. Lower 95 % CI are reported; upper 95 % CI are not yet available due to the limited number of events. Using a Cox model, we first estimated the univariable association between the risk (hazard rate, HR) of recurrence or death and several demographic or clinical factors (age at diagnosis, performance score, neutrophil to lymphocyte ratio or neutrophil level at time of surgery or start of CRT) that are thought to have an association with recurrence or death based on previous studies. These are subsequently referred to as ‘clinical’ predictors. We also individually estimated the association between the rate of change in each biomarker or the biomarker level at the end of CRT and the risk of recurrence or death. While our sample size prevented extensive multivariable modeling, we then explored models aimed at determining whether the association between Ann + ve MV, either level at the end of CRT, or change during CRT, was associated with recurrence or death after adjustment for potential confounding by the ‘classic predictors’. Potential confounders included demographic or clinical factors that achieved a p value <0.15 in univariate analyses. Due to the small sample size, these models were limited to no more than two predictors, the Ann + ve variable and one other predictor. Because the goal of this study was simply to evaluate the potential for confounding, the second variable was retained in the model along with the Ann + ve variable irrespective of the magnitude or the statistical significance of its association with outcome. Type I error rates for the determination of the association between recurrence or death and the Ann + ve MV variables were set to 0.05; all hypotheses tests were one-sided reflecting the specific scientific goal of determining whether increases in MV had a negative impact on outome. Two-sided large-sample 90 % confidence intervals (CI) are based on the estimated coefficients in the Cox model.
Results
Description of the sample
Table 1 describes the demographics, tumor and treatment information and clinical predictors (MGMT, age, performance status {ECOG and KPS}, RPA, EGFRvIII) for the 16 patients who comprise our data set. Ten patients were male and six were female; all were Caucasian with a median age at diagnosis of GB of 59 years. All patients had a surgical diagnosis of GB based on tissue from their initial surgery per review by a single pathologist (MM-L). Review of MRI studies following surgery demonstrated that five patients had subtotal resections, five patients had gross total resections, four patients had near total resections and two patients had a stereotactic biopsy or planned partial resection. Molecular testing indicated that 12 of 15 tumors were non-methylated and 3 of 15 tumors were methylated at the promoter region of MGMT at initial surgery; this assay was not performed in one patient. Nine of 15 tumors were positive for real-time polymerase chain reaction (PCR) or next-generation sequencing (NGS) EGFRvIII mutations at initial surgery; this assay was not performed in one patient. The average Ki67 count was 28.5 %, with a range of 5–70 %. One patient’s tumor contained an IDH-1 R132H mutation. Because neutrophil count and neutrophil to lymphocyte (N:L) ratio have been reported to be associated with GB patient outcome [20, 21], we measured them before surgery, at the start of CRT and at the end of CRT (Table 4).
Table 4.
Risk of recurrence or death with clinical predictors
| Predictor | Time point | RECURRENCE |
DEATH |
||
|---|---|---|---|---|---|
| HR (90 % CI) | p value | HR (90 % CI) | p value | ||
| Neutrophil count per (thousand per μL) increase+ | @ surgery | 1.00 (0.9, 1.1) | 0.40 | 1.03 (0.9, 1.2) | 0.41 |
| Start CRT | 1.3 (1.1, 1.5) | 0.003 | 1.20 (1.0, 1.4) | 0.013 | |
| End CRT | 1.1 (0.9, 1.3) | 0.24 | 1.03 (0.8, 1.4) | 0.44 | |
| N:L ratio per 1 unit increase+ | At surgery | 0.93 (0.81, 1.07) | 0.20 | 1.00 (0.8, 1.2) | 0.49 |
| Start CRT | 1.17 (1.06, 1.30) | 0.006 | 1.14 (1.0, 1.3) | 0.026 | |
| End CRT | 1.06 (0.9, 1.2) | 0.21 | 1.02 (0.9, 1.2) | 0.44 | |
| Age per 10 years | @ diagnosis | 1.07 (0.7, 1.5) | 0.40 | 1.44 (0.8, 2.8) | 0.17 |
| ECOG per 1 unit increase+ | @ surgery | 3.03 (1.5, 6.3) | 0.004 | 3.00 (1.3, 6.9) | 0.009 |
| MGMT per 1 unit increase+ | @ surgery | 0.91 (0.2, 3.4) | 0.45 | 1.11 (0.2, 7.4) | 0.46 |
| KPS per 10 unit increase+ | @ surgery | 0.41 (0.2, 0.9) | 0.035 | 0.51 (0.2, 1.3) | 0.11 |
| EGFR vIII (positive versus negative) | @ surgery | 0.82 (0.3, 2.5) | 0.386 | 0.298 (0.1, 2.3) | 0.148 |
Values shown are the hazard ratio (HR) and the 90 % CI. P values are for the test of association with the predictor
raw MV count
CRT was begun between 29 and 68 days post surgery (mean, median time of 41, 41.5 days respectively); the patient with an interval of 68 days had a wound infection. The median patient follow-up at analysis was 354 days with 9/16 (56 %) alive at the time of analysis; 13 patients had experienced at least 1 recurrence and 7 had died. All living patients had a minimum of 6 months follow-up. Median time to recurrence in the whole group was 235 days (7.7 months) and median OS was 536 days (17.6 months.)
Description of MV, their levels and temporal patterns of change
A cryo-electron microscopic image of the MV collected from patient blood is shown in Fig. 1. This image shows multiple MV, each with a bi-lipid membrane and containing materials referred to as “cargo.” The MV span a range of sizes and shapes. Some protein aggregates, probably from the serum are seen at 12 o’clock on the image.
Fig. 1.
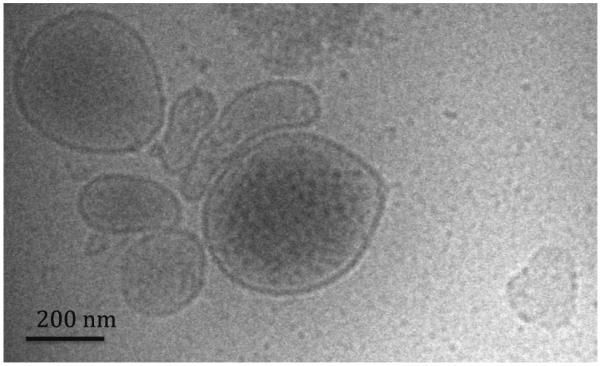
Cryo-transmission electron microscopy of a sample of human microvesicles
We studied the number of MV at the start, twice during and at completion of CRT; blood samples could not be collected in all patients at each time point for various logistical reasons. The average number of blood collections for the whole group of patients was 3.1, with six patients each having three or four collections, and four patients having two collections. Based on these data, we noted the values at each time point and calculated the change over time (slope of best linear fit) in the number of MV during CRT. Figure 2a, b show the clinical course of two patients following completion of CRT. One patient has an increasing MV count and had a short interval to recurrence and death. The other patient had a decreasing MV count during CRT and remains alive. In Fig. 3, we show the MV values and slope of all 16 patients, grouped by their time of recurrence. While there is heterogeneity in each of the groups, the data supports the conclusion that individuals with shorter time to recurrence (Fig. 3, left panel) have a trend toward more positive slopes while a longer time to recurrence is associated with negative slopes. The individual slopes for each patient are shown in the Supplemental Fig. 1S.
Fig. 2.

Examples of data in two patients with opposite trends in number of AnnV + MV; blood samples were taken before, twice during and at the end of CRT. The y-axis is the raw number of MV as recorded by FCM. This value can be multiplied by the dilution factor, 50 and then by ≈2 to account for plasma versus whole blood, in order to estimate the number of MV/mL in blood. Graphs include the timing of critical clinical events (*). Note that numerical value of the axes are not the same in both patients. Patient 1, Fig. 2a has a decreasing slope during CRT and had a recurrence at 580 days and was alive at 818 days. Patient 7, Fig. 2b has an increasing slope with first recurrence at 199 days and an overall survival of 274 days
Fig. 3.
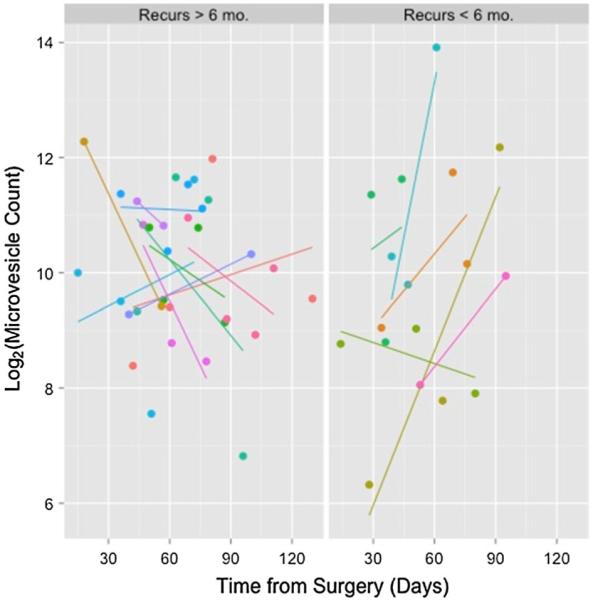
AnnV + MV numbers and best linear fit (slope) during CRT in 16 patients with either early (≤ 6 mo.) or late (>6 mo.) recurrence. Note that the dependent variable is plotted on a log2 scale
All MV were stained with four surface markers; Annexin binding was used for phosphotidyl serine (PS) on the MV surface, CD41 for platelet-derived MV, EGFR for tumor cell-derived MV, and CD235 for RBC-derived MV. Three metrics were initially used to describe MV patterns during CRT (a) the rate of change (slope of best fit line) during therapy, (b) positive versus negative slope, and (c) the number of vesicles at the end of CRT. The summary of these MV data sets for all patients appears in Table 2. The reported values are based on counts directly from the FCM but can be multiplied by 50 to determine MV per ml plasma or 100 to determine the MV per ml blood. Because absolute levels of MV based on FCM differ substantially by lab and by preparation, we report the risk of recurrence or death in terms of interquartile range (IQR).
Table 2.
Median (IQR) levels of markers at final clinical visit and rate of change over treatment
| Marker | Median # vesicles at final visit ×103 (IQR) |
Median rate of linear change during therapy ×10−3 (IQR) |
Proportion of subjects with positive rate of change over time |
|---|---|---|---|
| PHOSPHOTIDYL-SERINE | 1.08 (0.6, 2.0) | 0.60 (−20.0, 37.5) | 50 % (16) |
| PLATELETS | 0.77 (0.3, 1.4) | 1.20 (−2.6, 2.6) | 56 % (16) |
| EGFR | 0.54 (0.2, 1.2) | −5.00 (−23.0, 36.0) | 47 % (15) |
| RBC | 0.67 (0.1, 1.7) | 15.10 (−2.6, 34.0) | 62 % (13) |
Table 3 summarizes the univariate association between MV-derived variables and the risk of recurrence or death. Results for the association with the number of vesicles at the end of CRT are not shown as these results were substantially less consistent than was the slope. Compared to an individual at the 25th percentile of the slope for PSlabeled MV, an individual with a slope at the 75th percentile had 4.2 fold (90 % CI 1.7, 10.3) increased risk of recurrence (p = 0.006), and a 3.1 fold (0 % CI 1.0, 9.5) increased risk of death (p = 0.034). Similarly, compared to an individual with a negative slope for PS-labeled MV, an individual with a positive slope had a 6.4 fold (90 % CI 2.0, 20.1) increased risk of recurrence (p = 0.001), and a 3.5 fold (90 % CI 0.9, 14.0) increased risk of death (p = 0.057). For CD41-stained MV (platelet-derived), a positive slope was significant for recurrence (p = 0.028) while the slope itself was significant for death (p = 0.044). For EGFR-stained MV, both slope-based variables were significant for recurrence (p = 0.042, 0.012, respectively). For CD235-stained MV, only slope positivity was significant for recurrence (p = 0.007).
Table 3.
Association of recurrence or death with changes in MV during CRT
| Surface marker (IQR) | RECURRENCE |
DEATH |
||||||
|---|---|---|---|---|---|---|---|---|
| Linear change in marker |
Positive slope |
Linear change in marker |
Positive slope |
|||||
| HR (per IQR)a | p value |
HR (versus negative slope) |
p value |
HR per IQR) | p value |
HR (versus negative slope) |
p value |
|
| PHOSPHOTIDYL SERINE (Annexin) (IQR = 57.5) |
4.20a (1.7,10.3) | 0.005 | 6.39 (2.0, 20.1) | 0.001 | 4.45 (1.6, 12.9) | 0.009 | 4.45 (1.6, 12.6) | 0.009 |
| PLATELETS (CD41) (IQR = 5.20) |
1.31 (0.9, 1.8) | 0.103 | 3.03 (1.1, 8.2) | 0.282 | 1.99 (2.2, 3.4) | 0.044 | 1.99 (1.2, 3.4) | 0.044 |
| EGFR (anti-EGFR) (IQR = 59.0) | 1.57 (1.0, 2.5) | 0.042 | 3.83 (1.3, 11.0) | 0.012 | 1.63 (1.0, 2.7) | 0.057 | 1.62 (1.0, 2.7) | 0.057 |
| RBC (CD41) (IQR = 36.6) | 1.32 (0.8, 2.1) | 0.148 | 5.01 (1.6, 16.1) | 0.007 | 1.59 (0.9, 2.8) | 0.100 | 1.59 (0.9, 2.8) | 0.100 |
Changes are presented as either a linear change over CRT or the presence of a positive versus a negative slope. For the linear change, the HR (90 % CI) is presented per one interquartile range (IQR) i.e. the 75th versus the 25th percentile, as shown in Table 2. p Values are one-sided HR hazard ratio
For PS-labeled MV, the risk of recurrence (death) per IQR is the slope of the linear change in the marker over CRT. For PS-labeled MV, the IQR is 57.5 corresponding to the 75th versus the 25th percentile (Table 2). Thus the estimated risk for an individual at the 75th percentile of linear change (37.5) is 4.2 (3.5) fold more likely to recur (die) compared to an individual at the 25th percentile of linear change (20.0)
As shown in Fig. 4, the median time to recurrence was 112 and 400 days for the patients with a positive and negative slope, respectively. The median OS was 405 days for the patients with a positive slope. The median OS for patients with a negative slope is unknown at this time because six out of eight patients were still alive at the time of analysis.
Fig. 4.
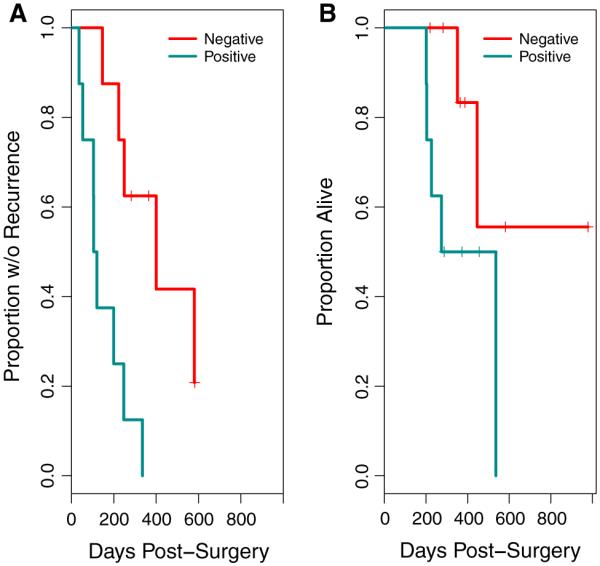
Kaplan–Meier plots of recurrence (a) and overall survival (b) stratified on the basis of whether the rate of increase in MV number was negative or positive. For both recurrence (p = 0.001) and overall survival (p = 0.009), a negative slope was associated with better outcome
In Table 4, we explored whether the previously described clinical predictors of GB outcome (shown in Table 1) were associated with time to recurrence or death. In a Cox model, neutrophil count and N:L ratio at the start of CRT, but not at surgery or at the end of CRT were significant for recurrence and survival. ECOG score and KPS were significant for recurrence (0.004, 0.04 respectively) but only ECOG score was significant for overall survival (p = 0.009). EGFRvIII positivity had no association with recurrence or overall survival.
Based on our findings, we constructed bi-variate models to address the question of whether change in PS-labeled MV were independent predictors of outcome, or alternatively, whether there was confounding with clinical predictors (Table 5). We a priori considered any of the clinical variables with p < 0.15 to be potential confounders of PS-labeled Ann + ve MV variables. Not surprisingly, the HR in the models with the MV variable and the second variable were generally smaller than in the univariate models, suggesting some confounding by the clinical variables. Despite this, for recurrence, both the quantitative and categorical slope variables retained statistical significance in all models except for the quantitative slope when neutrophil count was included as the second variable. For death, the quantitative slope variable showed a similar pattern, with a reduced HR compared to the univariate model, but retention of statistical significance in all bi-variate models except when neutrophil count was included as the second variable (Table 5).
Table 5.
Association of recurrence or death with changes in Annexin stained PS over CRT after adjustment for confounding by one other predictor
| Confounder | RECURRENCE |
DEATH |
||||||
|---|---|---|---|---|---|---|---|---|
| Slope of line for Ann + ve PS during CRT |
Positive slope for Ann + ve PS |
Slope of line for Ann + ve PS during CRT |
Positive slope for Ann + ve PS |
|||||
| HR (90 % CI) | p value | HR | p value | HR (90 % CI) | p value | HR | p value | |
| None | 4.19 (1.7, 10.3) | 0.005 | 6.40 (2.0, 20.1) | 0.001 | 4.45 (1.6, 12.6) | 0.009 | 3.50 (0.9, 14.0) | 0.057 |
| ECOG pre-op | 2.89 (1.1, 7.6) | 0.036 | 4.04 (1.0,16.2) | 0.049 | 3.55 (1.1–11.5) | 0.038 | 1.50 (0.3, 8.3) | 0.347 |
| N:L ratio at start CRT | 3.34 (1.2, 9.5) | 0.029 | 4.88 (1.4, 17.5) | 0.021 | 5.06 (1.14, 22.4) | 0.037 | 1.92 (0.3, 11.5) | 0.274 |
| Neutrophil count at start CRT | 1.23 (1.0, 1.6) | 0.082 | 4.33 (1.3, 14.5) | 0.023 | 1.45 (1.0, 2.1) | 0.056 | 1.88 (0.4, 9.4) | 0.259 |
| Pre-op KPS | 3.51 (1.3, 9.2) | 0.016 | 5.43 (1.6, 18.3) | 0.011 | 4.24 (1.4, 13.2) | 0.018 | 2.88 (0.6,13.3) | 0.128 |
| EGFRvIII | 4.13 (1.4, 12.4) | 0.017 | 6.89 (1.9, 24.9) | 0.007 | 5.9 (1.1, 32.1) | 0.041 | 2.42 (0.5, 1.0) | 0.167 |
Each row represents four models with each adjusted for the confounder. For comparison, the first row shows the results from the univariate model in Table 3. Changes are presented as either a linear change over CRT or the presence of a positive versus a negative slope. As in Table 3, for the linear change, the HR (90 % CI) is presented per one interquartile range (IQR) i.e. the 75th versus the 25th percentile, as shown in Table 2. p Values are one-sided and are only shown for the MV variable
Potential confounders were included here if they achieved an a priori significance level of p < 0.15 in individual models (Table 4)
Discussion
Our findings provide initial evidence that increases in Ann + ve MV levels during CRT are associated with earlier recurrence and overall survival in newly diagnosed GB patients. The effect is dramatic, with over a four-fold increase in the HR for an individual at the 75th versus the 25th percentile. Moreover, the pattern of AnnV + ve MV remains significant after adjustment for confounding by a number of clinical variables that have previously been shown to be prognostic for recurrence and survival (Table 5). Interestingly, including neutrophil counts at the start of CRT in the model yielded the largest attenuation of the observed association. Further studies will be needed to verify and further investigate the association between these two entities.
This report joins a small number of published articles regarding ECV as biomarkers in cancer patients. In contrast to this work, which emphasizes the number and presence of MV, previously published studies have emphasized the prognostic significance of the ECV cargo, including miRNA [22, 23], specific proteins [24, 25] or oncogenes [26]. In 2008, Skog et al. [27] showed that miRNA mutant/variants and RNA that are characteristic of gliomas could be detected in MV from GB patient’s serum; EGFRvIII was detected in MV from 7 out of 25 patients. The authors concluded that GB MV might provide diagnostic and therapeutic guidance for cancer patients via a blood test. More recent work by Shao et al. [28] validated a microfluidic device to label MV with antibody-bound magnetic nanoparticles for detection using an integrated microcoil. They reported that combinations of monoclonal antibodies could distinguish between samples from GB patients and those from healthy individuals with 90 % accuracy. Our group studied a small group of newly diagnosed GB patients and showed that the number of AnnV + MV could be used to differentiate pseudoprogression (treatment effect) from true progression in the setting of an equivocal MRI study [15].
Our sample of patients, while small, has similar demographics to those of other larger published series. We compared our data with the analysis of “Cohort II” from a retrospective analysis of therapy response performed by Nava et al. [29]. Cohort II was composed of 746 patients with histologically confirmed primary GB who were diagnosed and treated with the Stupp protocol [1] as a firstline treatment, and new standard protocols for second-line chemotherapy and radiosurgery after tumor recurrence. These are the same guidelines used for the patients reported herein. In Nava’s paper, the median times to recurrence and OS were 271 days and 393 days respectively; we report median times to recurrence and OS as 215 and 385 days, respectively. As in previous analyses [16], we found that performance status was associated with outcome. We also found that the N:L ratio and the neutrophil count at the start of CRT were significant outcome predictors. Previous studies support the observation that neutrophils modulate the biology of GB. Donskov summarizes that “the prognostic role of tumor-infiltrating neutrophils, elevated blood neutrophils and elevated blood neutrophil/lymphocyte ratio has been associated with poor clinical outcome in several human cancers, most notably in renal cell carcinoma, melanoma, colorectal cancer, hepatocellular carcinoma, cholangiocarcinoma, GB, GIST, gastric, esophageal, lung, ovarian and head and neck cancer.” In work by Shao et al., high baseline neutrophil counts in tumor and/or blood were identified as a strong, independent risk factor for poor outcome in multivariate analyses, and the negative prognostic impact of neutrophils was not eliminated by increasing the dose of cytokines, chemotherapy, or targeted therapy [27]. In another report, studies indicated that pretreatment N:L ratio is of prognostic significance, independent of MGMT status [28]. Our findings, summarized in Table 4, provides further support for these conclusions.
Our data show that the median time to recurrence and overall survival recapitulates historical data and it may be possible to designate GB patients as having “good” versus “poor” prognosis based on MV analyses. The Ann + ve MV we studied in this proof of principle study were associated with recurrence using temporal changes over time. We also found that overall survival can be predicted using our MV biomarker, but caution that our study is limited by the small number of patients and the small number of deaths. Given the small sample size, we were able to conduct only limited studies to determine whether the MV marker was an independent predictor of outcome. These models suggested that confounding by previously identified clinical predictors could not explain away the association between the MV biomarker and outcome. Further work with larger samples is needed to validate these findings and to determine whether a MV biomarker is an independent predictor of outcome in models with multiple clinical variables.
In summary, we have studied the number and surface markers of MV isolated from blood taken from newly diagnosed GB patients at simulation, twice during and at the end of chemoradiation therapy. The slope and the trend (increasing vs. decreasing over time) in the number of Ann + ve MV are prognostic of both recurrence and survival; increasing number of MV portend a poorer prognosis. The data regarding the number of MV with various surface markers, EGFR, CD41 (platelets) and CD235 (red blood cells) are statistically significant for specific models and outcomes and therefore require additional study.
In a recent review of work by Shao et al. [28], DJ Burgess noted that “it will be interesting to determine the extent to which MV analyses might supplement more traditional methods for clinical diagnosis and monitoring, and whether such technology can be applied to other tumor types.” Our data potentially provides an important opportunity for improving trial design for new adjuvant therapies to be given concurrent with CRT in patients with GB. GB patients with predicted poor versus good outcome based on MV indicators could be compared for response to an experimental therapy. Patients with a poor prognosis based on an increase in MV that go on to have a similar outcome to patients with decreasing MV would improve the statistical analysis of the data. Clearly, identifying the mechanism of the association of MV number with outcome is extremely important in the selection of new drugs or other treatments to test in this setting. These studies are ongoing in our labs.
Supplementary Material
Acknowledgments
We would like to thank all of the patients for their time and dedication to this research, Dana Patch for her excellent work with the patients, and the reviewers who offered a number of excellent comments that improved the original manuscript. Tobacco Grant (Evans) 2013 Health Research Formula Fund 4100062223; Berwind Fund (Lustig); NIH Funded ACC Core Support Grant/Chi Van Dang # P30-CA016520.
Footnotes
Electronic supplementary material The online version of this article (doi:10.1007/s11060-015-2051-3) contains supplementary material, which is available to authorized users.
Annexin V is a marker of phosphatidylserine (PS), which is found on the outside surface of MVs.
References
- 1.Stupp R, Hegi ME, Mason WP, van den Bent MJ, Taphoorn MJ, Janzer RC, Ludwin SK, Allgeier A, Fisher B, Belanger K, Hau P, Brandes AA, Gijtenbeek J, Marosi C, Vecht CJ, Mokhtari K, Wesseling P, Villa S, Eisenhauer E, Gorlia T, Weller M, Lacombe D, Cairncross JG, Mirimanoff RO, European R, Organisation for, T. Treatment of Cancer Brain, G. Radiation Oncology, G. National Cancer Institute of Canada Clinical Trials Effects of radiotherapy with concomitant and adjuvant temozolomide versus radiotherapy alone on survival in glioblastoma in a randomised phase III study: 5-year analysis of the EORTC-NCIC trial. Lancet Oncol. 2009;10:459–466. doi: 10.1016/S1470-2045(09)70025-7. [DOI] [PubMed] [Google Scholar]
- 2.Wong ET, Lok E, Swanson KD, Gautam S, Engelhard HH, Lieberman F, Taillibert S, Ram Z, Villano JL. Response assessment of NovoTTF-100A versus best physician’s choice chemotherapy in recurrent glioblastoma. Cancer Med. 2014;3:592–602. doi: 10.1002/cam4.210. [DOI] [PMC free article] [PubMed] [Google Scholar]
- 3.2014. EF-14 Independent Data Monotoring Committee, Novocure announces the EF-14 phase III clinical trial of tumor treating fields in patients with newly diagnosed glioblastoma has been terminated at the interim analysis due to early success, The EF-14 trial Independent Data Monitoring Committee recommended terminating the trial early and allowing all control patients to receive Tumor Treating FieldsT.
- 4.Bachelor TT, Reardon DA, de Groot JF, Wick W, Weller M. Antiangiogenic therapy for glioblastoma: current status and future prospects. Clin Cancer Res. 2014;20:5612–5619. doi: 10.1158/1078-0432.CCR-14-0834. [DOI] [PMC free article] [PubMed] [Google Scholar]
- 5.Padfield E, Ellis HP, Kurian KM. Current therapeutic advances targeting EGFR and EGFRvIII in glioblastoma. Front Oncol. 2015;5:5. doi: 10.3389/fonc.2015.00005. [DOI] [PMC free article] [PubMed] [Google Scholar]
- 6.Riccione K, Suryadevara CM, Snyder D, Cui X, Sampson JH, Sanchez-Perez L. Generation of CAR T cells for adoptive therapy in the context of glioblastoma standard of care. J Vis Exp. 2015;16(96):e52397–e52397. doi: 10.3791/52397. [DOI] [PMC free article] [PubMed] [Google Scholar]
- 7.Biomarkers Definitions Working Group Biomarkers and surrogate endpoints: preferred definitions and conceptual frame-work. Clin Pharmacol Ther. 2001;69:89–95. doi: 10.1067/mcp.2001.113989. [DOI] [PubMed] [Google Scholar]
- 8.Oosthuyzen W, Sime NE, Ivy JR, Turtle EJ, Street JM, Pound J, Bath LE, Webb DJ, Gregory CD, Bailey MA, Dear JW. Quantification of human urinary exosomes by nanoparticle tracking analysis. J Physiol. 2013;591:5833–5842. doi: 10.1113/jphysiol.2013.264069. [DOI] [PMC free article] [PubMed] [Google Scholar]
- 9.Thery C, Duban L, Segura E, Veron P, Lantz O, Amigorena S. Indirect activation of naive CD4+T cells by dendritic cell-derived exosomes. Nat Immunol. 2002;3:1156–1162. doi: 10.1038/ni854. [DOI] [PubMed] [Google Scholar]
- 10.Valadi H, Ekstrom K, Bossios A, Sjostrand M, Lee JJ, Lotvall JO. Exosome-mediated transfer of mRNAs and microRNAs is a novel mechanism of genetic exchange between cells. Nat Cell Biol. 2007;9:654–659. doi: 10.1038/ncb1596. [DOI] [PubMed] [Google Scholar]
- 11.Mathivanan S, Ji H, Simpson RJ. Exosomes: extracellular organelles important in intercellular communication. J Proteomics. 2010;73:1907–1920. doi: 10.1016/j.jprot.2010.06.006. [DOI] [PubMed] [Google Scholar]
- 12.Thery C, Boussac M, Veron P, Ricciardi-Castagnoli P, Raposo G, Garin J, Amigorena S. Proteomic analysis of dendritic cell-derived exosomes: a secreted subcellular compartment distinct from apoptotic vesicles. J Immunol. 2001;166:7309–7318. doi: 10.4049/jimmunol.166.12.7309. [DOI] [PubMed] [Google Scholar]
- 13.Shantikumar S, Angelini GD, Emanueli C. Diabetes, microRNAs and exosomes: Les liaisons dangereuses. J Mol Cell Cardiol. 2014;74:196–198. doi: 10.1016/j.yjmcc.2014.05.014. [DOI] [PubMed] [Google Scholar]
- 14.Spinetti G, Fortunato O, Caporali A, Shantikumar S, Marchetti M, Meloni M, Descamps B, Floris I, Sangalli E, Vono R, Faglia E, Specchia C, Pintus G, Madeddu P, Emanueli C. MicroRNA-15a and microRNA-16 impair human circulating proangiogenic cell functions and are increased in the proangiogenic cells and serum of patients with critical limb ischemia. Circ Res. 2013;112:335–346. doi: 10.1161/CIRCRESAHA.111.300418. [DOI] [PMC free article] [PubMed] [Google Scholar]
- 15.Koch CJ, Lustig RA, Yang XY, Jenkins WT, Wolf RL, Martinez-Lage M, Desai A, Williams D, Evans SM. Microvesicles as a biomarker for tumor progression versus treatment effect in radiation/temozolomide-treated glioblastoma patients. Transl Oncol. 2014;7:752–758. doi: 10.1016/j.tranon.2014.10.004. [DOI] [PMC free article] [PubMed] [Google Scholar]
- 16.Li J, Wang M, Won M, Shaw EG, Coughlin C, Curran WJ, Jr, Mehta MP. Validation and simplification of the Radiation Therapy Oncology Group recursive partitioning analysis classification for glioblastoma. Int J Radiat Oncol Biol Phys. 2011;81:623–630. doi: 10.1016/j.ijrobp.2010.06.012. [DOI] [PMC free article] [PubMed] [Google Scholar]
- 17.Arscott WT, Camphausen KA. EGFR isoforms in exosomes as a novel method for biomarker discovery in pancreatic cancer. Biomark Med. 2011;5:821. doi: 10.2217/bmm.11.80. [DOI] [PubMed] [Google Scholar]
- 18.Vinuela-Berni V, Doniz-Padilla L, Figueroa-Vega N, Portillo-Salazar H, Abud-Mendoza C, Baranda L, Gonzalez-Amaro R. Proportions of several types of plasma and urine microparticles are increased in patients with rheumatoid arthritis with active disease. Clin Exp Immunol. 2015;180:442–451. doi: 10.1111/cei.12598. [DOI] [PMC free article] [PubMed] [Google Scholar]
- 19.Danesh A, Inglis HC, Jackman RP, Wu S, Deng X, Muench MO, Heitman JW, Norris PJ. Exosomes from red blood cell units bind to monocytes and induce proinflammatory cytokines, boosting T-cell responses in vitro. Blood. 2014;123:687–696. doi: 10.1182/blood-2013-10-530469. [DOI] [PMC free article] [PubMed] [Google Scholar]
- 20.Han S, Liu Y, Li Q, Li Z, Hou H, Wu A. Pre-treatment neutrophil-to-lymphocyte ratio is associated with neutrophil and T-cell infiltration and predicts clinical outcome in patients with glioblastoma. BMC Cancer. 2015;15:617. doi: 10.1186/s12885-015-1629-7. [DOI] [PMC free article] [PubMed] [Google Scholar]
- 21.Liang J, Piao Y, Holmes L, Fuller GN, Henry V, Tiao N, de Groot JF. Neutrophils promote the malignant glioma phenotype through S100A4. Clin Cancer Res. 2014;20:187–198. doi: 10.1158/1078-0432.CCR-13-1279. [DOI] [PMC free article] [PubMed] [Google Scholar]
- 22.Silva J, Garcia V, Zaballos A, Provencio M, Lombardia L, Almonacid L, Garcia JM, Dominguez G, Pena C, Diaz R, Herrera M, Varela A, Bonilla F. Vesicle-related microRNAs in plasma of nonsmall cell lung cancer patients and correlation with survival. Eur Respir J. 2011;37:617–623. doi: 10.1183/09031936.00029610. [DOI] [PubMed] [Google Scholar]
- 23.Selth LA, Townley SL, Bert AG, Stricker PD, Sutherland PD, Horvath LG, Goodall GJ, Butler LM, Tilley WD. Circulating microRNAs predict biochemical recurrence in prostate cancer patients. Br J Cancer. 2013;109:641–650. doi: 10.1038/bjc.2013.369. [DOI] [PMC free article] [PubMed] [Google Scholar]
- 24.Bergmann C, Strauss L, Wieckowski E, Czystowska M, Albers A, Wang Y, Zeidler R, Lang S, Whiteside TL. Tumor-derived microvesicles in sera of patients with head and neck cancer and their role in tumor progression. Head Neck. 2009;31:371–380. doi: 10.1002/hed.20968. [DOI] [PMC free article] [PubMed] [Google Scholar]
- 25.Peinado H, Aleckovic M, Lavotshkin S, Matei I, Costa-Silva B, Moreno-Bueno G, Hergueta-Redondo M, Williams C, Garcia-Santos G, Ghajar C, Nitadori-Hoshino A, Hoffman C, Badal K, Garcia BA, Callahan MK, Yuan J, Martins VR, Skog J, Kaplan RN, Brady MS, Wolchok JD, Chapman PB, Kang Y, Bromberg J, Lyden D. Melanoma exosomes educate bone marrow progenitor cells toward a pro-metastatic phenotype through MET. Nat Med. 2012;18:883–891. doi: 10.1038/nm.2753. [DOI] [PMC free article] [PubMed] [Google Scholar]
- 26.Baran J, Baj-Krzyworzeka M, Weglarczyk K, Szatanek R, Zembala M, Barbasz J, Czupryna A, Szczepanik A, Zembala M. Circulating tumour-derived microvesicles in plasma of gastric cancer patients. Cancer Immunol Immunother. 2010;59:841–850. doi: 10.1007/s00262-009-0808-2. [DOI] [PMC free article] [PubMed] [Google Scholar]
- 27.Skog J, Wurdinger T, van Rijn S, Meijer DH, Gainche L, Sena-Esteves M, Curry WT Jr, Carter BS, Krichevsky AM, Breakefield XO. Glioblastoma microvesicles transport RNA and proteins that promote tumour growth and provide diagnostic biomarkers. Nat Cell Biol. 2008;10:1470–1476. doi: 10.1038/ncb1800. [DOI] [PMC free article] [PubMed] [Google Scholar]
- 28.Shao H, Chung J, Balaj L, Charest A, Bigner DD, Carter BS, Hochberg FH, Breakefield XO, Weissleder R, Lee H. Protein typing of circulating microvesicles allows real-time monitoring of glioblastoma therapy. Nat Med. 2012;18:1835–1840. doi: 10.1038/nm.2994. [DOI] [PMC free article] [PubMed] [Google Scholar]
- 29.Nava F, Tramacere I, Fittipaldo A, Bruzzone MG, Dimeco F, Fariselli L, Finocchiaro G, Pollo B, Salmaggi A, Silvani A, Farinotti M, Filippini G. Survival effect of first- and second-line treatments for patients with primary glioblastoma: a cohort study from a prospective registry, 1997–2010. Neuro Oncol. 2014;16:719–727. doi: 10.1093/neuonc/not316. [DOI] [PMC free article] [PubMed] [Google Scholar]
Associated Data
This section collects any data citations, data availability statements, or supplementary materials included in this article.