

Abstract
Recent studies have found that microtubule-associated proteins (MAPs) can regulate the dynamical properties of microtubules in unexpected ways. For most MAPs, there is an inverse relationship between their effects on the speed of growth and the frequency of catastrophe, the conversion of a growing microtubule to a shrinking one. Such a negative correlation is predicted by the standard GTP-cap model, which posits that catastrophe is due to loss of a stabilizing cap of GTP-tubulin at the end of a growing microtubule. However, many other MAPs, notably Kinesin-4 and combinations of EB1 with XMAP215, contradict this general rule. In this review, we show that a more nuanced, but still simple, GTP-cap model, can account for the diverse regulatory activities of MAPs.
Keywords: microtubule, catastrophe, cytoskeleton, microtubule-associated proteins
Microtubules are dynamic polymers
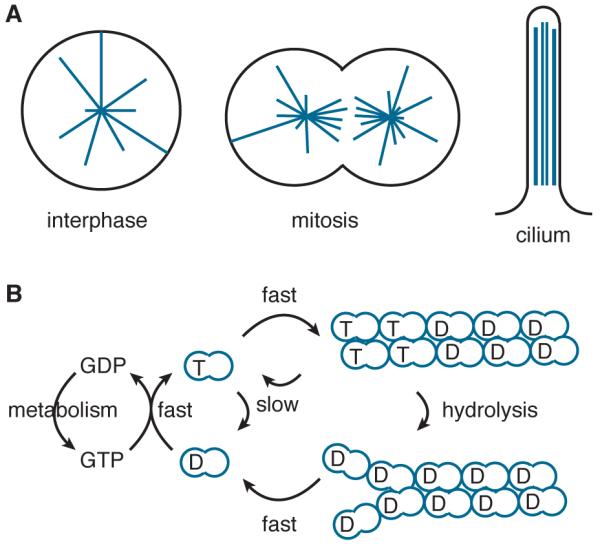
Microtubules are cytoskeletal polymers that play essential roles in cytoplasmic transport, as the tracks along which motor proteins move intracellular cargoes, in cell division, by forming the mitotic spindle, and in cell motility, by constituting the structural core of cilia and flagella (Figure 1A). Pathologies in microtubule structure and regulation are associated with mitotic and neurodegenerative disorders [1–3].
Figure 1. Microtubules in cells and their GTP-hydrolysis cycle.

A Microtubules (in blue) are dynamic polymers that form a radial cytoskeleton (left), a bipolar mitotic spindle (center) and the linear axoneme of cilia (right).
B Tubulin is a GTPase. The predominant tubulin species in solution has GTP bound to the β-subunit. Hydrolysis of GTP by the dimer in solution is slow. Hydrolysis is accelerated by incorporation of the GTP-dimer into the microtubule lattice. To enter the lattice, the GTP-dimer first associates transiently with the end before becoming strongly bound; the dissociation of the strongly bound GTP-dimer is slow and its hydrolysis occurs with a delay, resulting in a cap of GTP-tubulin at the end. The cap stabilizes the microtubule against depolymerization. If the cap is lost and GDP-tubulin is exposed at the end, depolymerization is rapid, thereby completing the hydrolysis cycle. Microtubule-associated proteins (MAPs) up- and down-regulate all steps in this pathway, thereby allowing cells exquisite control of their microtubule cytoskeleton.
Microtubules are cylindrical polymers composed of α – β-heterodimers, which are typically arranged into 13 protofilaments and which nucleate from microtubule organizing centers [4]. The polarity of the tubulin heterodimers induces a polarity to the microtubule. The end that exposes the α-tubulin is referred to as the minus end because it grows more slowly. In cells, the minus end is typically associated with the microtubule organizing center or Golgi apparatus and is less dynamic than the plus end, though recent work suggests that, like the plus end, the minus end is also tightly regulated [5–8]. The faster-growing plus end exposes the β-tubulin, which binds the exchangeable nucleotide, GTP or GDP (Figure 1B). In cells, the plus end typically grows out from the nucleation center towards the chromosomes in mitosis or towards the cell cortex in interphase cells [9]. If a microtubule end finds a target, such as the kinetochore of chromosomes [10,11] or plus-end binding proteins on the Golgi and ER [12–14] or plasma membrane [15–18], it will be temporarily immobilized to generate pushing or pulling forces [19]. If it fails to find a target, the microtubule will rapidly depolymerize [20]. This switch from a period of comparatively slow growth to one of rapid shrinkage is called catastrophe and is a key feature of dynamic instability, which was discovered by Mitchison and Kirschner [21].
How does microtubule catastrophe arise? The widely-accepted, text-book explanation is that catastrophe occurs once a stabilizing cap of GTP-tubulin disappears from the microtubule’s plus end [22], a process that occurs stochastically [21,23–25]. Because GTP-tubulin is the predominant species in solution, the end subunits initially have GTP bound to them (Figure 1B); some time later, when the subunit is in the lattice, the GTP is hydrolyzed [26]. The length of the GTP-capped region depends on the molecular rate constants: the binding and unbinding of GTP-tubulin and the hydrolysis rate. The length is expected to fluctuate due to the stochasticity associated with the molecular processes [27–30]. According to this model, which we call the standard GTP-cap model, increasing cap size by increasing the growth speed [31] or decreasing cap size by increasing the rate of depolymerization of the cap [29] will respectively decrease or increase the catastrophe frequency. Note that the standard GTP-cap model is a conceptual, as opposed to mathematical, model and so makes qualitative rather than quantitative predictions.
Over the last few years, it has been found that in the presence of many microtubule-associated proteins (MAPs), this inverse correlation between growth and catastrophe frequency breaks down (see next section). Therefore, the standard GTP-cap model needs to be reevaluated. Concurrent with this new work on MAPs, theoretical work has led to analytic and computational solutions to a large number of different GTP-cap models. Now is a good time to ask whether these new models can account for the unexpected regulatory properties of MAPs.
Regulation of dynamics by MAPs
MAPs regulate microtubule dynamics in many ways [32–34]: for example by altering the speeds of microtubule growth and shrinkage, or by altering the frequency of catastrophe or rescue (the conversion of a microtubule from the shrinking state to the growing state) [31]. In addition, MAPS can influence nucleation [35], induce severing [36] or catalyze post-translational modification [37]. In this review, we focus on the effects of MAPs on growth and catastrophe (Table 1) as these processes are the main controllers of microtubule length. Indeed, in the absence of rescue or severing, the average, steady-state length of a microtubule is approximately equal to the growth speed divided by the catastrophe frequency [38,39].
Table 1.
The effects of MAPs on microtubule growth and catastrophe.
| Protein | In vitro effects on microtubule dynamics | References |
|---|---|---|
| Tubulin | Increases vg Decreases fcat |
[29,40] |
| Tau | Increases vg up to 3-fold* decreases fcat > 50 fold *N.B. 4-repeat Tau isoform increased vg 1.2 fold 3-repeat Tau isoform decreased vg 1.2 fold |
[43,44,94] |
| XMAP215 | Increases vg up to 10 fold No effect on fcat Increases shrinkage rate up to 10 fold |
[58,59,85,95] |
| Stu2 | Increases vg up to 5-fold Decreases fcat 2.3 fold |
[45,96] |
| EB1 | Increases vg up to 2 fold Increases fcat up to 30 fold Increases h |
[59,62,86,87,91,97] |
| Op18/stathmin | Decreases vg 1.7 fold Increases fcat up to 10 fold |
[49,98] |
| Clasp | Increases vg up to 2 fold Decreases fcat up to 6 fold Increases rescue frequency |
[41,99] |
| Kip2 | Increases vg up to 3-fold Decreases fcat 20 fold |
[100,Hibbel, unpublished] |
| DCX | No effect on vg Decreases fcat |
[92,101,102] |
|
Kinesin-8
Kip3 Kif18A |
No effect on vg Increases fcat |
[52–54,103,104] but see [55] |
| Kinesin-4 | Decreases kon 2 fold Decreases koff 3 fold |
[60,61] |
| Kinesin-13 | No effect on vg Increases fcat |
[29,56,84] |
| Dynactin | Increases vg > 2-fold Decreases fcat 4-fold |
[46,47] |
The standard cap model can account for the activities of several MAPs (Figure 2, green). For example, tubulin is a MAP; increasing the concentration of tubulin increases the growth speed (vg) and decreases the catastrophe frequency (fcat) [29,40]. Similar correlations are seen for other MAPs (unless otherwise noted, similar effects are seen in cells and in assays with purified proteins). For example, the microtubule stabilizer Clasp increases vg and decreases fcat [41]. The neuronal microtubule stabilizer Tau also increases vg and decreases fcat [42–44]. The same holds true for Stu2, the budding yeast homolog of XMAP215 [45], and the budding yeast kinesin Kip2 (Hibbel, unpublished) and dynactin [46,47]. Conversely, the tubulin-sequestering protein Op18/Stathmin decreases vg and increases fcat [48,49]. Thus, the effects of all these MAPs on microtubule dynamics are well explained by the standard GTP-cap model.
Figure 2. Regulation of microtubule growth and catastrophe by MAPs.

Dynamic microtubules primarily exist in two distinct states: slowly growing and rapidly shrinking. Catastrophe is the transition from growth to shrinkage. In this Figure, we schematize the effects of a plethora of MAPs on the growth speed (vg) and catastrophe frequency (fcat). On the top right are those that increase the microtubule growth rate vg, on the bottom right those that decrease vg, on the bottom left those that increase catastrophe frequency fcat and on the top left those that decrease fcat. The MAPs in green accord with the standard GTP-cap model because they either (a) increase vg and decrease fcat or (b) decrease vg and increase fcat. The MAPs in red (e.g. EB1 + XMAP215, Kinesin-4) contradict the model as they either increase both fcat and vg or they decrease them both. MAPs in orange affect either vg or fcat and not the other.
However, the standard cap model cannot account for the effects of several other MAPs. A number of MAPs affect growth without affecting catastrophe (or vice versa) (Figure 2, yellow). For example, DCX stabilizes microtubules by decreasing fcat, but it does not affect vg [47,50,51]. Furthermore, Kinesin-8s (Kip3, Kif18A, Kif18B), as well as Kinesin-13 (MCAK) increase fcat with little effect on vg [29,52–57]. Conversely, the microtubule polymerase XMAP215 increases vg [58], but at the same time does not affect fcat [58,59]. Thus, in the presence of these MAPs, the negative correlation between growth and catastrophe breaks down.
In addition, there are examples of MAPs that completely violate the negative correlation between growth and catastrophe (Figure 2, red). Notably, Kinesin-4 (Xklp1) decreases both vg and fcat [60,61]. Conversely, EB1 increases both vg and fcat ([59,62] but see [63]). Strikingly, combinations of MAPs can lead to synergistic effects: the combination of XMAP215 with EB1 strongly increases both vg and fcat [59]. Thus, some MAPs disregard the principle of negative correlation between growth and catastrophe entirely and cannot be accounted for by the standard GTP-cap model.
In summary, the basic rule that faster growing microtubules experience less frequent catastrophe is too simple to explain the wide variety of behaviors of MAPs. Therefore, the standard GTP-cap model needs to be modified to account for the richness of the behavior of MAPs. To do this, more detailed models for subunit binding and unbinding, together with hydrolysis, need to be considered. However, this raises a problem: the models need to be formulated mathematically using equations and these equations must be solved to yield predictions. This is not trivial.
Models of catastrophe
The mathematical models of catastrophe that concern us here predict the speed of growth and the frequency of catastrophe in terms of the molecular rate constants. These include the rates at which the dimers associate with and dissociate from the ends, and the rate of GTP hydrolysis. There are also empirical models such as [39] and, more recently, [64] that do not consider the kinetic description that is essential to our discussion here. Even for the apparently simple case of a single protofilament, solving these models is difficult and requires sophisticated mathematical techniques. Recently two important cases, the vectorial and random hydrolysis models, were solved analytically, meaning that mathematical expressions could be derived that give the growth speed and catastrophe frequency in terms of the molecular rate constants [65–69] (see Box 1 for further details). The expressions can then be readily compared to experimental data.
BOX 1. Models of microtubule growth and catastrophe.
To build a mathematical model of microtubule growth and catastrophe, many GTP hydrolysis mechanisms have been proposed in the literature, the most prevalent being vectorial, random and coupled.
In vectorial hydrolysis, there is a hydrolysis front (Figure 3A) dividing the GTP cap from the rest of the microtubule lattice, which consists of GDP-associated tubulin. The model predicts that, for any given hydrolysis rate constant h, there is only a very small range of tubulin concentrations over which microtubule dynamics can occur [68]: once the tubulin concentration ([Tb]) is increased above this small range, the growth velocity vg, which varies linearly with [Tb], outpaces the velocity of the hydrolysis front. Only very rarely does the hydrolysis front catch up and thus most microtubules will grow ad infinitum; below this range, the velocity of the hydrolysis front will be larger than vg and almost all microtubules will catastrophe immediately upon polymerization. Experimentally, we know that microtubule dynamics occur over a large range of tubulin concentrations and these observations rule out the mechanism of vectorial hydrolysis in microtubule dynamics (Figure I) [65,66].
In random hydrolysis, each tubulin dimer has an equal probability of being hydrolyzed at any point in time, a probability that is constant over time (formally, hydrolysis is a Poisson process). Thus, the longer a tubulin dimer has been incorporated in the lattice and the deeper it is embedded, the more likely it is to be GDP-associated. Although random hydrolysis allows microtubule dynamics to occur over a larger range of tubulin concentrations than vectorial hydrolysis, it predicts a significantly non-linear dependence of microtubule lifetime on [Tb], also in contradiction to experimental evidence.
The third commonly proposed hydrolysis mechanism is coupled hydrolysis, in which a GTP-tubulin dimer is hydrolyzed only once another dimer has associated on top of it; there is also structural evidence suggesting that polymerization directly promotes hydrolysis [79]. In coupled hydrolysis, microtubule lifetime is independent of [Tb], also contradicting experimental results (for an in-depth critique of such models and more, see [68]).
Thus, none of these three mechanisms work, at least on their own. However, if the random (but not vectorial) and coupled mechanisms are combined, then there is good agreement with the experimental data. In this coupled-random model, a GTP-associated tubulin dimer is able to be hydrolyzed (according to the random hydrolysis mechanism) provided it has been “covered” by another dimer. To completely describe the model we now need to define catastrophe: in this model, a catastrophe occurs once GDP-tubulin dimers have been exposed at the tips of n protofilaments. Note that because a terminal GTP subunit cannot be hydrolyzed (by the coupled assumption), it must dissociate to leave a GDP-tubulin exposed. Provided that koff ⪡ kon[Tb], this model results in fcat being related to [Tb] according to
| (1) |
kon is the tubulin dimer association rate constant (per protofilament end), koff the dissociation rate constant of strongly bound GTP-tubulin (per protofilament) and h is the hydrolysis rate constant. This equation is a slight generalization of that in [68], which considered that the number of steps required for catastrophe was n = 3. Equation 1 is in accordance with our intuitive understanding of microtubule dynamics: (i) increasing koff increases fcat by accelerating the exposure of GDP-tubulin at a protofilament end; (ii) increasing kon decreases fcat by keeping the end covered with a GTP-tubulin; and (iii) increasing the hydrolysis rate h leads to an increase in fcat (provided h < kon) by increasing the chance that the penultimate tubulin dimer is in the GDP-bound state. The model also provides a mathematical description of vg:
| (2) |
as the difference in the association and dissociation rates times the incrememental length increase when a dimer is added to the end of a protofilament (d = 8 nm is the length of a tubulin dimer).
Box Figure I. Models of microtubule growth and catastrophe.
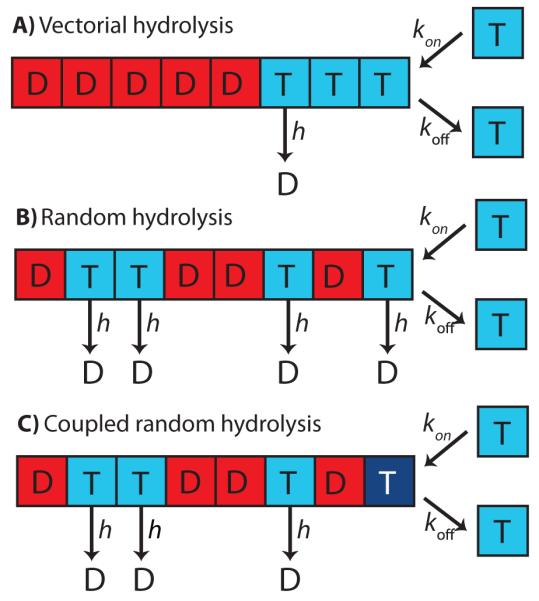
A, B and C are schematics of vectorial, random and coupled-random hydrolysis mechanisms respectively, visualized in the single protofilament case for simplicity. In all cases, GTP-tubulin tubulin dimers (T) associate stably with the microtubule end with rate constant kon per protofilament. koff is the rate at which the strongly bound GTP-dimers dissociate from the protofilaments end. In A, hydrolysis (conversion to GDP-tubulin, visualized as D) occurs with rate constant h and can only occur at the GDP-GTP interface: this implies that there is a hydrolysis front. In B, random hydrolysis occurs with rate constant h for any tubulin dimer in the tubulin lattice. In C, coupled-random hydrolysis occurs with rate constant h for any tubulin dimer in the tubulin lattice except for the dimer at the tip (and thus hydrolysis is coupled to microtubule growth). For more details, see [68], from which the Figure was redrawn.
In addition to these analytic models, there are computational models in which growth speed and catastrophe frequency are deduced from simulations [30,70–75]. These models often take into account the complex 3-D arrangement of subunits in the microtubule lattice, with the dissociation and hydrolysis rates depending on the whether the neighboring subunits (of which there are up to six) have GTP or GDP bound to them.
A key experimental observation needed to test models of catastrophe is that microtubules undergo catastrophe over a range of tubulin concentrations [24,29]. In the single protofilament case, neither the vectorial nor the random hydrolysis models can account for this behavior [68]. Thus they can be ruled out. Mixed vectorial/random models can account for the dependence of catastrophe on tubulin concentration [76,77]. However, they cannot account for a second key experimental observation: namely that catastrophe is not a random, single-step process but rather is rather a multi-step process whose rate depends on how long a microtubule has been growing [29,78]. Thus, vectorial and random hydrolysis mechanisms alone cannot account for catastrophe: these examples illustrate the power of theory to disprove hypotheses.
To account for the tubulin-dependence of catastrophe, it was proposed that hydrolysis is tightly coupled to subunit addition at the end [25]. Support for this idea came from structural studies showing that the GTP-hydrolyzing cleft in the β-subunit is completed only after docking to the α-subunit [79]. Combining this idea with random (but not vectorial) hydrolysis has led to coupled-random models [71,74,80–82]. Formulations of the coupled-random model range in complexity, from single protofilament and analytically soluble models [81] to multiple protofilament, computationally expensive models that incorporate bond energetics to determine kinetic rates [80] and that consider rapid, reversible binding of GTP-dimers to the end, leading to highly labile cap structures [30,70]. The complexity of these computational models, however, reflected in the larger number of free parameters, means that they have only been solved on a case-by-case basis, without a general formula that links growth and catastrophe to the molecular rate constants. As a result, it is difficult to interpret the effects of MAPs using these computational models. An important future goal will be to incorporate regulation of dynamics by the large number of MAPs into these computational models.
A recent formulation of the coupled-random model [68] that can account for the dynamics of tubulin alone as well as the multistep nature of catastrophe [29] is complex enough to include multiple protofilaments yet simple enough to be analytically soluble. This model, described in more detail in Box 1 provides simple expressions for the growth speed and catastrophe frequency as a function of the molecular parameters: kon, the association rate constant per protofilment with which GTP-tubulin dimers incorporate stably into the microtubule lattice; koff, the dissociation rate constant at which GTP-tubulin dimers dissociate from protofilament ends; and h, the hydrolysis rate constant (see Equations 1 and 2 in Box 1). We will use these equations to interpret the effects of MAPs.
The coupled-random model accounts for the observed effects of MAPs
The coupled-random model generalizes the standard GTP cap model in the sense that the observations that accord with the standard model also accord with the new model. This is because if the hydrolysis rate (h) and the GTP-tubulin off rate (koff) are held constant, then increasing the rate at which tubulin is incorporated into the lattice (kon[Tb]), where [Tb] is the GTP-tubulin concentration in solution, increases the growth speed (Equation 2) and decreases the catastrophe frequency (Equation 1). Thus, the coupled-random model accounts for those MAPs (including tubulin, Tau, Stu2 and Kip2) which increase kon[Tb], thereby increasing the growth speed and decreasing the catastrophe frequency. The model suggests that Clasp and dynactin also increases kon[Tb]. Likewise, the coupled-random model accords with MAPs that decrease the growth speed and increase the catastrophe frequency; these include, for example, Op18/Stathmin. Thus, the new model is an extension of the old one.
The power of the new model is that it accounts for the behaviors of MAPs that are inconsistent with the standard model. For example, Kinesin-8s increase catastrophe with only a modest decrease in the growth speed (Kip3, [29,52,57]; Kif18A and Kif18b, [53,54]; but note [55] who propose that Kif18a freezes dynamics; Kif18b, [83]). It is known, however, that the Kinesin-8s depolymerize stable GMPCPP microtubules (but see [55]); because GMPCPP is a slowly hydrolyzed analog of GTP, it is likely, therefore, that the Kinesin-8s increase koff. The coupled random model then predicts an increase in catastrophe (Equation 1). Little effect on growth is expected (Equation 2), because kon[Tb] ⪢ koff (but see [29,30]). Thus, the coupled-random model accounts for the effects of Kinesin-8s on microtubule dynamics.
The model also accounts for the increase in microtubule catastrophe by the Kinesin-13 MCAK [29,56,84]. In this case, the effect is due to decreasing the number of steps needed for catastrophe, n (Equation 1, [29]), which has no effect on the growth speed (Equation 2).
Importantly, the coupled-random model also accounts for the perplexing behavior of the MAPs for which there is a positive (not negative) correlation between growth and catastrophe. For example, XMAP215 is a catalyst of subunit exchange into and out of the microtubule that increases both kon and koff to the same extent [41,58,59,85]. Therefore, if kon ⪢ h, the coupled-random model predicts that XMAP215 will have little effect on catastrophe (Equation 1), even if it greatly increases the growth speed (Equation 2). This predicted behavior is indeed observed. This is a strong confirmation of the coupled-random model found in [68], which was developed only to account for the effect of tubulin on dynamics. Likewise, the effects of Kinesin-4 Xklp1 on catastrophe and growth (it decreases both) can be understood within the coupled-random model if Kinesin-4 decreases both kon and koff [60,61]. In other words, Kinesin-4 appears to work as an inhibitor of subunit exchange into and out of the microtubule: it is a capping protein. A third example is the yeast kinesin Kip2, which causes only a moderate increase in the growth speed but greatly decreases catastrophe. These effects are explained within the coupled-random model, as Kip2 both increases kon and decreases koff (Hibbel, unpublished). Thus, the coupled-random model goes a long way towards explaining the mechanism underlying the activities of most MAPs, including those that cannot be explained by the standard model.
Predictions of the coupled-random model
The recent finding that EB3, a homolog of EB1 that is also a catastrophe promoter [86], accelerates GTP hydrolysis [87] fits well with the coupled-random model. That EBs are GTPase activating proteins (GAPs) accords with several earlier arguments based on both structural and functional data: EB1 binds preferentially to GMPCPP [88] and GTPγS microtubule lattices [89] as opposed to the GDP lattice. Furthermore, EB1 binds close to the GTP-hydrolysis site in the microtubule [90] and accelerates conformational transitions in this site [91], which in turn are suggested to accelerate the induction of catastrophe. While an expectation of all GTP cap models is that increasing the hydrolysis rate will increase catastrophe (by destabilizing the cap), the coupled-random model (via Equation 1) specifically predicts that the catastrophe frequency will increase linearly with the hydrolysis rate, and then saturate when the hydrolysis rate exceeds the rate of tubulin addition. It will be important to measure how the EB1-dependent increase in the catastrophe rate depends on the growth rate, and to directly confirm that EB1 is a GAP using GTPase assays.
The coupled-random model provides a simple explanation for how doublecortin (DCX) inhibits catastrophe [50] without accelerating growth [92]: it inhibits hydrolysis (it is an antiGAP). AntiGAP activity would also explains why DCX nucleates GTP-microtubules [50], since it is thought that hydrolysis strongly destabilizes the seeds required for nucleation [93]. It is also consistent with the structural studies which show that, like EB1, DCX binds to the vertex of four tubulin dimers [50], which is near the GTP-binding pocket. However, in contrast to EB1, DCX does not catalyze the destruction of its own binding site, nor do DCX-GFP comets become longer at faster microtubule growth speeds [92]. In summary, the coupled-random model explains the reported effects of DCX on microtubule dynamics by its effect on hydrolysis alone. In future work it will be important to measure the interaction of DCX, EB1 and other proteins on microtubule dynamics and GTPase activities. In Figure 3, we have arranged the effects of the MAPs on the various steps in the coupled-random model.
Figure 3. The effects of MAPs on the key molecular parameters governing microtubule dynamics.
In this schematic of coupled-random hydrolysis, the effects of a variety of MAPs on the molecular rate constants controlling microtubule dynamics are visualized. A MAP in green indicates that it accelerates the step (for example, EB1 increases both the hydrolysis rate constant h and the tubulin association rate constant kon); a MAP in red indicates that it slows the step (Kinesin-4 and Kip2, for example, decrease tubulin dissociation rate constant koff).
Concluding remarks
Mathematical and quantitative modeling is invaluable in making sense of experimental data. Mathematical models of microtubule dynamics have allowed some hypotheses to be ruled out definitively, and have shown that others, such as the combination of coupled hydrolysis of the terminal tubulins and random hydrolysis of lattice tubulins (coupled-random models), accord with a large body of experimental data. Not only can they explain microtubule dynamics in the presence of tubulin alone, but they can account for the effects of a plethora of MAPs, resolving the inconsistencies inherent in the standard GTP-cap model and recent experimental findings concerning the effects of MAPs. Coupled random models presents a more nuanced quantification of the standard GTP-cap model of catastrophe. A strength of the specific model presented in the box is that, in contrast to more complex computational and analytical models, it posits a simple relationship between molecular parameters such as kon, koff and h, which can be “tuned” by regulatory MAPs, and the meta-parameters, fcat and vg, which describe empirical properties of microtubule dynamics. The model not only explains the action of many MAPs, but also makes verifiable predictions. For example, if EB1 promotes GTP hydrolysis and DCX inhibits it, then the model predicts how the catastrophe rate will depend on the concentrations of these MAPs and the growth rates. Testing these predictions is an important direction for future experimental work (see Outstanding Questions), especially if tools can be developed to spatially resolve hydrolysis at the single-microtubule level. An important future direction for theoretical work will be to try to find analytic solutions to the 3D models, giving mechanistic insight into length fluctuations of the proposed transient cap structures [30] so that the effects of MAPs can be incorporated. Another important future direction will be to understand the structural basis underlying the molecular parameters. We hope that the approach to microtubule dynamics that we have outlined in this review is a paradigm for how theory can be used with experiment to make progress on important biological problems.
Outstanding questions box.
What are the kinetics of EB1-stimulated GTP hydrolysis, and does DCX inhibit hydrolysis? To test predictions, tools will have to be developed to spatially resolve hydrolysis at the single-microtubule level.
What is the structural basis underlying the molecular parameters of microtubule growth and catastrophe, namely the tubulin association and dissociation rates, and the rate of GTP hydrolysis?
Can analytic solutions be found to two- and three-dimensional computational models to give mechanistic insight into length fluctuations of stabilizing cap structures?
Can the two- and three-dimensional models be generalized to incorporate the effects of MAPs on catastrophe?
Can the nucleotide state of individual tubulin dimers be visualized in a microtubule by light or electron microscopy? Can be it visualized in real time?
Trends box.
The standard GTP-cap model of microtubule dynamics predicts that faster growing microtubules have a larger stabilizing cap, which results in a lower catastrophe frequency. Recent studies show that for many microtubule-associated proteins (MAPs) this inverse relationship between growth and catastrophe breaks down.
MAPs whose effects on microtubule dynamics do not accord with the standard GTP-cap model include XMAP215, kinesin-8, EB1 and kinesin-4.
GTP-cap models in which hydrolysis cannot occur in the GTP-tubulin subunits at the end of the protofilaments (i.e. hydrolysis is coupled to polymerization) but does occur stochastically in the lattice (i.e. random hydrolysis) account for the observed effects of MAPs on microtubule dynamics.
Acknowledgements
We thank many present and former members of the Howard lab for their experimental and theoretical insights into the activities of kinesin motors and other proteins on the dynamical properties of microtubules. We also thank Dr. Holly Goodson who provided insightful comments on an earlier version of this manuscript. Research reported in this publication was supported by the NIGMS of the National Institutes of Health under award number R01GM110386 to JH. The content is solely the responsibility of the authors and does not necessarily represent the official views of the National Institutes of Health.
Footnotes
Publisher's Disclaimer: This is a PDF file of an unedited manuscript that has been accepted for publication. As a service to our customers we are providing this early version of the manuscript. The manuscript will undergo copyediting, typesetting, and review of the resulting proof before it is published in its final citable form. Please note that during the production process errors may be discovered which could affect the content, and all legal disclaimers that apply to the journal pertain.
BIBLIOGRAPHY
- 1.Hirokawa N, Tanaka Y. Kinesin superfamily proteins (KIFs): Various functions and their relevance for important phenomena in life and diseases. Exp. Cell Res. 2015 doi: 10.1016/j.yexcr.2015.02.016. DOI: 10.1016/j.yexcr.2015.02.016. [DOI] [PubMed] [Google Scholar]
- 2.Wang Z-X, et al. Axonal transport defects in Alzheimer’s disease. Mol. Neurobiol. 2015;51:1309–1321. doi: 10.1007/s12035-014-8810-x. [DOI] [PubMed] [Google Scholar]
- 3.De Vos KJ, et al. Role of Axonal Transport in Neurodegenerative Diseases*. Annu. Rev. Neurosci. 2008;31:151–173. doi: 10.1146/annurev.neuro.31.061307.090711. [DOI] [PubMed] [Google Scholar]
- 4.Desai a, Mitchison TJ. Microtubule polymerization dynamics. Annu. Rev. Cell Dev. Biol. 1997;13:83–117. doi: 10.1146/annurev.cellbio.13.1.83. [DOI] [PubMed] [Google Scholar]
- 5.Goodwin SS, Vale RD. Patronin Regulates the Microtubule Network by Protecting Microtubule Minus Ends. Cell. 2010;143:263–274. doi: 10.1016/j.cell.2010.09.022. [DOI] [PMC free article] [PubMed] [Google Scholar]
- 6.Jiang K, et al. Microtubule Minus-End Stabilization by Polymerization-Driven CAMSAP Deposition. Dev. Cell. 2014;28:295–309. doi: 10.1016/j.devcel.2014.01.001. [DOI] [PubMed] [Google Scholar]
- 7.Meunier S, Vernos I. K-fibre minus ends are stabilized by a RanGTP-dependent mechanism essential for functional spindle assembly. Nat. Cell Biol. 2011;13:1406–1414. doi: 10.1038/ncb2372. [DOI] [PubMed] [Google Scholar]
- 8.Akhmanova A, Hoogenraad CC. Microtubule Minus-End-Targeting Proteins. Curr. Biol. 2015;25:R162–R171. doi: 10.1016/j.cub.2014.12.027. [DOI] [PubMed] [Google Scholar]
- 9.Howard J, Hyman A. a. Dynamics and mechanics of the microtubule plus end. Nature. 2003;422:753–758. doi: 10.1038/nature01600. [DOI] [PubMed] [Google Scholar]
- 10.DeLuca JG, et al. Kinetochore Microtubule Dynamics and Attachment Stability Are Regulated by Hec1. Cell. 2006;127:969–982. doi: 10.1016/j.cell.2006.09.047. [DOI] [PubMed] [Google Scholar]
- 11.Cheerambathur DK, Desai A. Linked in: formation and regulation of microtubule attachments during chromosome segregation. Curr. Opin. Cell Biol. 2014;26:113–122. doi: 10.1016/j.ceb.2013.12.005. [DOI] [PMC free article] [PubMed] [Google Scholar]
- 12.Hoppeler-Lebel A, et al. Centrosomal CAP350 protein stabilises microtubules associated with the Golgi complex. J. Cell Sci. 2007;120:3299–3308. doi: 10.1242/jcs.013102. [DOI] [PubMed] [Google Scholar]
- 13.Grigoriev I, et al. STIM1 Is a MT-Plus-End-Tracking Protein Involved in Remodeling of the ER. Curr. Biol. 2008;18:177–182. doi: 10.1016/j.cub.2007.12.050. [DOI] [PMC free article] [PubMed] [Google Scholar]
- 14.Akhmanova A, Steinmetz MO. Tracking the ends: a dynamic protein network controls the fate of microtubule tips. Nat. Rev. Mol. Cell Biol. 2008;9:309–322. doi: 10.1038/nrm2369. [DOI] [PubMed] [Google Scholar]
- 15.Lansbergen G, et al. CLASPs Attach Microtubule Plus Ends to the Cell Cortex through a Complex with LL5. Dev. Cell. 2006;11:21–32. doi: 10.1016/j.devcel.2006.05.012. [DOI] [PubMed] [Google Scholar]
- 16.Ananthanarayanan V, et al. Dynein motion switches from diffusive to directed upon cortical anchoring. Cell. 2013;153 doi: 10.1016/j.cell.2013.05.020. [DOI] [PubMed] [Google Scholar]
- 17.Akhmanova A, et al. Touch, grasp, deliver and control: functional cross-talk between microtubules and cell adhesions. Traffic. 2009;10:268–274. doi: 10.1111/j.1600-0854.2008.00869.x. [DOI] [PubMed] [Google Scholar]
- 18.Roberts AJ, et al. Reconstitution of dynein transport to the microtubule plus end by kinesin. Elife. 2014;2014:1–16. doi: 10.7554/eLife.02641. [DOI] [PMC free article] [PubMed] [Google Scholar]
- 19.Laan L, et al. Cortical dynein controls microtubule dynamics to generate pulling forces that position microtubule asters. Cell. 2012;148:502–514. doi: 10.1016/j.cell.2012.01.007. [DOI] [PMC free article] [PubMed] [Google Scholar]
- 20.Kirschner M, Mitchison T. Beyond self-assembly: from microtubules to morphogenesis. Cell. 1986;45:329–342. doi: 10.1016/0092-8674(86)90318-1. [DOI] [PubMed] [Google Scholar]
- 21.Mitchison T, Kirschner M. Dynamic instability of microtubule growth. Nature. 1984;312:237–242. doi: 10.1038/312237a0. [DOI] [PubMed] [Google Scholar]
- 22.Alberts B, et al. Molecular Biology of the Cell. 2008:54. [Google Scholar]
- 23.Walker R. a., et al. Asymmetric behavior of severed microtubule ends after ultraviolet-microbeam irradiation of individual microtubules in vitro. J. Cell Biol. 1989;108:931–937. doi: 10.1083/jcb.108.3.931. [DOI] [PMC free article] [PubMed] [Google Scholar]
- 24.Walker R. a., et al. Dilution of individual microtubules observed in real time in vitro: Evidence that cap size is small and independent of elongation rate. J. Cell Biol. 1991;114:73–81. doi: 10.1083/jcb.114.1.73. [DOI] [PMC free article] [PubMed] [Google Scholar]
- 25.Voter W. a., et al. Dilution-induced disassembly of microtubules: Relation to dynamic instability and the GTP cap. Cell Motil. Cytoskeleton. 1991;18:55–62. doi: 10.1002/cm.970180106. [DOI] [PubMed] [Google Scholar]
- 26.Carlier MF, Pantaloni D. Kinetic analysis of guanosine 5′-triphosphate hydrolysis associated with tubulin polymerization. Biochemistry. 1981;20:1918–1924. doi: 10.1021/bi00510a030. [DOI] [PubMed] [Google Scholar]
- 27.Howard J, Hyman A. a. Growth, fluctuation and switching at microtubule plus ends. Nat. Rev. Mol. Cell Biol. 2009;10:569–574. doi: 10.1038/nrm2713. [DOI] [PubMed] [Google Scholar]
- 28.Schek HT, et al. Microtubule Assembly Dynamics at the Nanoscale. Curr. Biol. 2007;17:1445–1455. doi: 10.1016/j.cub.2007.07.011. [DOI] [PMC free article] [PubMed] [Google Scholar]
- 29.Gardner MK, et al. Depolymerizing kinesins Kip3 and MCAK shape cellular microtubule architecture by differential control of catastrophe. Cell. 2011;147:1092–1103. doi: 10.1016/j.cell.2011.10.037. [DOI] [PubMed] [Google Scholar]
- 30.Coombes CE, et al. Evolving tip structures can explain age-dependent microtubule catastrophe. Curr. Biol. 2013;23:1342–1348. doi: 10.1016/j.cub.2013.05.059. [DOI] [PMC free article] [PubMed] [Google Scholar]
- 31.Howard J, Hyman A. a. Microtubule polymerases and depolymerases. Curr. Opin. Cell Biol. 2007;19:31–35. doi: 10.1016/j.ceb.2006.12.009. [DOI] [PubMed] [Google Scholar]
- 32.Akhmanova A, Steinmetz MO. Microtubule +TIPs at a glance. J. Cell Sci. 2010;123:3415–3419. doi: 10.1242/jcs.062414. [DOI] [PubMed] [Google Scholar]
- 33.Van der Vaart B, Akhamova A, Straube A. Regulation of microtubule dynamic instability. Biochem. Soc. Trans. 2009 doi: 10.1042/BST0371007. DOI: 10.1002/cm.970260402. [DOI] [PubMed] [Google Scholar]
- 34.Drummond DR. Regulation of microtubule dynamics by kinesins. Seminars in Cell and Developmental Biology. 2011;22:927–934. doi: 10.1016/j.semcdb.2011.09.021. [DOI] [PubMed] [Google Scholar]
- 35.Wieczorek M, et al. Microtubule-associated proteins control the kinetics of microtubule nucleation. Nat. Cell Biol. 2015;17 doi: 10.1038/ncb3188. [DOI] [PubMed] [Google Scholar]
- 36.Sharp DJ, Ross JL. Microtubule-severing enzymes at the cutting edge. J. Cell Sci. 2012;125:2561–2569. doi: 10.1242/jcs.101139. [DOI] [PMC free article] [PubMed] [Google Scholar]
- 37.Janke C, Chloë Bulinski J. Post-translational regulation of the microtubule cytoskeleton: mechanisms and functions. Nat. Rev. Mol. Cell Biol. 2011;12:773–786. doi: 10.1038/nrm3227. [DOI] [PubMed] [Google Scholar]
- 38.Verde F, et al. Control of Microtubule Dynamics and Length by Cyclin A- and Cyclin B-dependant Kinases in Xenophobus Egg Extracts. J. Cell Biol. 1992;118:1097–1108. doi: 10.1083/jcb.118.5.1097. [DOI] [PMC free article] [PubMed] [Google Scholar]
- 39.Dogterom M, Leibler S. Physical aspects of the growth and regulation of microtubule structures. Phys. Rev. Lett. 1993;70:1347–1350. doi: 10.1103/PhysRevLett.70.1347. [DOI] [PubMed] [Google Scholar]
- 40.Walker R. a., et al. Dynamic instability of individual microtubules analyzed by video light microscopy: rate constants and transition frequencies. J. Cell Biol. 1988;107:1437–1448. doi: 10.1083/jcb.107.4.1437. [DOI] [PMC free article] [PubMed] [Google Scholar]
- 41.Al-Bassam J, et al. CLASP promotes microtubule rescue by recruiting tubulin dimers to the microtubule. Dev. Cell. 2010;19:245–258. doi: 10.1016/j.devcel.2010.07.016. [DOI] [PMC free article] [PubMed] [Google Scholar]
- 42.Drubin DG, Kirschner MW. Tau protein function in living cells. J. Cell Biol. 1986;103:2739–2746. doi: 10.1083/jcb.103.6.2739. [DOI] [PMC free article] [PubMed] [Google Scholar]
- 43.Drechsel DN, et al. Modulation of the dynamic instability of tubulin assembly by the microtubule-associated protein tau. Mol. Biol. Cell. 1992;3:1141–1154. doi: 10.1091/mbc.3.10.1141. [DOI] [PMC free article] [PubMed] [Google Scholar]
- 44.LeBoeuf AC, et al. FTDP-17 mutations in tau alter the regulation of microtubule dynamics: An “alternative core” model for normal and pathological tau action. J. Biol. Chem. 2008;283:36406–36415. doi: 10.1074/jbc.M803519200. [DOI] [PMC free article] [PubMed] [Google Scholar]
- 45.Podolski M, et al. Stu2, the Budding Yeast XMAP215/Dis1 Homolog, Promotes Assembly of Yeast Microtubules by Increasing Growth Rate and Decreasing Catastrophe Frequency. J. Biol. Chem. 2014;289:28087–28093. doi: 10.1074/jbc.M114.584300. [DOI] [PMC free article] [PubMed] [Google Scholar]
- 46.Holzbaur EL, et al. Homology of a 150K cytoplasmic dynein-associated polypeptide with the Drosophila gene Glued. Nature. 1991;351:579–583. doi: 10.1038/351579a0. [DOI] [PubMed] [Google Scholar]
- 47.Lazarus JE, et al. Dynactin Subunit p150Glued Is a Neuron-Specific Anti-Catastrophe Factor. PLoS Biol. 2013;11 doi: 10.1371/journal.pbio.1001611. [DOI] [PMC free article] [PubMed] [Google Scholar]
- 48.Jourdain L, et al. Stathmin: A tubulin-sequestering protein which forms a ternary T2S complex with two tubulin molecules. Biochemistry. 1997;36:10817–10821. doi: 10.1021/bi971491b. [DOI] [PubMed] [Google Scholar]
- 49.Belmont LD, Mitchison TJ. Identification of a protein that interacts with tubulin dimers and increases the catastrophe rate of microtubules. Cell. 1996;84:623–631. doi: 10.1016/s0092-8674(00)81037-5. [DOI] [PubMed] [Google Scholar]
- 50.Moores C. a., et al. Mechanism of microtubule stabilization by doublecortin. Mol. Cell. 2004;14:833–839. doi: 10.1016/j.molcel.2004.06.009. [DOI] [PubMed] [Google Scholar]
- 51.Fourniol FJ, et al. Template-free 13-protofilament microtubule-MAP assembly visualized at 8 Å resolution. J. Cell Biol. 2010;191:463–470. doi: 10.1083/jcb.201007081. [DOI] [PMC free article] [PubMed] [Google Scholar]
- 52.Varga V, et al. Yeast kinesin-8 depolymerizes microtubules in a length-dependent manner. Nat. Cell Biol. 2006;8:957–962. doi: 10.1038/ncb1462. [DOI] [PubMed] [Google Scholar]
- 53.Mayr MI, et al. The Human Kinesin Kif18A Is a Motile Microtubule Depolymerase Essential for Chromosome Congression. Curr. Biol. 2007;17:488–498. doi: 10.1016/j.cub.2007.02.036. [DOI] [PubMed] [Google Scholar]
- 54.Stumpff J, et al. The Kinesin-8 Motor Kif18A Suppresses Kinetochore Movements to Control Mitotic Chromosome Alignment. Dev. Cell. 2008;14:252–262. doi: 10.1016/j.devcel.2007.11.014. [DOI] [PMC free article] [PubMed] [Google Scholar]
- 55.Du Y, et al. The Kinesin-8 Kif18A Dampens Microtubule Plus-End Dynamics. Curr. Biol. 2010;20:374–380. doi: 10.1016/j.cub.2009.12.049. [DOI] [PubMed] [Google Scholar]
- 56.Hunter AW, et al. The kinesin-related protein MCAK is a microtubule depolymerase that forms an ATP-hydrolyzing complex at microtubule ends. Mol. Cell. 2003;11:445–457. doi: 10.1016/s1097-2765(03)00049-2. [DOI] [PMC free article] [PubMed] [Google Scholar]
- 57.Gupta ML, et al. Plus end-specific depolymerase activity of Kip3, a kinesin-8 protein, explains its role in positioning the yeast mitotic spindle. Nat. Cell Biol. 2006;8:913–923. doi: 10.1038/ncb1457. [DOI] [PubMed] [Google Scholar]
- 58.Brouhard GJ, et al. XMAP215 Is a Processive Microtubule Polymerase. Cell. 2008;132:79–88. doi: 10.1016/j.cell.2007.11.043. [DOI] [PMC free article] [PubMed] [Google Scholar]
- 59.Zanic M, et al. Synergy between XMAP215 and EB1 increases microtubule growth rates to physiological levels. Nat. Cell Biol. 2013;15:1–8. doi: 10.1038/ncb2744. [DOI] [PubMed] [Google Scholar]
- 60.Bringmann H, et al. A kinesin-like motor inhibits microtubule dynamic instability. Science. 2004;303:1519–1522. doi: 10.1126/science.1094838. [DOI] [PubMed] [Google Scholar]
- 61.Bieling P, et al. A minimal midzone protein module controls formation and length of antiparallel microtubule overlaps. Cell. 2010;142:420–432. doi: 10.1016/j.cell.2010.06.033. [DOI] [PubMed] [Google Scholar]
- 62.Vitre B, et al. EB1 regulates microtubule dynamics and tubulin sheet closure in vitro. Nat. Cell Biol. 2008;10:415–421. doi: 10.1038/ncb1703. [DOI] [PubMed] [Google Scholar]
- 63.Lopus M, et al. Cooperative stabilization of microtubule dynamics by EB1 and CLIP-170 involves displacement of stably bound P i at microtubule ends. Biochemistry. 2012;51:3021–3030. doi: 10.1021/bi300038t. [DOI] [PubMed] [Google Scholar]
- 64.Jemseena V, Gopalakrishnan M. Effects of aging in catastrophe on the steady state and dynamics of a microtubule population. Phys. Rev. E. 2015;91:052704. doi: 10.1103/PhysRevE.91.052704. [DOI] [PubMed] [Google Scholar]
- 65.Stukalin EB, Kolomeisky AB. ATP hydrolysis stimulates large length fluctuations in single actin filaments. Biophys. J. 2006;90:2673–2685. doi: 10.1529/biophysj.105.074211. [DOI] [PMC free article] [PubMed] [Google Scholar]
- 66.Ranjith P, et al. Role of ATP-hydrolysis in the dynamics of a single actin filament. Biophys. J. 2010;98:1418–1427. doi: 10.1016/j.bpj.2009.12.4306. [DOI] [PMC free article] [PubMed] [Google Scholar]
- 67.Padinhateeri R, et al. Random hydrolysis controls the dynamic instability of microtubules. Biophys. J. 2012;102:1274–1283. doi: 10.1016/j.bpj.2011.12.059. [DOI] [PMC free article] [PubMed] [Google Scholar]
- 68.Bowne-Anderson H, et al. Microtubule dynamic instability: A new model with coupled GTP hydrolysis and multistep catastrophe. BioEssays. 2013;35:452–461. doi: 10.1002/bies.201200131. [DOI] [PMC free article] [PubMed] [Google Scholar]
- 69.Li X, Kolomeisky AB. Theoretical Analysis of Microtubule Dynamics at All Times. 2014. DOI: 10.1021/jp507206f. [DOI] [PubMed]
- 70.Gardner MK, et al. Rapid microtubule self-assembly kinetics. Cell. 2011;146:582–592. doi: 10.1016/j.cell.2011.06.053. [DOI] [PMC free article] [PubMed] [Google Scholar]
- 71.VanBuren V, et al. Mechanochemical model of microtubule structure and self-assembly kinetics. Biophys. J. 2005;89:2911–2926. doi: 10.1529/biophysj.105.060913. [DOI] [PMC free article] [PubMed] [Google Scholar]
- 72.Bayley PM, et al. Microtubule dynamic instability: numerical simulation of microtubule transition properties using a Lateral Cap model. J. Cell Sci. 1990;95(Pt 1):33–48. doi: 10.1242/jcs.95.1.33. [DOI] [PubMed] [Google Scholar]
- 73.Martin SR, et al. Dynamic instability of microtubules: Monte Carlo simulation and application to different types of microtubule lattice. Biophys. J. 1993;65:578–596. doi: 10.1016/S0006-3495(93)81091-9. [DOI] [PMC free article] [PubMed] [Google Scholar]
- 74.Margolin G, et al. Mean-field study of the role of lateral cracks in microtubule dynamics. Phys. Rev. E - Stat. Nonlinear, Soft Matter Phys. 2011;83 doi: 10.1103/PhysRevE.83.041905. [DOI] [PubMed] [Google Scholar]
- 75.Chen YD, Hill TL. Monte Carlo study of the GTP cap in a five-start helix model of a microtubule. Proc. Natl. Acad. Sci. U. S. A. 1985;82:1131–1135. doi: 10.1073/pnas.82.4.1131. [DOI] [PMC free article] [PubMed] [Google Scholar]
- 76.Flyvbjerg H, et al. Microtubule dynamics: Caps, catastrophes, and coupled hydrolysis. Physical Review E. 1996;54:5538–5560. doi: 10.1103/physreve.54.5538. [DOI] [PubMed] [Google Scholar]
- 77.Jemseena V, Gopalakrishnan M. Microtubule catastrophe from protofilament dynamics. Phys. Rev. E - Stat. Nonlinear, Soft Matter Phys. 2013;88:1–15. doi: 10.1103/PhysRevE.88.032717. [DOI] [PubMed] [Google Scholar]
- 78.Brouhard GJ. Dynamic instability 30 years later: complexities in microtubule growth and catastrophe. Mol. Biol. Cell. 2015;26:1207–1210. doi: 10.1091/mbc.E13-10-0594. [DOI] [PMC free article] [PubMed] [Google Scholar]
- 79.Nogales E, et al. Structure of the alpha beta tubulin dimer by electron crystallography. Nature. 1998;391:199–203. doi: 10.1038/34465. [DOI] [PubMed] [Google Scholar]
- 80.VanBuren V, et al. Estimates of lateral and longitudinal bond energies within the microtubule lattice. Proc. Natl. Acad. Sci. U. S. A. 2002;99:6035–6040. doi: 10.1073/pnas.092504999. [DOI] [PMC free article] [PubMed] [Google Scholar]
- 81.Margolin G, et al. Analysis of a mesoscopic stochastic model of microtubule dynamic instability. Phys. Rev. E - Stat. Nonlinear, Soft Matter Phys. 2006;74 doi: 10.1103/PhysRevE.74.041920. [DOI] [PubMed] [Google Scholar]
- 82.Margolin G, et al. The mechanisms of microtubule catastrophe and rescue: implications from analysis of a dimer-scale computational model. Molecular Biology of the Cell. 2012;23:642–656. doi: 10.1091/mbc.E11-08-0688. [DOI] [PMC free article] [PubMed] [Google Scholar]
- 83.Stout JR, et al. Kif18B interacts with EB1 and controls astral microtubule length during mitosis. Mol. Biol. Cell. 2011;22:3070–3080. doi: 10.1091/mbc.E11-04-0363. [DOI] [PMC free article] [PubMed] [Google Scholar]
- 84.Wordeman L, Mitchison TJ. Identification and partial characterization of mitotic centromere-associated kinesin, a kinesin-related protein that associates with centromeres during mitosis. J. Cell Biol. 1995;128:95–105. doi: 10.1083/jcb.128.1.95. [DOI] [PMC free article] [PubMed] [Google Scholar]
- 85.Li W, et al. Reconstitution of dynamic microtubules with drosophila XMAP215, EB1, and sentin. J. Cell Biol. 2012;199:849–862. doi: 10.1083/jcb.201206101. [DOI] [PMC free article] [PubMed] [Google Scholar]
- 86.Komarova Y, et al. Mammalian end binding proteins control persistent microtubule growth. J. Cell Biol. 2009;184:691–706. doi: 10.1083/jcb.200807179. [DOI] [PMC free article] [PubMed] [Google Scholar]
- 87.Zhang R, et al. Mechanistic Origin of Microtubule Dynamic Instability and Its Modulation by EB Proteins. Cell. 2015 doi: 10.1016/j.cell.2015.07.012. DOI: 10.1016/j.cell.2015.07.012. [DOI] [PMC free article] [PubMed] [Google Scholar]
- 88.Zanic M, et al. EB1 recognizes the nucleotide state of tubulin in the microtubule lattice. PLoS One. 2009;4:1–5. doi: 10.1371/journal.pone.0007585. [DOI] [PMC free article] [PubMed] [Google Scholar]
- 89.Maurer SP, et al. GTPgammaS microtubules mimic the growing microtubule end structure recognized by end-binding proteins (EBs) Proc. Natl. Acad. Sci. U. S. A. 2011;108:3988–3993. doi: 10.1073/pnas.1014758108. [DOI] [PMC free article] [PubMed] [Google Scholar]
- 90.Maurer SP, et al. EBs recognize a nucleotide-dependent structural cap at growing microtubule ends. Cell. 2012;149:371–382. doi: 10.1016/j.cell.2012.02.049. [DOI] [PMC free article] [PubMed] [Google Scholar]
- 91.Maurer SP, et al. EB1 accelerates two conformational transitions important for microtubule maturation and dynamics. Curr. Biol. 2014;24:372–384. doi: 10.1016/j.cub.2013.12.042. [DOI] [PMC free article] [PubMed] [Google Scholar]
- 92.Bechstedt S, et al. Doublecortin Recognizes the Longitudinal Curvature of the Microtubule End and Lattice. Curr. Biol. 2014;24:2366–2375. doi: 10.1016/j.cub.2014.08.039. [DOI] [PubMed] [Google Scholar]
- 93.Hyman a a, et al. Role of GTP hydrolysis in microtubule dynamics: information from a slowly hydrolyzable analogue, GMPCPP. Mol. Biol. Cell. 1992;3:1155–1167. doi: 10.1091/mbc.3.10.1155. [DOI] [PMC free article] [PubMed] [Google Scholar]
- 94.Weingarten MD, et al. A protein factor essential for microtubule assembly. Proc. Natl. Acad. Sci. U. S. A. 1975;72:1858–62. doi: 10.1073/pnas.72.5.1858. [DOI] [PMC free article] [PubMed] [Google Scholar]
- 95.Gard DL, Kirschner MW. A microtubule-associated protein from Xenopus eggs that specifically promotes assembly at the plus-end. J. Cell Biol. 1987;105:2203–2215. doi: 10.1083/jcb.105.5.2203. [DOI] [PMC free article] [PubMed] [Google Scholar]
- 96.Wang PJ, Huffaker TC. Stu2p: A microtubule-binding protein that is an essential component of the yeast spindle pole body. J. Cell Biol. 1997;139:1271–1280. doi: 10.1083/jcb.139.5.1271. [DOI] [PMC free article] [PubMed] [Google Scholar]
- 97.Su LK, et al. APC binds to the novel protein EB1. Cancer Res. 1995;55:2972–2977. [PubMed] [Google Scholar]
- 98.Sobel A, et al. Intracellular substrates for extracellular signaling. Characterization of a ubiquitous, neuron-enriched phosphoprotein (stathmin) J. Biol. Chem. 1989;264:3765–3772. [PubMed] [Google Scholar]
- 99.Pasqualone D, Huffaker TC. STU1, a suppressor of a ??-tubulin mutation, encodes a novel and essential component of the yeast mitotic spindle. J. Cell Biol. 1994;127:1973–1984. doi: 10.1083/jcb.127.6.1973. [DOI] [PMC free article] [PubMed] [Google Scholar]
- 100.Roof DM, et al. Kinesin-related proteins required for assembly of the mitotic spindle. J. Cell Biol. 1992;118:95–108. doi: 10.1083/jcb.118.1.95. [DOI] [PMC free article] [PubMed] [Google Scholar]
- 101.Des Portes V, et al. A novel CNS gene required for neuronal migration and involved in X- linked subcortical laminar heterotopia and lissencephaly syndrome. Cell. 1998;92:51–61. doi: 10.1016/s0092-8674(00)80898-3. [DOI] [PubMed] [Google Scholar]
- 102.Moores CA, et al. Distinct roles of doublecortin modulating the microtubule cytoskeleton. EMBO J. 2006;25:4448–4457. doi: 10.1038/sj.emboj.7601335. [DOI] [PMC free article] [PubMed] [Google Scholar]
- 103.DeZwaan TM, et al. Kinesin-related KIP3 of Saccharomyces cerevisiae is required for a distinct step in nuclear migration. J. Cell Biol. 1997;138:1023–1040. doi: 10.1083/jcb.138.5.1023. [DOI] [PMC free article] [PubMed] [Google Scholar]
- 104.Luboshits G, Benayahu D. MS-KIF18A, new kinesin; Structure and cellular expression. Gene. 2005;351:19–28. doi: 10.1016/j.gene.2005.02.009. [DOI] [PubMed] [Google Scholar]