

Abstract
Kidney development requires the differentiation and organization of discrete nephron epithelial lineages, yet the genetic and molecular pathways involved in these events remain poorly understood. The embryonic zebrafish kidney, or pronephros, provides a simple and useful model to study nephrogenesis. The pronephros is primarily comprised of two types of epithelial cells: transportive and multiciliated cells (MCCs). Transportive cells occupy distinct tubule segments and are characterized by the expression of various solute transporters, while MCCs function in fluid propulsion and are dispersed in a “salt-and-pepper” fashion within the tubule. Epithelial cell identity is reliant on interplay between the Notch signaling pathway and retinoic acid (RA) signaling, where RA promotes MCC fate by inhibiting Notch activity in renal progenitors, while Notch acts downstream to trigger transportive cell formation and block adoption of an MCC identity. Previous research has shown that the transcription factor ets variant 5a (etv5a), and its closely related ETS family members, are required for ciliogenesis in other zebrafish tissues. Here, we mapped etv5a expression to renal progenitors that occupy domains where MCCs later emerge. Thus, we hypothesized that etv5a is required for normal development of MCCs in the nephron. etv5a loss of function caused a decline of MCC number as indicated by the reduced frequency of cells that expressed the MCC-specific markers outer dense fiber of sperm tails 3b (odf3b) and centrin 4 (cetn4), where rescue experiments partially restored MCC incidence. Interestingly, deficiency of ets variant 4 (etv4), a related gene that is broadly expressed in the posterior mesoderm during somitogenesis stages, also led to reduced MCC numbers, which were further reduced by dual etv5a/4 deficiency, suggesting that both of these ETS factors are essential for MCC formation and that they also might have redundant activities. In epistatic studies, exogenous RA treatment expanded the etv5a domain within the renal progenitor field and RA inhibition blocked etv5a in this populace, indicating that etv5a acts downstream of RA. Additionally, treatment with exogenous RA partially rescued the reduced MCC phenotype after loss of etv5a. Further, abrogation of Notch with the small molecule inhibitor DAPT increased the renal progenitor etv5a expression domain as well as MCC density in etv5a deficient embryos, suggesting Notch acts upstream to inhibit etv5a. In contrast, etv4 levels in renal progenitors were unaffected by changes in RA or Notch signaling levels, suggesting a possible non-cell autonomous role during pronephros formation. Taken together, these findings have revealed new insights about the genetic mechanisms of epithelial cell development during nephrogenesis.
Keywords: kidney, pronephros, nephrogenesis, epithelial cell fate, multiciliated cells, etv5a, etv4, retinoic acid, Notch signaling
INTRODUCTION
The vertebrate kidney maintains fluid homeostasis within the body, a function essential for survival. In contrast to the development of most vertebrate organs, kidney ontogeny involves the progressive formation of several structures, such that the earliest forms are transient and become degraded when more complex kidney structures are generated (Saxen, 1987). The pronephros is the first kidney structure to form, and it is derived from bilateral stripes of intermediate mesoderm (IM). Although the pronephros has become a vestigial organ in mammals, lower vertebrates such as frogs and fish require this structure during embryonic development as a functioning excretory organ (Dressler, 2006). The second kidney structure, known as the mesonephros, serves as the functional fetal kidney in mammals and is drained by a nephric duct (Dressler, 2006). The third kidney emerges from an outgrowth of the nephric duct, termed the ureteric bud, which undergoes branching morphogenesis and complex interactions with the surrounding IM that induce mesenchymal-to-epithelial transitions to generate the final adult kidney, or metanephros (Little and McMahon, 2012). All of the three stages are primarily composed of a conserved functional unit known as the nephron, which is structured into three parts: a blood filter, a segmented epithelial tubule that reabsorbs nutrients and secretes solutes, and a collecting duct that drains the nephron and also participates in electrolyte and fluid balance (Vize, et al., 1997; Cheng, et al., 2015; Desgrange and Cereghini, 2015).
Failure of nephron function leads to kidney disease, the 8th leading cause of death in the United States alone. Over 20 million Americans have kidney disease, of which 200,000 are adolescents (Center for Disease Control and Prevention, 2014; Saran, et al., 2015). Further, congenital and acquired diseases of the urinary tract (CAKUT) account for 20-30% of genetic malformations diagnosed during gestation, and are a major cause of morbidity and chronic kidney disease in children worldwide (dos Santos Junior, et al., 2014). Despite the increasing global prevalence of renal disease, many aspects of the genetic and molecular pathways that control nephron development are poorly understood (Cheng and Wingert, 2014; Marra and Wingert, 2014). Furthermore, the mammalian kidney contains millions of intricately arranged nephrons, making nephrogenesis challenging to study (Costantini and Kopan, 2010).
Recently, the embryonic zebrafish (Danio rerio) kidney, or pronephros, has emerged as a useful nephrogenesis model that is highly amenable to experimental analysis (Ebarasi, et al., 2011). The zebrafish pronephros is comprised of two nephrons that share a single blood filter and common collecting duct (Drummond, 2005), and exhibits a conserved segmentation pattern when compared to the mammalian nephron (Wingert, et al., 2007; Wingert and Davidson, 2008). Recent studies have established the timing of renal progenitor development and continued to identify essential patterning factors (O'Brien, et al., 2011; Naylor, et al., 2013; Gerlach and Wingert, 2014; McKee, et al., 2014; Cheng and Wingert, 2015), demonstrating that the zebrafish pronephros provides an excellent opportunity to delineate the fundamental genetic and molecular pathways that are relevant to nephrogenesis.
At just 24 hours post fertilization (hpf), the zebrafish pronephros is fully segmented and contains a mixture of two functionally distinct populations of epithelial cell types: transportive cells and MCCs (Fig. 1A) (Kramer-Zucker, et al., 2005; Wingert, et al., 2007). Transportive cells have a single primary cilium and recover ions based on their expression of ion transporters. Like populations of these cells make up the different tubule segments of the nephron, which include the podocytes (P), neck (N), proximal convoluted tubule (PCT), proximal straight tubule (PST), distal early (DE), corpuscle of Stannius (CS), distal late (DL), pronephric duct (PD) and cloaca (C) (Fig. 1A) (Wingert, et al., 2007). By comparison, the epithelial population of MCCs functions in fluid propulsion and they are dispersed in a “salt-and-pepper” fashion within the tubule, located in the caudal portion of the PCT and throughout the PST and the DE segments (Liu, et al., 2007; Ma and Jiang, 2007; Li, et al., 2014). Transporter versus MCC fate choice is mediated by Notch signaling (Liu, et al., 2007; Ma and Jiang, 2007), and recent work has also revealed that the transcription factor mecom acts through the Notch signaling pathway to restrict MCC formation (Li, et al., 2014). Further, RA signaling acts upstream to regulate the expression domain of mecom in the renal progenitors and thereby promote MCC fate (Li, et al., 2014). However, much still remains unknown about the other factors that regulate MCC identity.
Figure 1. etv5a transcripts show early expression in the renal progenitor field where the MCC domain later emerges.

(A) Schematic of the fully segmented zebrafish pronephros at 24 hpf, shown in both a lateral and dorsal view. Enlargement depicts the somite map of transporter cell segments and the MCC domain. (B) WISH at the 15 ss reveals that the etv5a (purple) expression domain correlates to the rostral and central regions of the renal progenitor field, demarcated by the marker slc4a4a (purple). slc12a3 (purple) denotes the caudal region, and somites are stained by smyhc1 in red. Black brackets highlight etv5a, slc4a4a, and slc12a3 expression domains in the pronephros. (C) The expression domain of etv5a is restricted in the proximal tubule during nephrogenesis, where the MCC domain, marked by odf3b (purple), expands. Insets show magnified view of etv5a and odf3b domains in the pronephros, denoted by the black bars. At the 28 ss, the etv5a domain is largely restricted to the PST (black bar), with weak expression in neighboring pronephros segments (black dots). The expression domain of odf3b at the 28 ss stage spans a caudal portion of the PCT (black dots), the PST (black bar), and the DE segment (black dots). (D) Schematic of etv5a cDNA depicting the two functional domains, acidic (light green) and ETS (dark grey), of the Etv5a protein. Abbreviations: P (podocyte), N (neck), PCT (proximal convoluted tubule), PST (proximal straight tubule), DE (distal early), CS (corpuscle of Stannius), DL (distal late), PD (pronephric duct), C (cloaca), ss (somite stage), etv5a (ets variant 5a), slc4a4a (solute carrier family 4 (sodium bicarbonate cotransporter), member 4a), slc12a3 (solute carrier family 12 (sodium/chloride transporter), member 3), smyhc1 (slow myosin heavy chain 1), odf3b (outer dense fiber of sperm tails 3b), TAD (transactivation domain).
To date, a complex renal transcription factor code has been established for the zebrafish pronephros at 24 hpf (Wingert and Davidson, 2011), but the location of gene expression does not necessarily discern functionality. In fact, the role(s) of most genes expressed in the renal progenitors that form the pronephros are undetermined at present (Gerlach and Wingert, 2013). Of these factors, etv5a stood out to us as an intriguing candidate for MCC development due to its expression in the central region of the developing nephrons (Wingert and Davidson, 2011).
etv5a is a member of the conserved family of E26 transformation-specific (ETS) transcription factors, categorized within the polyomavirus enhancer activator 3 (Pea3) subfamily (Oh, et al., 2012), which have been shown to have diverse roles in tissue patterning and ciliogenesis (Wasylyk, et al., 1998; Kobberup, et al., 2007; Eo, et al., 2008; Mao, et al., 2009; Znosko, et al., 2010; Chen, et al., 2013; Janesick, et al., 2013; Akagi, et al., 2015). Furthermore, the mammalian homologue of etv5a, Etv5, is known to be required for development of the murine kidney. Elegant genetic studies in the developing mouse metanephros have identified important roles for Etv5, as well as Etv4, another Pea3 subfamily member, in development of the ureteric bud and nephric duct (the latter also known as the Wolffian duct) (Lu, et al., 2009; Kurre, et al., 2010; Costantini, 2010; Costantini and Kopan, 2010; Little and McMahon, 2012). In contrast, the possible roles of these factors in nephron patterning have not been investigated to date. Previous studies have documented the homology between zebrafish etv5a and mammalian Etv5 (Chen, et al., 2013), which suggests they are orthologous genes. Also, etv5a is one of the few transcription factors that map principally to a lone nephron segment at the 24 hpf stage (Wingert and Davidson, 2011). However, the role of etv5a in zebrafish nephrogenesis has not been examined until now.
Here, we confirm that etv5a is expressed predominantly in the PST segment of the zebrafish pronephros, and that etv5a expression correlates to the MCC domain within the tubule. Through loss of function studies, we demonstrate that etv5a is required to promote MCC identity. Interestingly, the deficiency of its related gene etv4 also caused reduced MCC numbers that were further reduced when in double etv5a/etv4 deficient embryos, suggesting redundancy between these factors. The overexpression of etv5a alone was not sufficient to produce an MCC phenotype, adding further support to the notion that etv5a is just one target in the developmental pathway of MCCs. Through a combination of traditional molecular and chemical genetic approaches, we have placed etv5a downstream of RA in promoting MCC fate, where RA is a positive regulator of etv5a expression in the developing pronephros. Further, we ascertained that Notch signaling inhibits etv5a to restrict MCC identity. The concept that etv5a is induced by RA and inhibited by Notch was supported by the rescue of MCC density in etv5a morphants after treatment with exogenous RA, and by inhibition of Notch via DAPT. Interestingly, the expression domain of etv4 suggests that this factor may serve non-cell autonomous roles in renal progenitor development. Taken together, these data reveal a novel role for etv5a in the ontogeny of MCCs in the zebrafish pronephros, and indicate that further studies with etv4 will be useful in further defining the mechanisms of MCC formation.
MATERIALS AND METHODS
Zebrafish husbandry
Zebrafish adults were maintained and cared for by the Center for Zebrafish Research at the University of Notre Dame as described under protocols 13-021 and 16-025, and zebrafish embryos were raised in E3 embryo media and fixed as described (Kimmel, et al., 1995).
WISH, flat mounting, and image acquisition
Whole-mount in situ hybridization (WISH) was performed as previously described (Wingert, et al., 2007; Galloway, et al., 2008), with antisense RNA probes either digoxigenin-labeled (etv5a, odf3b, centrin, slc4a4a, slc12a3) or fluorescein-labeled (smyhc1) that were synthesized as described using in vitro transcription with IMAGE clone templates (Wingert et al., 2007; Wingert and Davidson, 2011). Embryos at the 15 somite stage (ss) were flat mounted using a previously described protocol (Cheng, et al., 2014). All images were taken at 4x and 20x magnification by using a Nikon eclipse Ni with a DS-Fi2 camera, and all figures were generated with Adobe Photoshop CS5.
Morpholino knockdown
Antisense splice-blocking morpholino (MO) etv5a MO (5’-ATACATTAGGGAGTACCTGTAGCTG-3’) (Mao, et al., 2009) (ZFIN Annotation MO1-etv5a), start-site blocking etv5a MO2 (5’-TCACCTGGGTCTTCAAAGAGGCTCC-3’) (Chen, et al., 2013) (ZFIN Annotation MO5-etv5a), splice-blocking etv4a MO (5’-TTAAAAGTCTAATGTTTACCTCCTC-3’) (Mao, et al., 2009) (ZFIN Annotation MO2-etv4), and start-site blocking etv4 MO2 (5’-ATCCATGCCTTAACCGTTTGTGGTC-3’) (Znosko, et al., 2013) (ZFIN Annotation MO3-etv4) were purchased (Gene Tools, LLC) and prepared to a 4 mM stock concentration that was stored at −20°C. Wild-type (WT) embryos were injected with approximately 1 nL of etv5a MO (1:18), etv5a MO2 (1:15), etv4 MO (1:10), etv4 MO2 (1:10), or a combination of etv5a MO (1:18) and etv4 MO (1:10) and examined at desired time points.
Dextran excretion assay
WT and etv5a morphants were treated with 0.003% PTU/E3 around 24 hpf, then anesthetized with 0.02% tricaine before 40 kDa dextran-fluorescein (FITC-dextran) from Invitrogen was injected into a caudal somite at 48 hpf (Li, et al., 2014). After FITC-dextran injection, embryos were washed and placed in fresh PTU/E3, then assessed for renal function based on PCT endocytosis and dextran clearance with a fluorescent microscope (Anzenberger, et al., 2006). Live fluorescent images were taken by mounting the embryos in a solution of 2% methylcellulose/0.02% tricaine.
Fluorescent staining and imaging
Whole-mount fluorescent in situ hybridization (FISH) was combined with whole-mount immunofluorescence (IF) to visualize MCCs and cilia in the pronephros of both WT and etv5a morphant embryos. FISH was performed as prescribed (Brend and Holley, 2009) using an antisense RNA probe for odf3b that was digoxigenin-labeled. Embryos were incubated in a solution of 1% H2O2 in methanol to remove the first peroxidase (Brend and Holley, 2009) before continuing with IF. Anti-acetylated α-tubulin was used to mark cilia via IF (Jaffe, et al., 2010). Embryos were then mounted by removing the head and yolk ball (Jaffe, et al., 2010) and imaged as z-stacks at 60x magnification with a Nikon C2 confocal microscope.
Benzidene staining
To visualize blood flow, o-dianisidine staining was performed as described (Wingert, et al., 2004; Wingert, et al., 2005; Dooley, et al., 2008; Fraenkel, et al., 2009). Representative images of embryos were taken at 36, 48, 60, and 72 hpf with a Nikon eclipse Ni with a DS-Fi2 camera.
MCC Quantification
Total MCC number was found by viewing 24 hpf embryos dorsally at the highest magnification on a Nikon SMZ1000 stereomicroscope and counting all MCCs within both nephrons as marked by odf3b or cetn4. MCC density was found by counting the MCCs on one nephron in a 3-somite boundary at 20x magnification through a Nikon eclipse Ni with a DS-Fi2 camera. The area was outlined by the rectangle tool on Nikon imaging software and had the dimensions 626.008 px(w) × 752.657 px(h). For both MCC number and MCC density, at least 50 embryos were analyzed and averaged. Significance was determined by a two-tailed student's t-test.
cRNA synthesis and microinjection of etv5a and etv5aΔacidic constructs
The zebrafish etv5a open reading frame (ORF) was PCR amplified using high fidelity TAQ polymerase from the Expand PCR kit (Roche) in combination with a PCR Mix solution (100 mM dNTPs, 1 M MgCl2, 1 M Tris-HCl (pH 8.4), 4 M KCl, 1% Gelatin, 100 mg/mL BSA, and sterile H2O) and primers (5’–TGACGAATTCGCCGCCACCatggacggattttatgaccagcaagttccatttatggtcccacctaatcagaagtcattgcaagtggaggaaccatataac–3’ and 5’–gcgcattatgacgacgggtcttcgtatttagttgacggtggcgagcagtgtgtttctgggatgcctttccctgatggttacgtgtactgaCTCGAGTGAC–3’). The 100 bp forward primer was designed with a 4 bp anchor (bold print) followed by the 6 bp EcoR1 sequence (italicized), the Kozak consensus (underlined), and finally a sequence beginning at the etv5a start site (lowercase). Alternatively, the reverse primer contains the etv5a stop sequence (lowercase), 6 bp Xho1 sequence (italicized), and a 4 bp anchor (bold print). Amplified ORF was ligated into the pCS2 vector and transformed into DH5α competent cells (Invitrogen). etv5a capped RNA (cRNA) was synthesized using the mMESSAGE mMACHINE SP6 Transcription kit (Ambion) and stored at −80°C. Overexpression experiments were performed by injecting 220, 300, 400, and 500 pg/nL etv5a cRNA into WT embryos. For rescue experiments, a combination of 220 pg/nL with either etv5a MO (1:18) or etv5a MO2 (1:15) was injected into WT embryos. The etv5aΔacidic construct was synthesized in a similar fashion, using the same reverse primer as above, but with a forward primer (5’–TGACGAATTCGCCGCCACCatgtcggagagcttgatgtttcatggcccacccctggccaagatcaaacgggaactgagtccctctaaagagctctccccc–3’) that has a 4 bp anchor (bold print), 6 bp EcoR1 sequence (italicized), the Kozak consensus (underlined), and the etv5a start sequence beginning after the acidic domain of etv5a (lowercase). etv5aΔacidic microinjection was done at 10 pg/nL. For all overexpression, rescue, and etv5aΔacidic experiments, WT embryos were injected at the one-cell stage with approximately 1 nL solution. All images are representative of at least 50 embryos.
Acridine Orange (AO) assay
AO (250 μg/mL) was diluted 1:50 in E3 without methylene blue to make a final working solution. At the 24 ss, control and etv5a MO2 injected embryo clutches were divided. Half of the embryos were incubated at the 24 ss in AO working solution for 45 minutes under foil, and then rinsed in E3. Representative embryos for both control and injected phenotypes were mounted in 2% methylcellulose/0.02% tricaine and immediately imaged using a fluorescent microscope. The second half of embryos were incubated in AO working solution for 45 minutes under foil at the 30 ss, rinsed in E3, and then immediately imaged in 2% methylcellulose/0.02% tricaine using a fluorescent microscope. Before imaging at the 24 ss and 30 ss, embryos were quantified by similar amounts of cell death in the head.
RT-PCR
20-30 uninjected and injected embryos at the 28 ss were homogenized in 500 μL TRIZOL (Ambion) and RNA was isolated according to manufacturer insructions. PCR amplification was performed using the SuperScript® IV First-Strand Synthesis System (Invitrogen) according to manufacturer instructions with the etv5a primers (forward 5’-TGATGTTTCATGGCCCACCCCTGGCCAAGATCAAACGGGAACTGAGTCCCTCCAAAGAGCTCTCCCCCTGTAGCCAGGATAGAAGTCCCATGCCGTATGG and reverse 5’-CTAGGTTCGTTACTGAAGTGAGTTTCACGGTTCAGGGGTGGACAGGGCACTACAAAGGGTGGGCTCTGGCTGTGGTGAGGGACACACGTCTGGTTGGGTG) designed to amplify the region between exons 6 and 7, or etv4 primers (forward 5’-ATGTGCCTGGCTGCCCATCCATGTACCATCACAACGAAGGCTACTCCAACCCACAGCACAACAGTGAAG and reverse 5’-CTTTTGCATAATTCCCTTCTCATAATAGTAACGCAAAGAGCGACTCAGTTTGTCATAGTTCATGGCTGGACGGTTCTTCTGCATCCCCCAGAGTCTTGCC) designed to amplify the region between exons 8 and 11. Products were isolated by agarose gel extraction (Qiagen QIAquick Gel Extraction) and sequenced.
Chemical treatments
Both RA and DEAB (Sigma-Aldrich) were dissolved in 100% DMSO to make 1 M stock solutions, as previously described (Wingert, et al., 2007; Lengerke, et al., 2011). For all RA treatments, WT and etv5a morphants were incubated and protected from light in 1×10⁻⁷ M RA/DMSO made with E3 from 60% epiboly to 24 hpf. The chemical was then washed off and the embryos were fixed in 4% PFA. Embryos were incubated in the dark in 1.6×10⁻⁵ M DEAB/DMSO made in E3 for the same time period. For both RA and DEAB experiments, control embryos were incubated in the dark in a solution of 1uL DMSO per 10 mLs E3. DAPT (Calbiochem), the small molecule Notch inhibitor, was dissolved in 100% DMSO to make a 10 mM stock solution as described (Li, et al., 2014). Embryos were incubated in the dark with either 100 uM DAPT/DMSO made in E3 or DMSO in E3 from 90% epiboly to 24 hpf. At 24 hpf, the chemicals were washed off and the embryos were fixed. All chemical treatments were fully penetrant and produced similar results between replicates. At least 50 embryos were treated and analyzed via WISH for all treatments, and representative images were taken at 4x and 20x magnification with a Nikon eclipse Ni with a DS-Fi2 camera.
etv5a length quantification
To measure etv5a domain length in the pronephros, the polyline tool on the Nikon imaging software was used to trace the expression domain at 20x magnification. At least 50 embryos were measured, and the average was found. Significance was determined by a two-tailed student's t-test.
RESULTS
Early expression of etv5a transcripts in the renal progenitor field correlates to the pronephros domains where MCCs later emerge
By the 28 somite stage (ss), or approximately 24 hpf, the zebrafish pronephros is comprised of at least two functionally discrete epithelial cell types: transportive and MCCs (Gerlach and Wingert, 2013). Transportive cells recover and secrete ions based on their expression of ion transporters, and like populations make up the conserved nephron segments (Fig. 1A) (Wingert, et al., 2007). MCCs function in fluid propulsion (Kramer-Zucker, et al., 2005), and are dispersed in a “salt-and-pepper” fashion throughout the tubule, with the densest populace located in the PST (Fig. 1A). Interplay between the Notch signaling pathway and RA mediates epithelial cell fate during pronephric development, however much remains unknown about the additional factors that regulate MCC identity (Liu, et al., 2007; Ma and Jiang, 2007; Li, et al., 2014). Previous studies have demonstrated that expression of the transcription factor etv5a is restricted to the PST of the zebrafish nephron at the 28 ss (Wingert and Davidson, 2011) and that etv5a is required for ciliogenesis in Kuppfer's vesicle (Znosko, et al., 2010), but the functional role of etv5a in nephron patterning has not been determined.
To gain further insights into the spatiotemporal expression of etv5a, and thus better consider its possible task(s) during nephrogenesis, we performed additional gene expression studies using whole-mount in situ hybridization (WISH) in wild-type (WT) zebrafish embryos. At the 15 ss, the renal progenitor field is organized into rostral, central and caudal domains (Wingert and Davidson, 2011). These domains can be visualized by performing WISH using a riboprobe to detect the expression of solute carrier family 4 (sodium bicarbonate cotransporter), member 4 (slc4a4a) in the proximal and central domains, and the marker solute carrier family 12 (sodium/chloride transporter), member 3 (slc12a3) within the caudal domain (Fig. 1B). In contrast, the MCC lineage, which is labeled specifically by odf3b, cannot be detected via WISH at this time point (data not shown) (Liu, et al., 2007; Ma and Jiang, 2007). Interestingly, we found that etv5a transcripts were expressed in renal progenitors at the 15 ss, and were distinctly restricted to an area within the rostral and central regions of the developing pronephros (Fig. 1B). Between the 20 and 28 ss, etv5a transcripts were strongly expressed in the PST segment, with faint expression in the directly adjacent domains of the PCT and DE segments (Fig. 1C). The etv5a expression domain in the developing nephrons between 20-28 ss correlated with the expression domain of the mature MCC marker odf3b (Fig. 1C). Interestingly, the odf3b domain was initially detected in a small proximal region at the 20ss, which progressively became longer at the 24 and 28 ss (Fig. 1C), consistent with a sequence of advancing MCC differentiation within the pronephros within the PCT, PST, and DE segments.
Earlier studies have demonstrated that the Etv5a protein in zebrafish has two functional domains: a 5’ acidic transcriptional activation domain and terminal ETS DNA-binding domain (Fig. 1D) (Chen, et al., 2013), the latter of which forms a winged helix-turn-helix (wHTH) motif that binds DNA elements approximately 10 basepairs long that contain the motif GGAA/T (Dittmer and Nordheim, 1998). Additionally, etv5a belongs to the conserved ETS transcription factor family, which has been shown to have roles in tissue patterning as well as in ciliogenesis (Wasylyk, et al., 1998; Kobberup, et al., 2007; Mao, et al., 2009; Znosko, et al., 2010; Chen, et al., 2013; Janesick, et al., 2013). These previously described functional roles of etv5a in tissue development, together with the early onset of etv5a expression before mature MCCs can be detected and the continued expression of etv5a throughout the MCC domain at later time points, led us to hypothesize that etv5a was involved in MCC formation in the renal progenitor field.
etv5a loss of function and kidney dysfunction
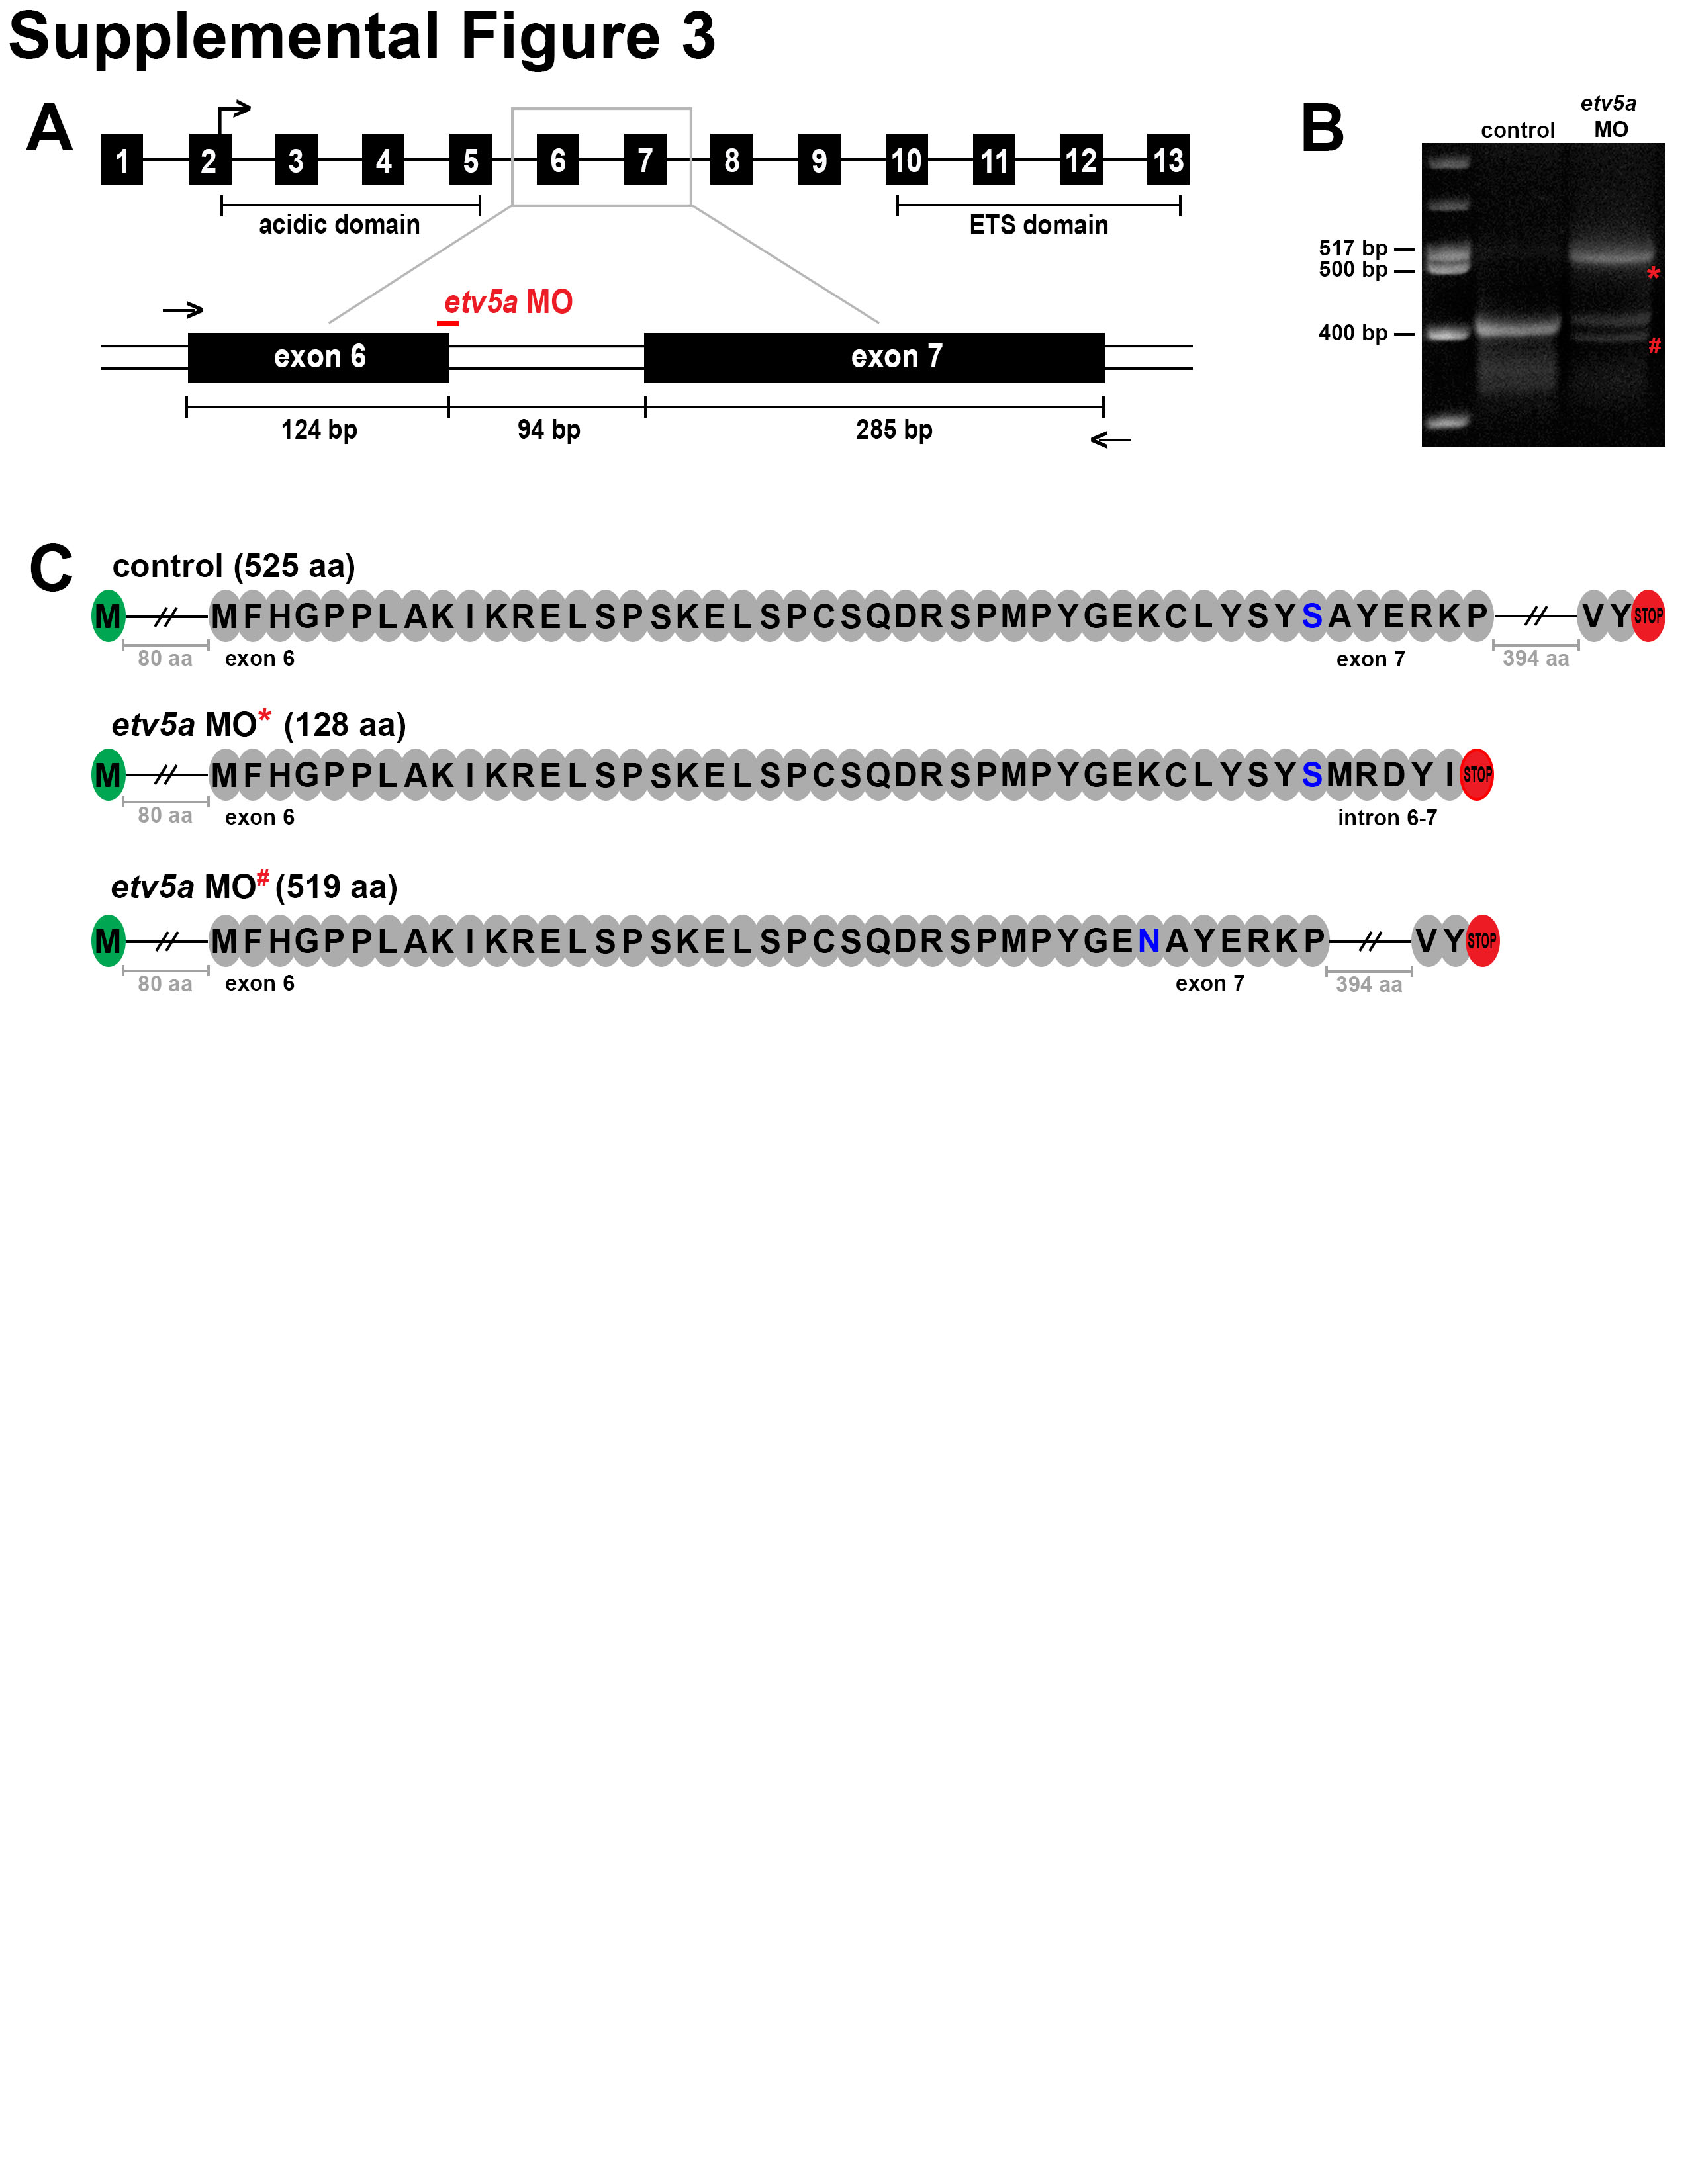
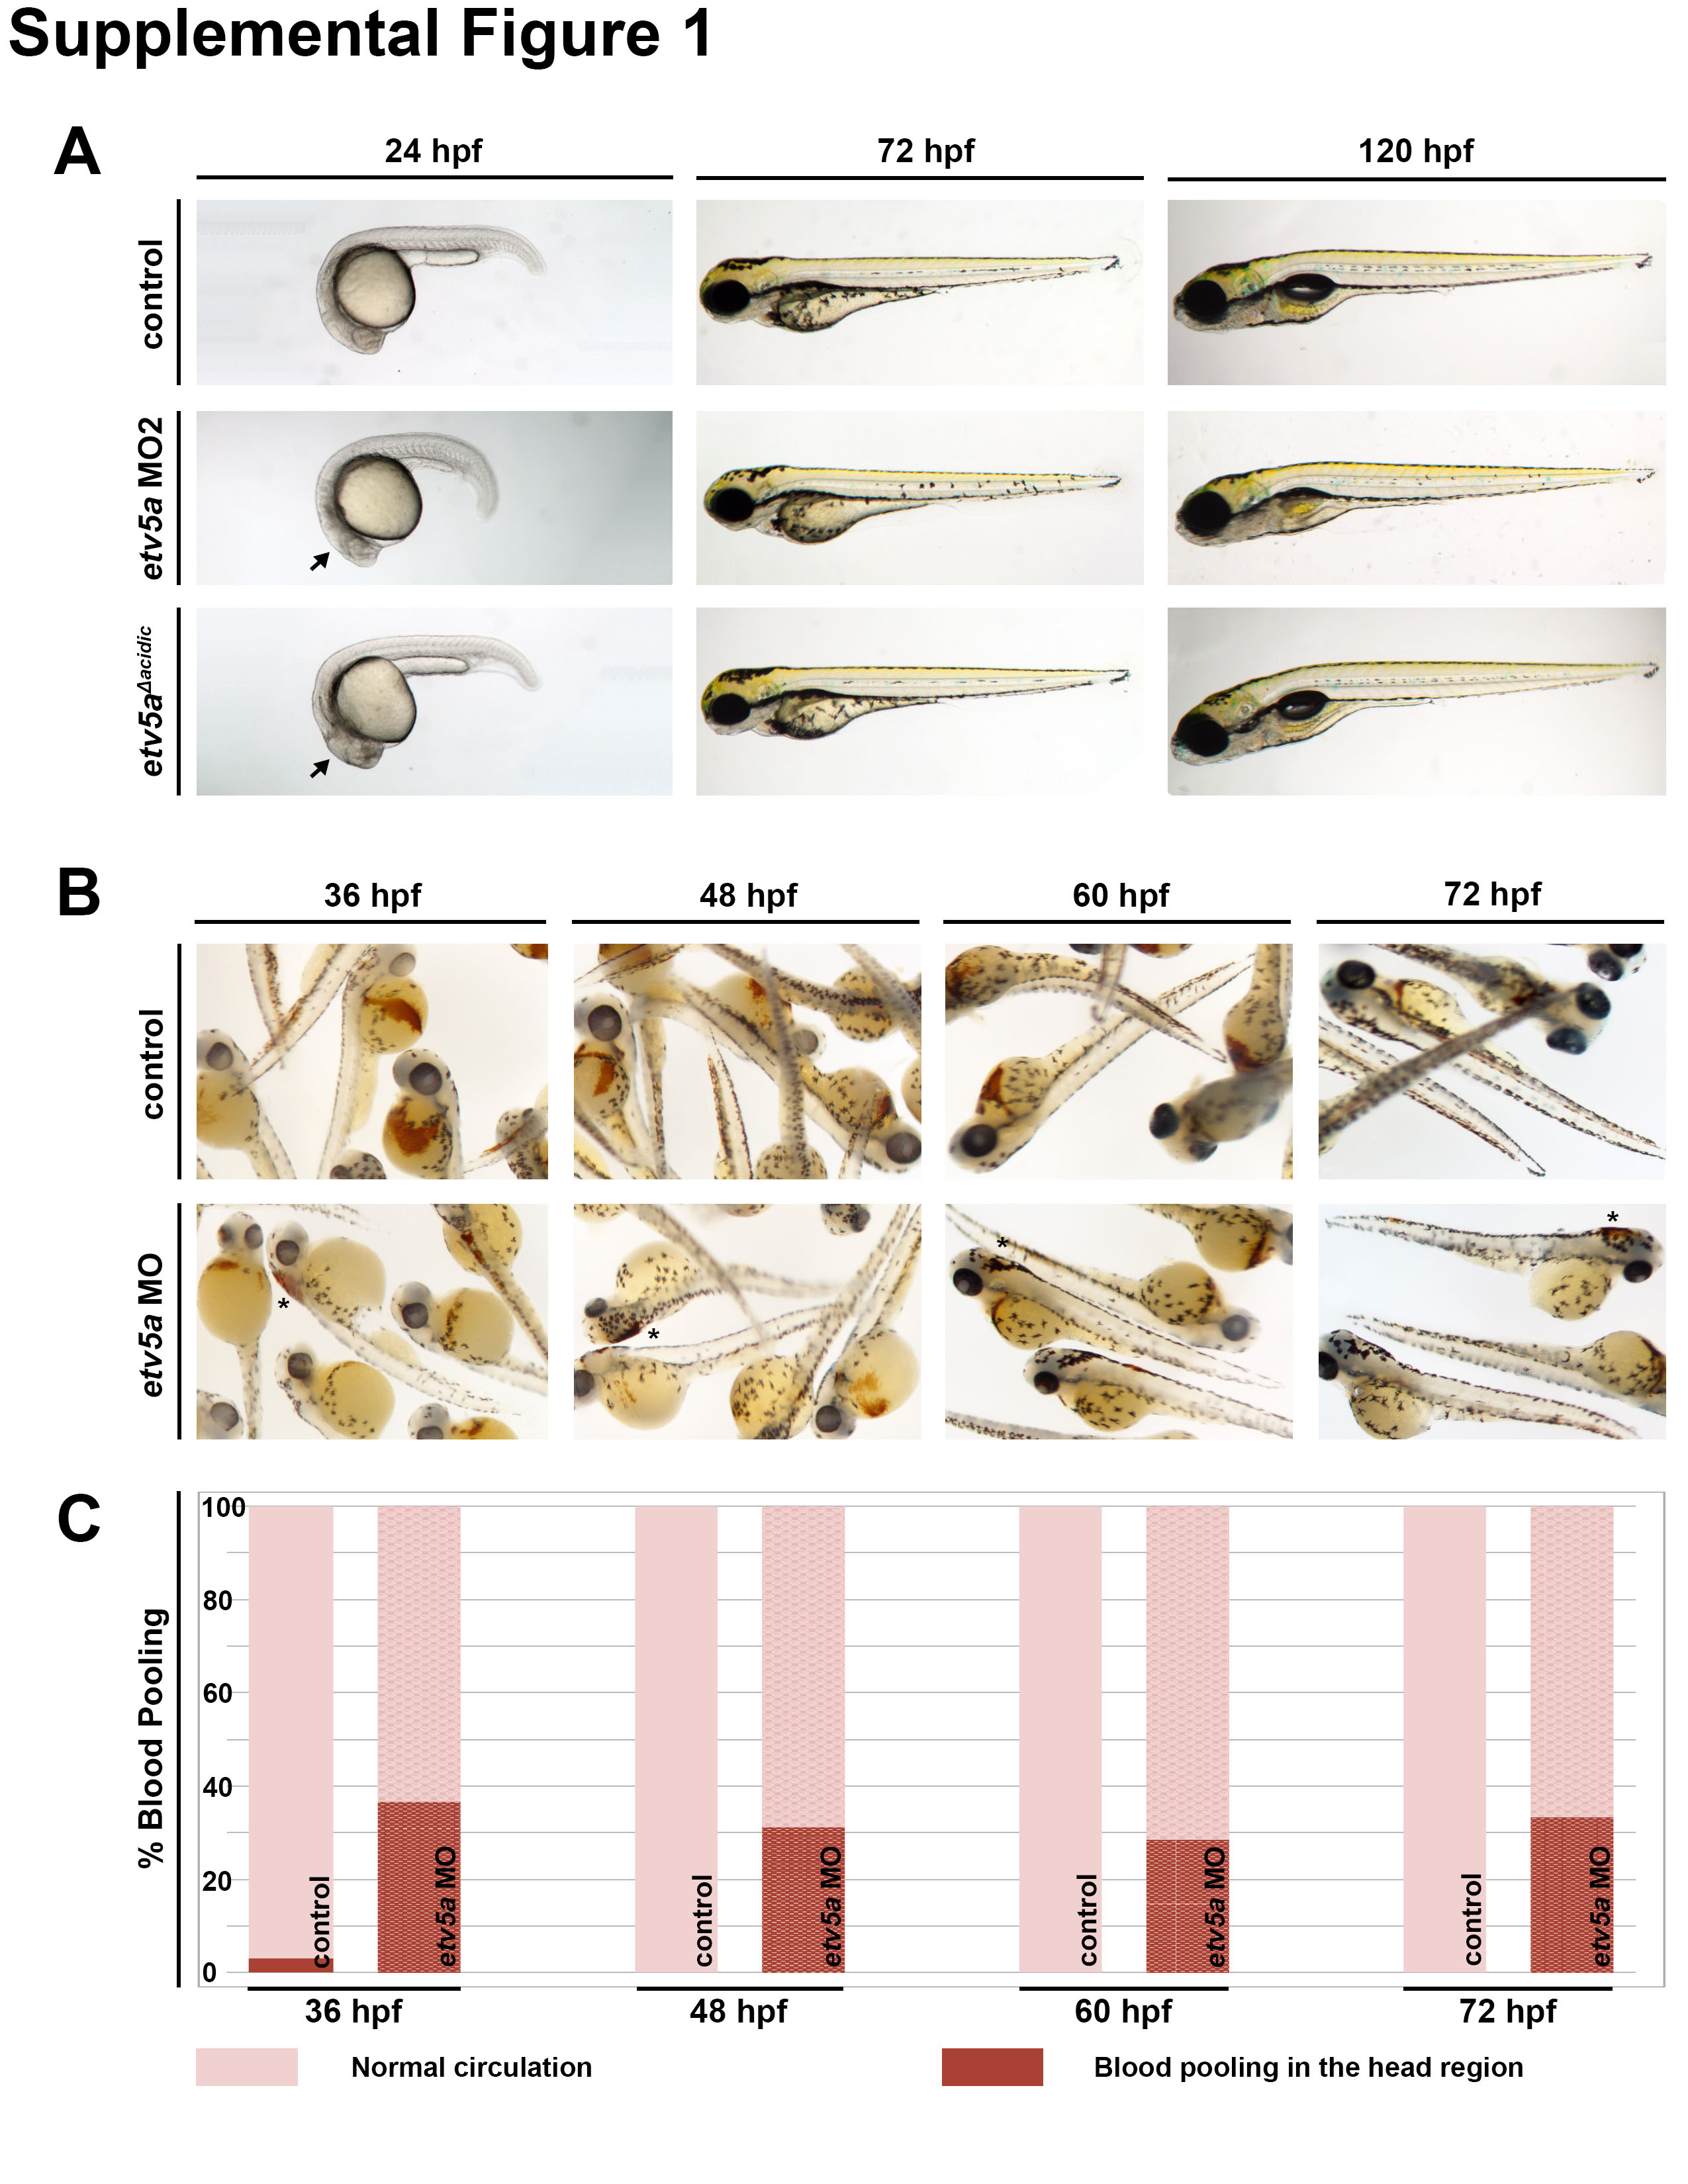
To investigate the possible requirement(s) for etv5a function during nephrogenesis, we used a previously characterized splice-blocking morpholino (MO), etv5a MO (Mao, et al., 2009), and a start-site blocking MO, etv5a MO2 (Chen, et al., 2013), to conduct a series of loss of function studies. MOs were injected into WT embryos at the one-cell stage, and their development was monitored over subsequent time points. Through the 72 hpf age, etv5a morphants were grossly normal, though they had slightly smaller heads, and we noted subtle, diffuse tissue darkening in the central nervous system at approximately 24 hpf, suggestive of possible cell death in this area (Fig. 2A; Fig. S1A). By 120 hpf, we noticed that etv5a MO morphants had pericardial edema (Fig. 2A), which indicates fluid imbalance and possible kidney dysfunction (Li, et al., 2014). At the minimum injection dosage of etv5a MO2 that was associated with alterations to cranial development, most embryos were not edemic by 120 hpf (with 84% WT (158/188) and 16% edemic (30/188)) (Fig. S1A). However, due to the presence of edema in the etv5a MO morphants, we performed o-dianisidine staining to examine blood circulation and found that approximately 30% of the morphants had abnormal blood pooling in the head (Fig. S1B, S1C). This observation is consistent with the previous observation of defective blood vessel formation in etv5a deficient embryos (Chen, et al., 2013). Acridine orange staining revealed that etv5a deficient embryos had slightly elevated cell death at the 24 and 30 ss (Fig. S2A; data not shown), an aspect that was not examined at these explicit stages during previous characterization of etv5a knockdown (Chen, et al., 2013) (Fig. S2B; data not shown). Further, we utilized RT-PCR to confirm knockdown with etv5a MO, and determined that this reagent led to missplicing, generating transcripts that encoded truncated versions of the protein (Fig. S3).
Figure 2. etv5a morphants have possible kidney dysfunction.

(A) Live time course demonstrates the formation of an edema (black arrowhead), indicative of fluid imbalance and possible renal dysfunction, by 120 hpf in etv5a morphants (etv5a MO) compared to control siblings. etv5a morphants also have a smaller, darker head (black arrow) than the control embryos. (B) Control embryos demonstrate proper renal function by clearing FITC-dextran over time. etv5a morphants continue to accumulate fluorescence (white arrow), suggesting improper renal clearance. White asterisks denote uptake of dextran by the PCT of both the control and etv5a morphant. (C) Whole mount IF in combination with FISH demonstrates that etv5a morphants have fewer odf3b+ cells (red) than control siblings at 24 hpf. Insets show digital zoom of single odf3b+ cells (white arrowhead) associated with multiple cilia (green) marked by α-tubulin in both the control and etv5a morphants. Nuclei are stained by DAPI in blue. Abbreviations: MO (morpholino), hpf (hours post fertilization), hpi (hours post injection).
To further assess kidney function in the context of etv5a deficiency, we injected fluorescently labeled dextran (FITC-dextran) into 48 hpf morphant and control embryos to analyze renal clearance and PCT endocytosis (Anzenberger, et al., 2006; Li, et al., 2014). Both WT and etv5a deficient embryos displayed FITC-dextran staining in the proximal tubule, indicating functional PCT endocytosis (Fig. 2B). Unlike their control siblings, however, etv5a MO morphants maintained overall fluorescence after the initial injection of FITC-dextran (Fig. 2B), implying that etv5a deficient zebrafish embryos were incapable of clearing significant dextran from the body. This further suggested altered renal function due to the absence of etv5a expression, though these phenotypic alterations could be a secondary consequence of decreased cardiovascular flow and/or defects to fluid flow within the pronephros.
Nevertheless, given the etv5a expression domain where MCCs emerge, and the role of MCCs in fluid propulsion, we wondered if MCC formation was altered in the absence of etv5a function. In order to ascertain the status of MCC development in the nephron tubule of etv5a morphants, we combined whole-mount immunofluorescence (IF) with whole-mount fluorescent in situ hybridization (FISH) to concomitantly label MCCs based on odf3b transcripts and the presence of α-tubulin which labels cilia (Fig. 2C). We discovered that etv5a morphants had fewer odf3b+ cells than control siblings, however, all odf3b+ cells were associated with α-tubulin (Fig. 2C). This data suggests that etv5a morphants were capable of developing mature MCCs, but that this cell type was reduced in number. This could contribute to the phenotype of a fluid imbalance in etv5a deficiency, though systemic defects in vascular flow likely impact overall osmoregulation.
etv5a is required for MCC development
As etv5a deficiency produced a kidney failure phenotype associated with decreased MCC formation, we next further analyzed the morphants via WISH to characterize the role of etv5a in MCC pronephric development. We found that etv5a morphants, generated by the microinjection of either etv5a MO or etv5a MO2 into WT embryos, displayed decreased numbers of MCCs based on expression of the specific MCC markers cetn4 and odf3b (Fig. 3A, 3C, 3D). By close examination of the WISH-stained embryos in a dorsal aspect, we were able to reliably count the total number of MCCs per embryo (Fig. S4). Overall, while WT embryos develop an average of approximately 40-45 MCCs in the pronephros, etv5a deficiency was associated with formation of only approximately 28-30 MCCs, which was equivalent to a highly significant ~33% reduction in MCC number (Fig. 3C, 3D).
Figure 3. etv5a is required for MCC development.

(A) At 24 hpf, WISH analysis demonstrates etv5a loss of function via morpholino (MO) knockdown (etv5a MO, etv5a MO2) and deletion of the acidic domain (etv5aΔacidic) resulted in reduced expression of the MCC markers odf3b and centrin 4 (cetn4) (purple) in the pronephros. Insets are a magnification of the MCC domain in both a lateral (top) and dorsal (bottom) view. (B) odf3b expression via WISH in 24 hpf embryos co-injected with etv5a capped RNA (cRNA) and each morpholino (MO) was not as reduced as MO injection alone. Injection of etv5a cRNA also did not produce a great change in odf3b expression in the pronephros. (C) Quantification demonstrates a significant decrease in average MCC number for cetn4 in all three etv5a knockdown versions. (D) etv5a loss of function (etv5a MO, etv5a MO2, and etv5aacidic) produced a significant reduction in the average MCC number compared to the control, as marked by odf3b. Co-injection of etv5a cRNA and MO partially rescued the MCC phenotype seen in embryos injected with MO only, where injection of etv5a cRNA alone did not produce a significant change in average MCC number compared to the control. Images and quantification are representative of at least 50 embryos, and error bars denote standard error. P-values: *****p<0.001, ****p<0.002, **p<0.02
Next, to further assess the effect of etv5a deficiency, we utilized an independent knockdown strategy. Prior work has established that abrogation of the acidic domain in etv5a, that encodes one of the two functional domains of the Etv5a protein, causes a dominant-negative effect when this variant is expressed during zebrafish embryogenesis (Chen, et al., 2013). Thus, in addition to these two independent MOs, we also injected WT embryos at the one-cell stage with capped RNA (cRNA) synthesized from a deletion construct (etv5aΔacidic), where we removed the acidic domain of etv5a cDNA to generate a dominant-negative reagent (Fig. 1C) (Chen, et al., 2013). In embryos injected with approximately 10 pg of cRNA encoding the etv5aΔacidic transcript, there was a significant decline in the number of pronephros cells that displayed odf3b or cetn4 expression compared to WTs (Fig. 3A). This decreased number of MCCs was similar to that seen in embryos injected with either etv5a MO or etv5a MO2, with an average of approximately 28-30 MCCs formed, thereby displaying around a ~33% reduction in MCC quantity (Fig. 3D). At the dosage of etv5aΔacidic expression that was associated with significantly decreased MCC number, the embryos also displayed the morphology of tissue darkening in the cranial area but did not develop edema through the 120 hpf time point (Fig. S1A). At higher dosages of etv5aΔacidic expression, embryos displayed pericardial edema (20 pg) and expression was early embryonic lethal at even higher dosages (50 pg) (data not shown). Taken together, the result of etv5aΔacidic expression independently suggests that etv5a deficiency leads to the reduced formation of MCCs in the pronephros.
To further validate MO specificity as well as further examine the role of etv5a in MCC development, we performed rescue experiments for each of the two MOs. Co-injection of either etv5a MO or etv5a MO2 with etv5a cRNA was able to partially rescue the incidence of MCC formation within the pronephros tubule (Fig. 3B), where quantifications revealed that an average of approximately 35 MCCs were formed (Fig. 3D). This partial rescue was significant, where MCC number was reduced by ~22% rather than the ~33% reduction observed in etv5a morphants (Fig. 3D). These results suggest that our morpholinos specifically target etv5a. Full rescue of the etv5a knockdown phenotype was precluded by developmental delay and toxicity when with higher cRNA dosages were microinjected (data not shown).
Additionally, we also conducted etv5a overexpression experiments to explore whether elevation of etv5a transcripts was sufficient to induce elevated numbers of MCCs within the renal progenitors. In WT embryos injected at various doses (220, 300, 400, 500 pg/nL) with cRNA encoding WT etv5a, we did not observe a significant change in odf3b expression or average MCC number when compared to the uninjected siblings (Fig. 3B, 3D). Together with the loss of function data, these results suggest that etv5a is required for MCC development, but that etv5a is not sufficient independently to promote MCC fate.
Redundancy between etv5a and etv4 during MCC formation in the zebrafish pronephros
Previous studies about the roles of ETS transcription factors during zebrafish ontogeny have demonstrated that the closely related etv5a and etv4 family members have overlapping functions in a number of tissues (Znosko, et al., 2010). Our discovery that etv5a deficiency was associated with a partial decline in MCC numbers within the pronephros, corresponding to an approximate 33% reduction, suggests that another factor(s) are involved in promoting MCC fate choice. We hypothesized that etv4 was a possible candidate for regulating MCC development along with etv5a given its broad expression pattern in the posterior mesoderm during somitogenesis stages (Brown, et al., 1998; Münchberg, et al., 1999; Roehl and Nüsslein-Volhard, 2001; Thisse and Thisse, 2004; data not shown).
To test whether etv4 deficiency affected MCC formation, we injected one-cell WT embryos with either a splice-blocking etv4 MO (Mao, et al., 2009), that we found generated a misspliced etv4 transcript that encoded a truncated peptide (Fig. S5), or a start-site blocking etv4 MO2 (Znosko, et al., 2010). MCC formation was then assessed in control embryos and etv4 morphants by WISH using the specific marker odf3b (Fig. 4A). Compared to WTs, etv4 deficient embryos had significantly reduced MCC numbers (Fig. 4A, 4B; data not shown). This reduction was similar to that observed with etv5a knockdown, in which there were approximately 33% fewer MCCs within the pronephros (Fig. 4A, 4B; data not shown).
Figure 4. Redundancy between etv5a and etv4 in MCC formation.

(A) In embryos injected with either etv5a MO, etv4 MO, or a combination of etv5a MO and etv4 MO, there is reduced expression of odf3b (purple), where the greatest loss appears in the absence of both etv5a and etv4 transcripts. (B) A significant decrease in average MCC number results in the loss of etv5a, as well as the loss of etv4. Injection of etv5a and etv4 together caused a greater decrease in the average number of MCCs. Representative images are shown for the quantified groups (n>50 for each), and standard error is depicted by the error bars. P-values: *****p<0.001, ****p<0.002
Given these findings, we next assessed the combined loss of function phenotype of etv5a and etv4 during MCC development. Dual knockdown of etv5a and etv4 led to a severe reduction in MCC numbers, with an average total of approximately 15 MCCs within the pronephros, or a ~66% loss of MCCs compared to WT controls (Fig. 4A, 4B; data not shown). Taken together, these data indicate that etv5a and etv4 are both required for normal MCC development during nephrogenesis. Further, as etv5a and etv4 are related members of the Pea3 subfamily, which have been shown to share promoter targets in other contexts, these findings may suggest that etv5a/4 occupy redundant, overlapping roles in MCC formation as well.
RA acts upstream of etv5a to promote MCC fate
Because we determined that etv5a is required for MCC formation, we were next interested to see where etv5a fit into the known MCC developmental pathway. Previous research has demonstrated that RA promotes MCC fate, where the either reduction or blockade of RA synthesis leads to the reduction or abrogation of MCC formation in the pronephros, respectively (Li, et al., 2014). Further, elevation of RA levels is sufficient to increase the MCC number and domain size during nephrogenesis (Li, et al., 2014). These observations support a model in which RA is an early-acting regulator of MCC fate (Li, et al., 2014). At present, the molecular mechanism(s) by which RA regulates MCC formation remain unknown. However, RA is postulated to entail direct or indirect interaction on MCC target genes that include the transcription factor mecom, whose activity regulates Notch signaling to restrict MCC number in the pronephros (Li, et al., 2014).
To examine the epistatic relationship between RA and etv5a, we utilized chemical genetics (Wingert, et al., 2007). Either exogenous RA at a concentration of 1 × 10⁻⁷ M or the small molecule RA biosynthesis inhibitor DEAB at a concentration of 1.6 × 10⁻⁵ M was added to WT and etv5a MO injected embryos at 60% epiboly, and embryos were raised to the 24 hpf stage for expression studies. Compared to WTs, RA-treated embryos possessed a significantly expanded etv5a domain (Fig. 5A, 5B). This suggests that RA positively regulates etv5a. Consistent with this interpretation, embryos treated with DEAB displayed an abrogation of etv5a expression in the pronephros (Fig. 5A). In sum, these experiments suggest that RA signaling promotes etv5a expression and is requisite for etv5a expression in renal progenitors during nephrogenesis.
Figure 5. RA signaling acts upstream of etv5a to promote MCC fate.

(A) WISH analysis on 24 hpf embryos demonstrates an increased etv5a expression domain after treatment with exogenous retinoic acid (+RA). Conversely, treatment with the pan-RA inhibitor DEAB completely ablates etv5a expression in the pronephros. Insets show a magnified view of the pronephros, where black bars denote the etv5a domain. (B) Exogenous RA significantly increased average etv5a length (μm) in the pronephros, but etv5a expression is lost after DEAB treatment. (C) Exogenous RA increases odf3b expression in both control and etv5a morphant embryos (etv5a MO), however etv5a morphants still appear to have a reduction of odf3b transcripts when compared to control siblings analyzed by WISH. odf3b expression is greatly reduced in both control and etv5a morphant embryos treated with DEAB. A magnified lateral (top) and dorsal (bottom) view of the odf3b domain is presented in the insets. (D) Quantification shows a significant increase of average MCC density/somite in etv5a morphants + RA compared to etv5a morphants, and that treatment with RA rescues average MCC density in etv5a morphants to the control value. Morphants treated with DEAB have a significantly lower MCC density/nephron* than control embryos treated with DEAB. At least 50 embryos were analyzed for each treatment, and the error bars represent standard error. P-values: *****p<0.001
Similarly, the MCC domain as marked by odf3b was also expanded in etv5a morphants treated with RA, and was dramatically reduced in DEAB treated embryos (Fig. 5C, 5D). Although RA-treated morphants had reduced odf3b expression via WISH when compared to control RA-treated siblings (Fig. 5C), exogenous RA did rescue morphant MCC density to the control value (Fig. 5D). These data suggest that etv5a responds to RA signaling, but that etv5a is just one target of RA in MCC development.
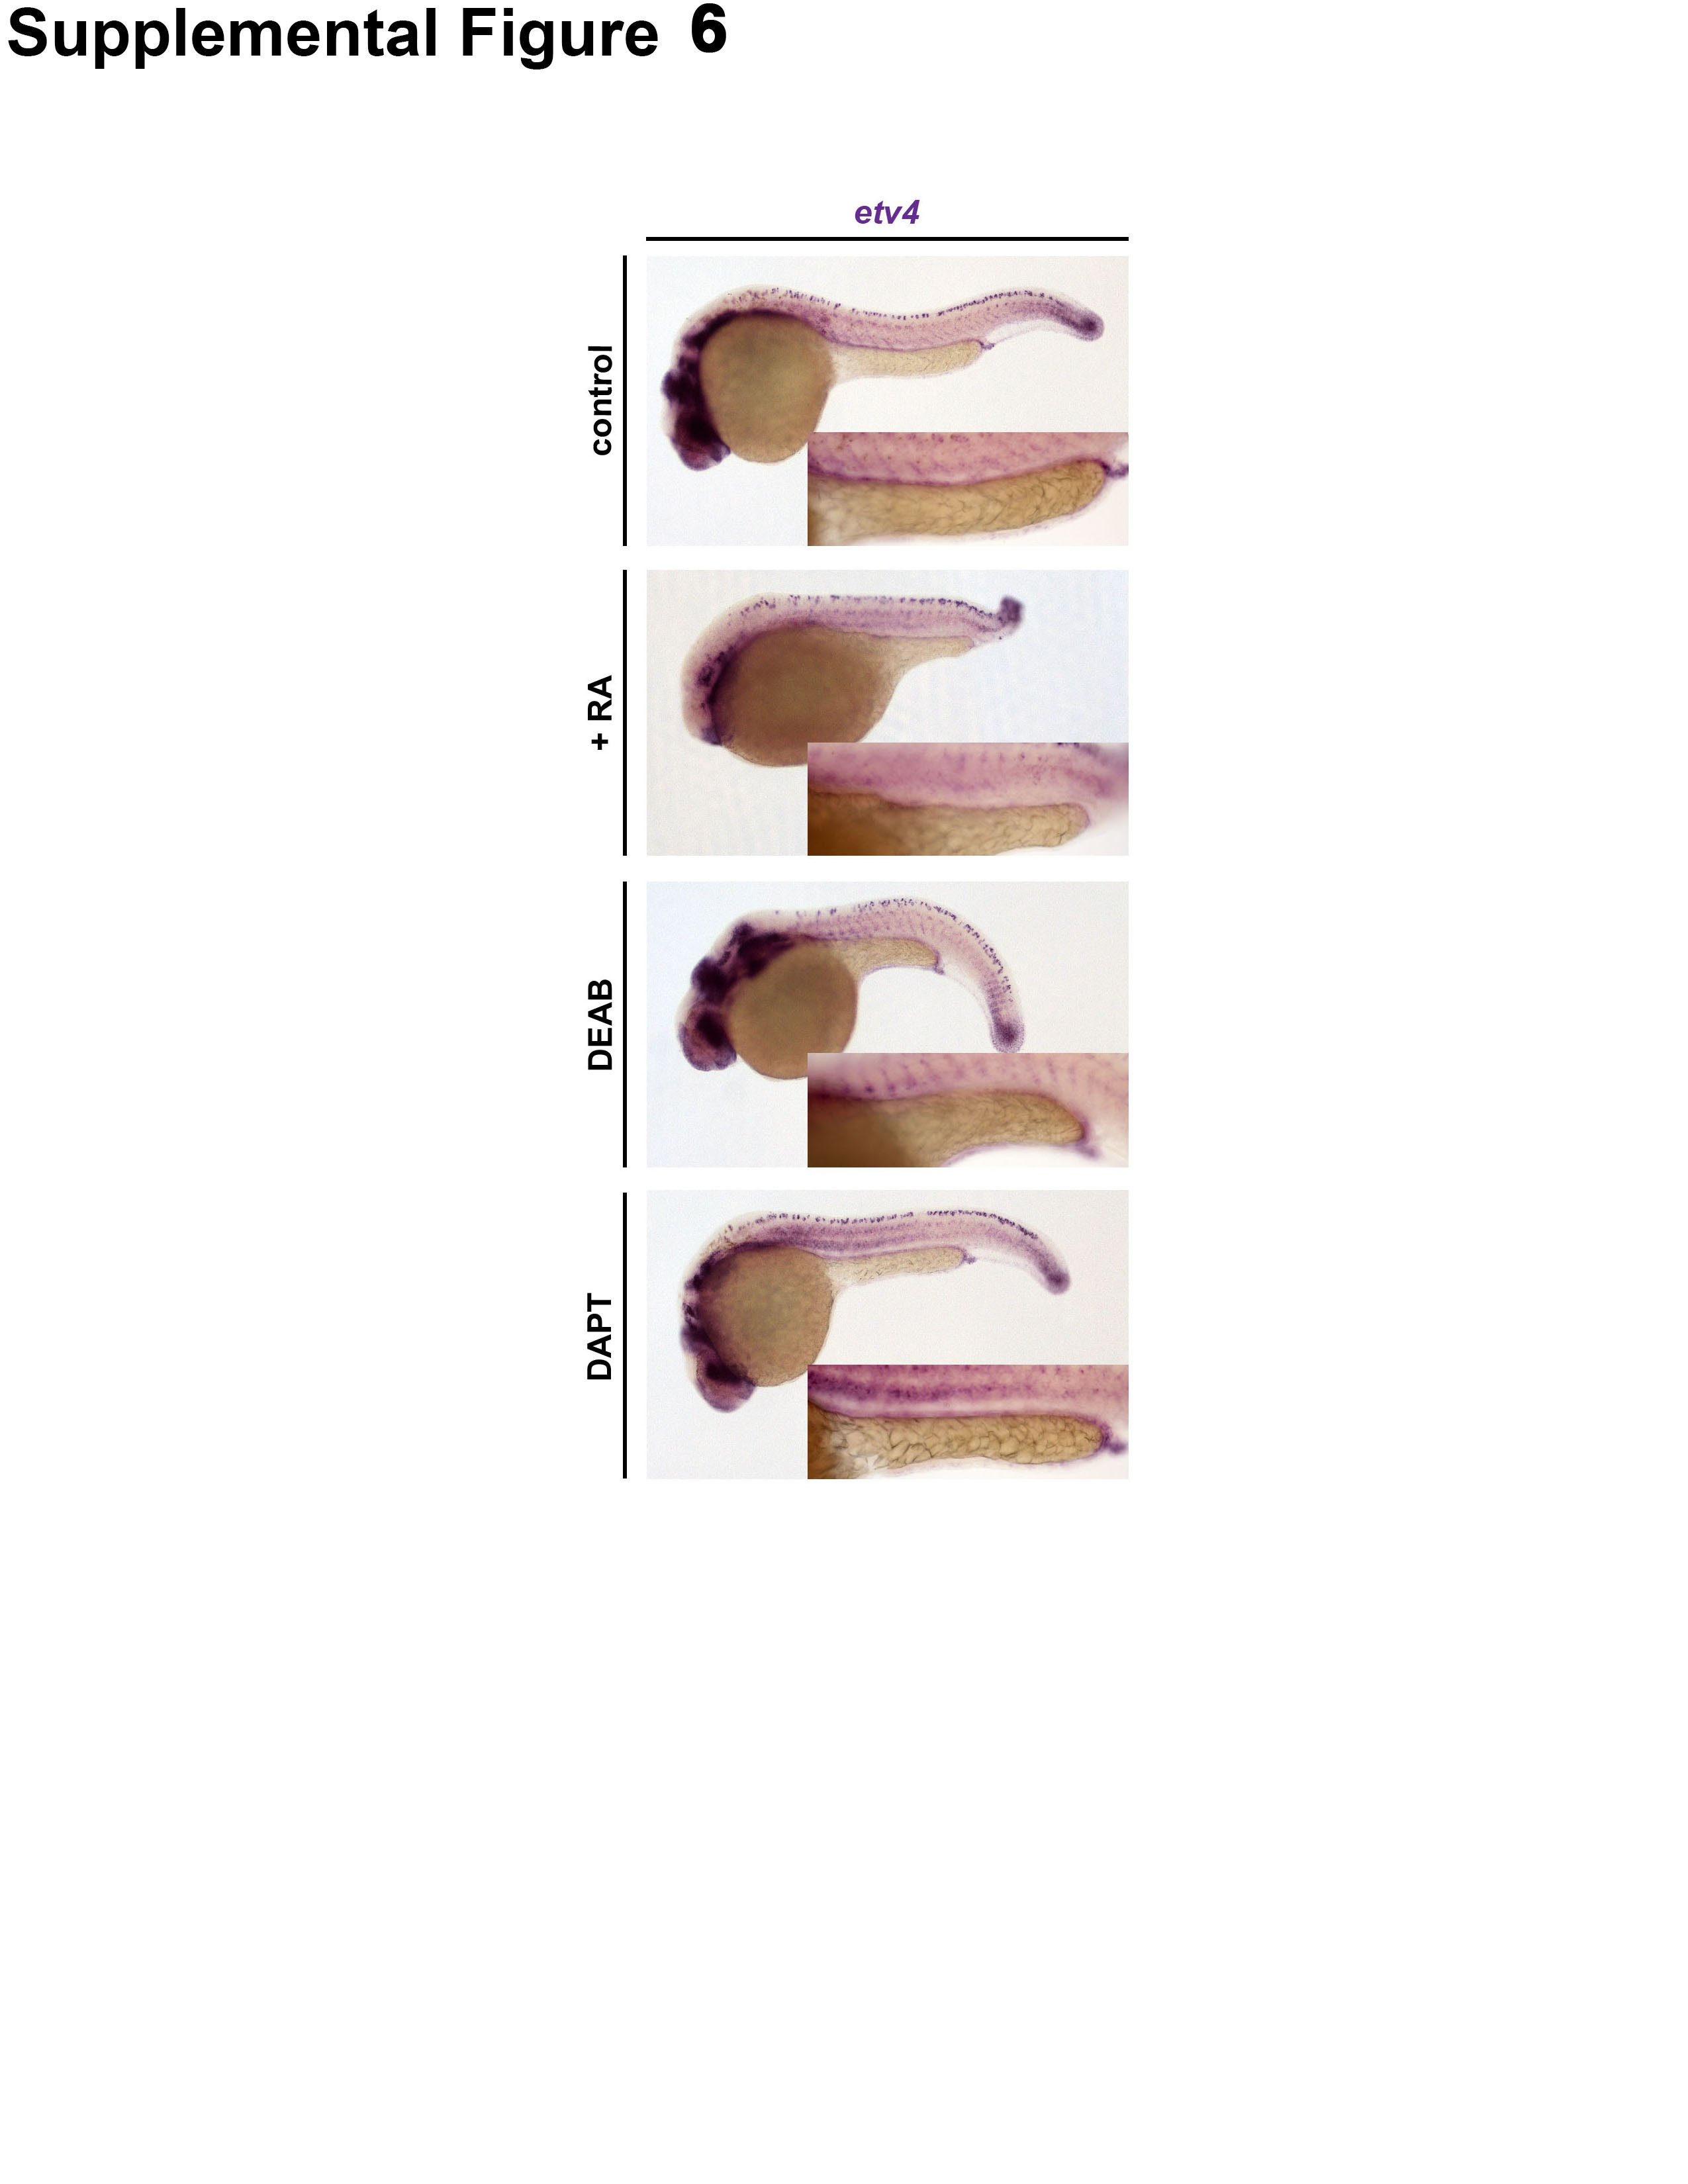
In addition, we explored whether the expression pattern of etv4 is affected by alterations in RA levels. While etv4 displays a broad expression pattern in the posterior mesoderm during somitogenesis stages, which includes the somatic mesoderm and tailbud mesoderm, etv4 transcripts have not been detected explicitly in the renal progenitors that give rise to the pronephros through to the 24 hpf stage (Brown, et al., 1998; Münchberg, et al., 1999; Roehl and Nüsslein-Volhard, 2001; Thisse and Thisse, 2004; data not shown). We observed that WT embryos treated with exogenous RA (1 × 10⁻⁷ M) or the RA inhibitor DEAB (1.6 × 10⁻⁵ M) from 60% epiboly to the 24 hpf stage did not evince specific expression of etv4 in the pronephros, similar to controls (Fig. S6). Taken together, these observations suggest that etv4 likely acts non-cell autonomously to regulate MCC development, although it is also possible that etv4 transcripts are expressed at low levels within the renal progenitors that are not readily detectable by WISH above the level of background staining.
Notch signaling inhibits etv5a to restrict MCC development
In contrast to RA, Notch signaling promotes transportive cell identity by restricting MCC fate through a mechanism of lateral inhibition between neighboring renal progenitors in the pronephros (Liu, et al., 2007; Ma and Jiang, 2007). Further, Notch signaling was found to act downstream of RA to mitigate epithelial cell type development in the pronephros (Li, et al., 2014). Thus, we next sought to establish the relationship between etv5a and Notch during nephrogenesis.
To determine whether Notch inhibits etv5a, we treated WT embryos with DAPT, a small molecule gamma secretase inhibitor, from 90% epiboly to 24 hpf (Li, et al., 2014). The etv5a expression domain was expanded in DAPT-treated embryos compared to DMSO-treated control siblings (Fig. 6A). To quantify this phenotype and assess significance, we measured the etv5a domain length in WT controls and DAPT-treated embryos (Fig. 6B). We found that Notch inhibition was accompanied by a significant increase in etv5a domain length compared to WT (Fig. 6B), suggesting that one role of Notch signaling is to restrict the etv5a domain.
Figure 6. Notch signaling acts upstream to inhibit etv5a and restrict MCC fate.

(A) WISH staining demonstrates expanded etv5a and odf3b domains after treatment with the Notch-inhibitor DAPT. A magnified lateral view of the etv5a domain with expression denoted by the black bars can be seen in the insets. odf3b domain is shown both laterally (top) and dorsally (bottom) in the insets. (B) Quantification of etv5a expression length (μm) in the pronephros shows a significant increase in DAPT-treated embryos. (C) MCC density is significantly increased in control and etv5a morphants (etv5a MO) both treated with DAPT, however there is still a significant difference in MCC density between DAPT and etv5a MO + DAPT embryos. Error bars represent standard error. P-values: *****p<0.001; **p<0.10
Given these findings, we also examined whether inhibition of Notch signaling had any effects on the expression levels of etv4 within the pronephros. Compared to WT controls, however, DAPT-treated embryos displayed no changes in etv4 expression at the 24 hpf stage (Fig. S6). This is similar to our previous findings that altered RA levels did not lead to changes in etv4 transcripts within the pronephros (Fig. S6). In sum, these observations indicate that many further studies are needed to address the complexities as to how etv4 expression is regulated to control MCC fate choice among renal progenitors.
Finally, to further investigate the interaction between Notch and etv5a in MCC development, we treated etv5a morphants with DAPT from 90% epiboly to 24 hpf. Similar to the etv5a domain, DAPT-treated morphants had an expanded odf3b domain (Fig. 6A). Although etv5a morphants treated with DAPT had a MCC density that surpassed both the untreated morphants and control, Notch inhibition could not increase MCC density in the morphants at the same level seen in the DAPT-treated controls (Fig. 6C). These data further support that etv5a is required to promote MCC fate, but that it is not the only factor in the developmental pathway.
DISCUSSION
Identification of the mechanisms that influence fate decisions of renal progenitors has broad implications for understanding the processes of kidney development and regeneration (McCampbell and Wingert, 2014). Herein, we have described novel roles for etv5a and etv4 in mediating MCC fate during zebrafish nephrogenesis, thus adding several new aspects to the known genetic pathways that regulate MCC development in the pronephros (Fig. 7).
Figure 7. Working model of etv5a AND etv4 function in MCC patterning during nephrogenesis.

Interplay between retinoic acid (RA), etv5a, and Notch signaling in the renal progenitor field mediates multiciliated cell (MCC) formation during nephrogenesis. etv5a responds downstream of RA signaling to promote MCC fate, although it is likely that etv5a is not the only target of RA in this pathway. Conversely, Notch signaling inhibits etv5a activity to restrict MCC formation and favor transportive cell identity. In addition, etv4 promotes MCC fate, although it is not resolved if etv4 acts within renal progenitors or neighboring tissues, and whether other known MCC specification factors impact etv4 in other embryonic locales to affect pronephros development. Abbreviations: P (podocyte), N (neck), PCT (proximal convoluted tubule), PST (proximal straight tubule), DE (distal early), CS (corpuscle of Stannius), DL (distal late), PD (pronephric duct), C (cloaca).
Firstly, the presence of etv5a transcripts in renal progenitors, followed by correlative expression domains of etv5a and odf3b in the developing tubule through the 24 hpf stage, led us to hypothesize that etv5a is involved in MCC patterning. The data presented here establishes the relationship between etv5a and several key MCC signals, and are consistent with a model in which etv5a is a target of RA to promote MCC fate, while Notch signaling restricts etv5a to limit MCC identity (Fig. 7). Indeed, both exogenous RA and Notch inhibition are able to restore MCC density in etv5a morphants. Interestingly, the loss of etv5a resulted in a ~33% reduction of MCC number, similar in magnitude to its related family member etv4, a gene expressed broadly in the posterior mesoderm (Thisse and Thisse, 2004; data not shown). Further, dual etv5a/4 deficiency led to a more severe 66% reduction in MCC formation. These findings suggest that both etv genes are required to promote MCC development (Fig. 7), though whether they participate in a common pathway or represent distinct pathways will require additional studies to resolve.
Intriguingly, our present data suggests the possibility that etv4 may serve non-cell autonomous roles that impact MCC fate choice in the kidney. Based on the explorations of RA and Notch signaling reported herein, it remains unresolved whether the activities of these pathways regulate etv4 in tissue(s) that are relevant to pronephros development. Many more studies are needed to assay when changes in etv4 activity affect renal progenitors, and which tissue(s) are involved. A clear limitation on our work is the reliance on the detection of transcripts by WISH, which may have alternatively limited the ability to resolve etv4 expression changes within renal progenitors, and thus future work with detection of transcripts using signal amplification is likely to be useful in addressing this aspect further.
By comparison, it is reasonable to hypothesize that Etv5a likely acts within MCC precursors, given the striking expression pattern of its gene transcripts in renal progenitors. The observation that the overexpression of etv5a alone was insufficient to increase MCC numbers, however, supports the additional conclusion that other factors contribute to the developmental pathway mediating epithelial cell fate within the nephron tubule. However, more studies are needed to discern other possible players in the MCC pathway. Continued analysis of etv5a/4 and other relevant genes during zebrafish renal development will greatly benefit from mutant models created through genome editing. While our morpholino experiments are supported by an assortment of controls including analysis of changes in transcript splicing, rescues, and dominant-negative studies, the ability to analyze compound deficiencies is limited by toxicity of complex cocktails of microinjection reagents. Thus, mutant models will enable these constraints to be overcome in several regards in future studies.
In addition, while etv5a deficiency led to fewer MCCs, further physiological studies are needed to determine whether alterations in fluid balance in these embryos are impacted due to the overall reduction in pronephros MCC number. Based on the reduced MCC number observed in the present studies, and the prior observations of vascular defects in the context of etv5a deficiency (Chen, et al., 2013), we favor the hypothesis that overall fluid homeostasis is disrupted due to a complex interplay of defects stemming from multiple tissue alterations. Studies examining tissue-specific abrogation of etv5a would be necessary to begin to distinguish individual organ contributions to fluid imbalance during embryogenesis. Nevertheless, future studies to examine the role of etv5a in mechanisms of MCC differentiation and functionality are also valuable, as they could provide further insights into the pathways that regulate ciliogenesis, for example.
MCCs and their roles in diverse animal tissues
Diverse tissues within the vertebrate body contain MCCs, however, the genetic mechanisms that control MCC formation remain only partly understood, making them a fascinating area of research (Brooks and Wallingford, 2014). For example, in mammals MCCs line the airway epithelium where they drive the fluid movement of mucus (Wanner, et al., 1996), and MCCs are also located in the brain, on the surface that lines the ventricle where they propel cerebrospinal fluid (Worthington and Cathcart, 1963). Given these locations, MCCs have been challenging to study, though a useful model has been the Xenopus epidermis (Nokhbatolfoghahai, et al., 2005), which has facilitated live imaging of MCCs (Werner and Mitchell, 2012).
MCCs are also known to exist in the kidney of many species, documented based on the appearance of cells with cilia displaying a 9+2 microtubule pattern. Motile cilia are found in the excretory systems of many lower vertebrates, such as planarians, where they are essential to drive fluid flow into and through the tubules (Vu, et al., 2015). In the hagfish, classified today as an elementary vertebrate, the proximal nephron tubule contains epithelial cells with the 9+2 pattern (Fawcett and Porter, 1954). Among vertebrate species, the elasmobranch known as the spiny dogfish possesses cells with numerous cilia in the collecting ducts (Lacy, et al., 1989). In contrast, in the adult human kidney, MCCs have not been described to exist during healthy conditions but have been noted in biopsies obtained from patients with an assortment of pathological renal conditions, ranging from those with various forms of the nephrotic syndrome or hypercalcemia, for example (Datsis and Bowman, 1974; Duffy and Suzuki, 1968; Hassan and Subramanyan, 1995; Katz and Morgan, 1984; Ong and Wagner, 2005). These observations suggest that understanding the mechanisms of MCC formation is likely to be relevant to clinical aspects of renal disease. However, a role for MCCs during kidney development may exist, as histological studies have observed multiple cilia in the metanephric tubules of human fetus samples (Katz and Morgan, 1984; Zimmerman, 1971). Interestingly, there has been speculation that the absence of MCCs in higher vertebrates, including both mammals and birds, coincides with an elevation in blood pressure that made the fluid flow role of MCCs unnecessary and led to their evolutionary loss (Marshall, 1934; Vu, et al., 2015).
The zebrafish pronephros provides a genetic model to study MCC development in renal tissue, as MCCs can be readily observed unlike the challenges of MCC visualization within analogous internally located vertebrate organs. A growing list of zebrafish studies has identified genetic regulators of MCC formation, ranging from transcription factors like mecom (Li, et al., 2014) to microRNAs. Regarding the latter, recent studies have demonstrated that miR-34b is enriched in MCCs of the zebrafish pronephros as well as in other organs (Wang, et al., 2013). In their study, the data suggest that miR-34b acts through v-myb avian myeloblastosis viral oncogene homolog (myb) to promote multiciliogenesis, a pathway that when impaired led to defects in the formation of cilia bundles (Wang, et al., 2013). At present, it remains unclear if etv5a interacts with mecom, miR-34b or myb to promote MCC identity in the pronephros.
Mechanisms of etv5a/4 regulation and function during zebrafish pronephros patterning
As described previously, in the zebrafish, etv5a belongs to the ETS transcription factor family, which also includes closely related etv5b and etv4 (Kudoh, et al., 2001; Roussigne and Blader, 2006; Znosko, et al., 2010). Zebrafish etv5b shares about 70% homology with its paralog etv5a, though sequence and syntenic analyses suggest that etv5a is more similar to other vertebrate Erm/Etv5 genes and therefore is held to be orthologous to mammalian Etv5 (Chen, et al., 2013). Expression of etv5b during embryogenesis has been documented in numerous embryonic tissues, of which include the neural plate, developing central nervous system, and gut; however, etv5b has not been documented in the pronephros (Münchberg, et al., 1999; Roehl and Nüsslein-Volhard, 2001; Thisse, et al., 2001). Similarly, etv4 is expressed broadly during early somitogenesis throughout the trunk mesoderm, and at later stages high transcript levels are localized to the paraxial mesoderm, notochord, pancreas, and pectoral fin buds (Brown, et al., 1998; Münchberg, et al., 1999; Thisse and Thisse, 2004). In previous zebrafish studies, etv5a loss of function in combination with other ETS family members resulted in more severe phenotypes than etv5a knockdown alone (Znosko, et al., 2010), similar to our findings in the present work with etv5a and etv4. Whether etv5b also has redundant activities in the pronephros to mediate MCC formation remains to be determined. Thus, future studies are needed to explore if multiple ETS transcription factors are relevant to MCC pattern formation and to elucidate functional redundancies or specializations.
There is also rich evidence that etv5a and its family members are downstream of FGF signaling in a myriad of tissues (Raible and Brand, 2001; Roehl and Nüsslein-Volhard, 2001; Mao, et al., 2009; Znosko, et al., 2010; Little and McMahon, 2012; Janesick, et al., 2013). In particular, research has demonstrated that etv5b and etv4 expression is completely lost after treatment with a pan-FGF inhibitor SU5402 (Roehl and Nüsslein-Volhard, 2001). Additionally, a more recent zebrafish study demonstrated that ETS transcription factors respond to both RA and targets of FGF signaling (Janesick, et al., 2013). Therefore, how FGF signaling impacts etv5a, etv4 and MCC formation will be important to investigate in future studies as well.
Finally, research has shown that Notch signaling restricts MCC fate through lateral inhibition and the transcription factor mecom (Liu, et al., 2007; Ma and Jiang, 2007; Li, et al., 2014). Previous studies have shown that mecom acts as a regulator of both nephron segmentation patterning and MCC development (Li, et al., 2014). The data presented in this paper allows us to hypothesize that there may be an interaction between etv5a and mecom, however it is unclear if this is direct or through Notch. It will be interesting to determine the relationship between these factors and to elucidate how/if their combined activity promotes MCC fate at a molecular level. One potential mechanism might entail the regulation of transcription factors known to be involved in ciliogenesis, such as forkhead box J1a (foxj1a) or regulatory factor X, 2 (rfx2) (Znosko, et al., 2010).
The Etv5 and Etv4 transcription factors in the mammalian kidney
Both Etv5 and Etv4 impact ureteric bud formation during murine metanephric kidney formation (Lu, et al., 2009; Kurre, et al., 2010; Costantini and Kopan, 2010; Little and McMahon, 2012). Interestingly, studies in the mouse have revealed that Etv5 and Etv4 are expressed in both the ureteric bud tip cells and the metanephric mesenchyme, and that these genes are jointly essential for kidney development. While individual knockouts of these genes did not disrupt renal ontogeny, mice with combined genetic deficiency of these Etv factors have severe defects. Namely, Etv4−/− and Etv5+/− compound mutants show renal agenesis and/or dysplasia, and double homozygote mutants fail to develop kidneys altogether (Lu, et al., 2009; Kurre, et al., 2010). Through a series of studies including metanephric organ culture, Etv4−/− and Etv5+/− compound mutant kidneys were found to undergo reduced ureteric bud branching, revealing that these genes are essential for normal branching morphogenesis (Lu, et al., 2009). However, the functional role(s), if any, of these Etv factors in nephron patterning have not been addressed.
Interestingly, researchers of the genitourinary developmental molecular anatomy project (GUDMAP) consortium have annotated the expression of both Etv5 and Etv4 within the developing mouse metanephric nephrons. There, Etv5 transcripts mark nephrons at the S-shaped body stage, or early nephron, and Etv4 expression has been annotated in the renal vesicle, comma and S-shaped nephron. These observations raise the possibility that these ETS transcription factors may have functions during mammalian nephrogenesis. It will be intriguing to ascertain such roles, as they could potentially entail the processes of epithelial cell fate decisions and/or ciliogenesis, and may impact our understanding of congenital kidney defects, such as CAKUT or other kidney diseases.
Supplementary Material
- zebrafish renal progenitors show regionalized etv5a expression in multiciliated cell precursors
- etv5a deficiency leads to reduced MCC formation that can be rescued by etv5a overexpression
- etv4 deficiency leads to reduced MCC formation and etv5a/4 knockdown leads to a dramatic reduction in MCC number
- retinoic acid signaling positively regulates etv5a expression during MCC formation
- Notch signaling negatively regulates etv5a expression during MCC formation
ACKNOWLEDGEMENTS
This work was supported in part by the following grants to RAW: DP2OD008470, R01DK100237. Additionally, the work of ANM was supported in part by the National Science Foundation Graduate Research Fellowship Program under grant number DGE-1313583. This study used data from the GUDMAP database http://www.gudmap.org about Etv5 [GUDMAP Entry: 15455, Accessed 07/2015, Contributed by G. Eichele and L. Geffers, Submitted by C. Kauck), and about Etv4 [GUDMAP Entry: 12534, Accessed 12/2015, Contributed by K. Georgas, B. Rumballe, H.S. Chiu, D. Tang, M.T. Valerius, J. Yu, A.P. McMahon, M. Little, Submited by K. Georgas]. We are grateful to the Gallagher Family for their generous gift to the University of Notre Dame to support of stem cell research. The funders had no role in the study design, data collection and analysis, decision to publish, or manuscript preparation. We thank the staffs of the Department of Biological Sciences and the Center for Zebrafish Research at the University of Notre Dame for their care of our zebrafish aquarium. Finally, we thank the members of our wonderful lab for their support, discussions, and insights about this work.
Abbreviations
- C
cloaca
- CAKUT
congenital and acquired diseases of the urinary tract
- cetn4
centrin 4
- cRNA
capped RNA
- CS
corpuscle of Stannius
- DAPT
N-[N-(3,5-difluorophenacetyl)-L-alanyl]-S-phenylglycine t-butyl ester
- DE
distal early
- DEAB
4-diethylaminobenzaldehyde
- DL
distal late
- ETS
E26 transformation-specific
- etv4
ets variant 4
- etv5a
ets variant 5a
- etv5b
ets variant 5b
- FISH
fluorescent in situ hybridization
- hpf
hours post fertilization
- IF
immunofluorescence
- IM
intermediate mesoderm
- MCC
multiciliated cell
- MO
morpholino
- N
neck
- odf3b
outer dense fiber of sperm tails 3b
- ORF
open reading frame
- P
podocyte
- polyomavirus enhancer activator 3
Pea3
- PCT
proximal convoluted tubule
- PD
pronephric duct
- PST
proximal straight tubule
- RA
retinoic acid
- ss
somite stage
- WISH
whole-mount in situ hybridization
- WT
wild-type
Footnotes
Publisher's Disclaimer: This is a PDF file of an unedited manuscript that has been accepted for publication. As a service to our customers we are providing this early version of the manuscript. The manuscript will undergo copyediting, typesetting, and review of the resulting proof before it is published in its final citable form. Please note that during the production process errors may be discovered which could affect the content, and all legal disclaimers that apply to the journal pertain.
REFERENCES
- Akagi T, Kuure S, Uranishi K, Koide H, Koide H, Costantini F, Yokota T. ETS-related transcription factors ETV4 and ETV5 are involved in proliferation and induction of differentiation-associated genes in embryonic stem (ES) cells. J Biol Chem. 2015;290(37):22460–22473. doi: 10.1074/jbc.M115.675595. [DOI] [PMC free article] [PubMed] [Google Scholar]
- Anzenberger U, Bit-Avragim N, Rohr S, et al. Elucidation of megalin/LRP2-dependent endocytic transport processes in the larval zebrafish pronephros. J Cell Sci. 2006;119:2127–2137. doi: 10.1242/jcs.02954. [DOI] [PubMed] [Google Scholar]
- Brend T, Holley SA. Zebrafish whole mount high-resolution double fluorescent in situ hybridization. J Vis Exp. 2009;25:1229. doi: 10.3791/1229. [DOI] [PMC free article] [PubMed] [Google Scholar]
- Brooks ER, Wallingford JB. Multiciliated cells. Curr Biol. 2014;24:R973–R982. doi: 10.1016/j.cub.2014.08.047. [DOI] [PMC free article] [PubMed] [Google Scholar]
- Brown LA, Amores A, Schilling TF, et al. Molecular characterization of the zebrafish PEA3 ETS-domain transcription factor. Oncogene. 1998;17:93–104. doi: 10.1038/sj.onc.1201911. [DOI] [PubMed] [Google Scholar]
- Center for Disease Control and Prevention National Chronic Kidney Disease Fact Sheet: general information and national estimates on chronic kidney disease in the United States. 2014 Available from: URL: http://www.cdc.gov/diabetes/pubs/factsheets/kidney.htm.
- Chen SY, Shih HY, Lin SJ, et al. Etv5a regulates the proliferation of ventral mesoderm cells and the formation of hemato-vascular derivatives. J Cell Sci. 2013;126(Pt 24):5626–5634. doi: 10.1242/jcs.132613. [DOI] [PubMed] [Google Scholar]
- Cheng CN, Li Y, Marra AN, et al. Flat mount preparation for observation and analysis of zebrafish embryo specimens stained by whole mount in situ hybridization. J Vis Exp. 2014;89:51604. doi: 10.3791/51604. [DOI] [PMC free article] [PubMed] [Google Scholar]
- Cheng CN, Wingert RA. Chapter 9: Renal system development in the zebrafish: a basic nephrogenesis model. In: Carver E, Lessman C, editors. Zebrafish: Topics in Reproduction & Development. Nova Scientific Publishers; 2014. pp. 179–214. [Google Scholar]
- Cheng CN, Wingert RA. Nephron proximal tubule patterning and corpuscles of Stannius formation are regulated by the sim1a transcription factor and retinoic acid in zebrafish. Dev Biol. 2015;399:100–116. doi: 10.1016/j.ydbio.2014.12.020. [DOI] [PMC free article] [PubMed] [Google Scholar]
- Cheng CN, Verdun VA, Wingert RA. Recent advances in elucidating the genetic mechanisms of nephrogenesis using zebrafish. Cells. 2015;4:218–233. doi: 10.3390/cells4020218. [DOI] [PMC free article] [PubMed] [Google Scholar]
- Costantini F. GDNF/Ret signaling and renal branching morphogenesis: from mesenchymal signals to epithelial cell behaviors. Organogenesis. 2010;6(4):252–62. doi: 10.4161/org.6.4.12680. [DOI] [PMC free article] [PubMed] [Google Scholar]
- Costantini F, Kopan R. Patterning a complex organ: branching morphogenesis and nephron segementation in kidney development. Dev Cell. 2010;18(5):698–712. doi: 10.1016/j.devcel.2010.04.008. [DOI] [PMC free article] [PubMed] [Google Scholar]
- Datsis SA, Bowman IA. Ciliated renal tubular epithelium in congenital nephrosis. Beitr Pathol. 1974;151:297–303. doi: 10.1016/s0005-8165(74)80006-5. [DOI] [PubMed] [Google Scholar]
- Desgrange A, Cereghini S. Nephron patterning: lessons from Xenopus, zebrafish and mouse studies. Cells. 2015;4:483–499. doi: 10.3390/cells4030483. [DOI] [PMC free article] [PubMed] [Google Scholar]
- Dittmer J, Nordheim A. Ets transcription factors and human disease. Biochim Biophys Acta. 1998;1377:F1–F11. doi: 10.1016/s0304-419x(97)00039-5. [DOI] [PubMed] [Google Scholar]
- Dressler GR. The cellular basis of kidney development. Annu Rev Cell Dev Biol. 2006;22:509–529. doi: 10.1146/annurev.cellbio.22.010305.104340. [DOI] [PubMed] [Google Scholar]
- Dooley KA, Fraenkel P, Langer NB, et al. Tübingen 2000 screen consortium. Exp Hematol. 2008;36:1132–1142. doi: 10.1016/j.exphem.2008.04.008. [DOI] [PMC free article] [PubMed] [Google Scholar]
- dos Santos Junior AC, de Miranda DM, Simões e Silva AC. Congenital anomalies of the kidney and urinary tract: an embryogenetic review. Birth Defects Res C Embryo Today. 2014;102(4):374–81. doi: 10.1002/bdrc.21084. [DOI] [PubMed] [Google Scholar]
- Drummond IA. Kidney development and disease in the zebrafish. J Am Soc Nephrol. 2005;16:299–304. doi: 10.1681/ASN.2004090754. [DOI] [PubMed] [Google Scholar]
- Duffy JL, Suzuki Y. Ciliated human renal proximal tubular cells. Observations in three cases of hypercalcemia. Am J Pathol. 1968;53:609–616. [PMC free article] [PubMed] [Google Scholar]
- Ebarasi L, Oddsson A, Hultenby K, et al. Zebrafish: a model system for the study of vertebrate renal development, function, and pathophysiology. Curr Opin Nephrol Hypertens. 2011;20(4):416–24. doi: 10.1097/MNH.0b013e3283477797. [DOI] [PubMed] [Google Scholar]
- Eo J, Han K, Murphy KM, Song H, Lim HJ. Etv5, an ETS transcription factor, is expressed in granulosa and cumulus cells and serves as a transcriptional regulator of the cyclooxygenase-2. J Endocrinol. 2008;198:281–290. doi: 10.1677/JOE-08-0142. [DOI] [PubMed] [Google Scholar]
- Fawcett DW, Porter KR. A study of the final structure of ciliated epithelia. J Morphol. 1954;94:221–281. [Google Scholar]
- Fraenkel P, Gibert Y, Holzheimer JL, et al. Transferrin-a modulates hepcidin expression in zebrafish embryos. Blood. 2009;113:2843–2850. doi: 10.1182/blood-2008-06-165340. [DOI] [PMC free article] [PubMed] [Google Scholar]
- Galloway JL, Wingert RA, Thisse C, et al. Combinatorial regulation of novel erythroid gene expression in zebrafish. Exp Hematol. 2008;36:424–432. doi: 10.1016/j.exphem.2007.11.015. [DOI] [PMC free article] [PubMed] [Google Scholar]
- Gerlach GF, Wingert RA. Kidney organogenesis in the zebrafish: insights into vertebrate nephrogenesis and regeneration. WIREs Dev Biol. 2013;2:559–585. doi: 10.1002/wdev.92. [DOI] [PMC free article] [PubMed] [Google Scholar]
- Gerlach GF, Wingert RA. Zebrafish pronephros tubulogenesis and epithelial identity maintenance are reliant on the polarity proteins Prkc iota and zeta. Dev Biol. 2014;396:183–200. doi: 10.1016/j.ydbio.2014.08.038. [DOI] [PMC free article] [PubMed] [Google Scholar]
- Jaffe KM, Thiberge SY, Bisher ME, Burdine RD. Imaging cilia in zebrafish. Methods Cell Biol. 2010;97:415–35. doi: 10.1016/S0091-679X(10)97022-2. [DOI] [PubMed] [Google Scholar]
- Janesick A, Abbey R, Chung C, et al. ERF and ETV3L are retinoic acid-inducible repressors required for primary neurogenesis. Development. 2013;140:3095–3106. doi: 10.1242/dev.093716. [DOI] [PubMed] [Google Scholar]
- Hassan MO, Subramanyan S. Ciliated renal tubular cells in crescentic glomerulonephritis. Ultrastruct Pathol. 1995;19:201–203. doi: 10.3109/01913129509064222. [DOI] [PubMed] [Google Scholar]
- Katz SM, Morgan JJ. Cilia in the human kidney. Ultrastruct Pathol. 1984;6:285–294. doi: 10.3109/01913128409018587. [DOI] [PubMed] [Google Scholar]
- Kimmel CB, Ballard WW, Kimmel SR, et al. Stages of embryonic development of the zebrafish. Dev Dyn. 1995;203(3):253–310. doi: 10.1002/aja.1002030302. [DOI] [PubMed] [Google Scholar]
- Kobberup S, Nyeng P, Juhl K, et al. ETS-family genes in pancreatic development. Dev Dyn. 2007;236:3100–3110. doi: 10.1002/dvdy.21292. [DOI] [PubMed] [Google Scholar]
- Kramer-Zucker AG, Olale F, Haycraft CJ, Yoder BK, Schier AF, Drummond IA. Cilia-driven fluid flow in the zebrafish pronephros, brain and Kupffer's vesicle is required for normal organogenesis. Development. 2005;132:1907–1921. doi: 10.1242/dev.01772. [DOI] [PubMed] [Google Scholar]
- Kudoh T, Tsang M, Hukriede NA, et al. A gene expression screen in zebrafish embryogenesis. Genome Res. 2001;11:1979–1987. doi: 10.1101/gr.209601. [DOI] [PubMed] [Google Scholar]
- Kuure S, Chi X, Lu B, Costantini F. The transcription factors Etv4 and Etv5 mediate formation of the ureteric bud tip domain during kidney development. Development. 2010;137:1975–1979. doi: 10.1242/dev.051656. [DOI] [PMC free article] [PubMed] [Google Scholar]
- Lacy ER, Luciano L, Reale E. Flagellar cells and ciliary cells in the renal tubule of elasmobranchs. J Exp Zool Supp. 1989;2:186–192. doi: 10.1002/jez.1402520420. [DOI] [PubMed] [Google Scholar]
- Lengerke C, Wingert R, Beeretz M, Grauer M, Schmidt AG, Konantz M, Daley GQ, Davidson AJ. Interactions between Cdx genes and retinoic acid modulate early cardiogenesis. Dev Biol. 2011;163:134–142. doi: 10.1016/j.ydbio.2011.03.027. [DOI] [PMC free article] [PubMed] [Google Scholar]
- Li Y, Cheng CN, Verdun VA, Wingert RA. Zebrafish nephrogenesis is regulated by interactions between retinoic acid, mecom, and Notch signaling. Dev Biol. 2014;386(1):111–22. doi: 10.1016/j.ydbio.2013.11.021. [DOI] [PMC free article] [PubMed] [Google Scholar]
- Little MH, McMahon AP. Mammalian kidney development: principles, progress, and projections. Cold Spring Harb Perspect Biol. 2012;4:a008300. doi: 10.1101/cshperspect.a008300. [DOI] [PMC free article] [PubMed] [Google Scholar]
- Liu Y, Narendra P, Kramer-Zucker A, Drummond IA. Notch signaling controls the differentiation of transporting epithelia and multiciliated cells in the zebrafish pronephros. Development. 2007;134:1111–1122. doi: 10.1242/dev.02806. [DOI] [PubMed] [Google Scholar]
- Lu BC, Cebrian C, Chi X, et al. Etv4 and Etv5 are required downstream of GDNF and Ret for kidney branching morphogenesis. Nat Genet. 2009;41(12):1295–302. doi: 10.1038/ng.476. [DOI] [PMC free article] [PubMed] [Google Scholar]
- Ma M, Jiang YJ. Jagged2a-Notch signaling mediates cell fate choice in the zebrafish pronephric duct. PLoS Genet. 2007;3(1):e18. doi: 10.1371/journal.pgen.0030018. [DOI] [PMC free article] [PubMed] [Google Scholar]
- Mao J, McGlinn E, Huang P, et al. Fgf-dependent Etv4/5 activity is required for posterior restriction of sonic hedgehog and promoting outgrowth of the vertebrate limb. Dev Cell. 2009;16:600–606. doi: 10.1016/j.devcel.2009.02.005. [DOI] [PMC free article] [PubMed] [Google Scholar]
- Marra AN, Wingert RA. Roles of Iroquois transcription factors in kidney development. Cell Dev Biol. 2014;3:131. doi: 10.4172/2168-9296.1000131. [DOI] [PMC free article] [PubMed] [Google Scholar]
- Marshall EK., Jr. The comparative physiology of the kidney in relation to theories of renal secretion. Physiological Reviews. 1934;14:133–159. [Google Scholar]
- McCampbell KK, Wingert RA. New tides: using zebrafish to study renal regeneration. Transl Res. 2014;163:109–122. doi: 10.1016/j.trsl.2013.10.003. [DOI] [PMC free article] [PubMed] [Google Scholar]
- McKee R, Gerlach GF, Jou J, Cheng CN, Wingert RA. Temporal and spatial expression of tight junction genes during zebrafish pronephros development. Gene Expr Patterns. 2014;16:104–113. doi: 10.1016/j.gep.2014.11.001. [DOI] [PMC free article] [PubMed] [Google Scholar]
- Münchberg SR, Ober EA, Steinbeisser H. Expression of the Ets transcription factors erm and pea3 in early zebrafish development. Mech Dev. 1999;88:233–236. doi: 10.1016/s0925-4773(99)00179-3. [DOI] [PubMed] [Google Scholar]
- Naylor RW, Przepiorski A, Ren Q, Yu J, Davidson AJ. HNF1B is essential for nephron segmentation during nephrogenesis. J Am Soc Nephrol. 2013;24:77–87. doi: 10.1681/ASN.2012070756. [DOI] [PMC free article] [PubMed] [Google Scholar]
- Nokhbatolfoghahai M, Downie JR, Clelland AK, Rennison K. The surface ciliation of anuran amphibian embryos and early larvae: patterns, timing differences and functions. J Natural History. 2005;39:887–929. [Google Scholar]
- O'Brien LL, Grimaldi M, Kostun Z, Wingert RA, Selleck R, Davidson AJ. Wt1a, Foxc1a, and the Notch mediator Rbpj physically interact and regulate the formation of podocytes in zebrafish. Dev Biol. 2011;358:318–330. doi: 10.1016/j.ydbio.2011.08.005. [DOI] [PMC free article] [PubMed] [Google Scholar]
- Oh S, Shin S, Janknecht R. ETV1, 4, and 5: an oncogenic subfamily of ETS transcription factors. Biochim Biophys Acta. 2012;128:1–12. doi: 10.1016/j.bbcan.2012.02.002. [DOI] [PMC free article] [PubMed] [Google Scholar]
- Ong AC, Wagner B. Detection of proximal tubular motile cilia in a patient with renal sarcoidosis associated with hypercalcemia. Am J Kidney Dis. 2005;45:1096–1099. doi: 10.1053/j.ajkd.2005.02.019. [DOI] [PubMed] [Google Scholar]
- Raible F, Brand M. Tight transcriptional control of the ETS domain factors Erm and Pea3 by Fgf signaling during early zebrafish development. Mech Dev. 2001;107(1-2):105–17. doi: 10.1016/s0925-4773(01)00456-7. [DOI] [PubMed] [Google Scholar]
- Roehl H, Nüsslein-Volhard C. Zebrafish pea3 and erm are general targets of FGF8 signaling. Curr Biol. 2001;11(7):503–7. doi: 10.1016/s0960-9822(01)00143-9. [DOI] [PubMed] [Google Scholar]
- Roussigne M, Blader P. Divergence in regulation of the PEA3 family of ETS transcription factors. Gene Expr Patterns. 2006;6:777–782. doi: 10.1016/j.modgep.2006.01.008. [DOI] [PubMed] [Google Scholar]
- Saxen L. Organogenesis of the kidney. Cambridge University Press; Cambridge: 1987. [Google Scholar]
- Saran R, Li Y, Robinson B, et al. US Renal Data System 2014 annual data report: epidemiology of kidney disease in the United States. Am J Kidney Dis. 2015;66(1)(suppl 1):S1–S306. doi: 10.1053/j.ajkd.2015.05.001. [DOI] [PMC free article] [PubMed] [Google Scholar]
- Thisse B, Pflumio S, Fürthauer M, et al. Expression of the zebrafish genome during embryogenesis. ZFIN Direct Data Submission. 2001 http://zfin.org.
- Thisse B, Thisse C. Fast Release Clones: A High Throughput Expression Analysis. ZFIN Direct Data Submission. 2004 http://zfin.org.
- Vize PD, Seufert DW, Carroll TJ, Wallingford JB. Model systems for the study of kidney development: use of the pronephros in the analysis of organ induction and patterning. Dev Biol. 1997;188:189–204. doi: 10.1006/dbio.1997.8629. [DOI] [PubMed] [Google Scholar]
- Vu HTK, Rink JC, McKinney SA, et al. Stem cells and fluid flow drive cyst formation in an invertebrate excretory organ. eLIFE. 2015;4:e07405. doi: 10.7554/eLife.07405. [DOI] [PMC free article] [PubMed] [Google Scholar]
- Wang L, Fu C, Fan H, et al. miR-34b regulates multiciliogenesis during organ formation in zebrafish. Development. 2013;140:2755–2764. doi: 10.1242/dev.092825. [DOI] [PubMed] [Google Scholar]
- Wanner A, Salathe M, O'Riordan TG. Mucociliary clearance in the airways. Am J Respir Crit Care Med. 1996;154:1868–1902. doi: 10.1164/ajrccm.154.6.8970383. [DOI] [PubMed] [Google Scholar]
- Wasylyk B, Hagman J, Gutierrez-Hartmann A. Ets transcription factors: nuclear effectors of the Ras-MAP-kinase signaling pathway. Trends Biochem Sci. 1998;23:213–216. doi: 10.1016/s0968-0004(98)01211-0. [DOI] [PubMed] [Google Scholar]
- Werner ME, Mitchell BJ. Understanding ciliated epithelia: the power of Xenopus. Genesis. 2012;50:176–185. doi: 10.1002/dvg.20824. [DOI] [PMC free article] [PubMed] [Google Scholar]
- Wingert RA, Brownlie A, Galloway JL, et al. The chianti zebrafish mutant provides a model for erythroid-specific disruption of transferrin receptor 1. Development. 2004;131:6225–6235. doi: 10.1242/dev.01540. [DOI] [PubMed] [Google Scholar]
- Wingert RA, Galloway JL, Barut B, et al. Deficiency of glutaredoxin 5 reveals Fe-S clusters are required for vertebrate haem synthesis. Nature. 2005;436:1035–1039. doi: 10.1038/nature03887. [DOI] [PubMed] [Google Scholar]
- Wingert RA, Selleck R, Yu J, et al. The cdx genes and retinoic acid control the positioning and segmentation of the zebrafish pronephros. PLoS Genet. 2007;3(10):1922–38. doi: 10.1371/journal.pgen.0030189. [DOI] [PMC free article] [PubMed] [Google Scholar]
- Wingert RA, Davidson AJ. The zebrafish pronephros: a model to study nephron segmentation. Kid Int. 2008;73:1120–1127. doi: 10.1038/ki.2008.37. [DOI] [PubMed] [Google Scholar]
- Wingert RA, Davidson AJ. Zebrafish nephrogenesis involves dynamic spatiotemporal expression changes in renal progenitors and essential signals from retinoic acid and irx3b. Dev Dyn. 2011;240(8):2011–27. doi: 10.1002/dvdy.22691. [DOI] [PMC free article] [PubMed] [Google Scholar]
- Worthington WC, Cathcart RS. Ependymal cilia: distribution and activity in the adult human brain. Science. 1963;139:221–222. doi: 10.1126/science.139.3551.221. [DOI] [PubMed] [Google Scholar]
- Zimmerman HD. Cilia in the fetal kidney of man. Beitrage zur Pathologie. 1971;143:227–240. [PubMed] [Google Scholar]
- Znosko WA, Yu S, Thomas K, et al. Overlapping functions of Pea3 ETS transcription factors in FGF signaling during zebrafish development. Dev Biol. 2010;342:11–25. doi: 10.1016/j.ydbio.2010.03.011. [DOI] [PMC free article] [PubMed] [Google Scholar]
Associated Data
This section collects any data citations, data availability statements, or supplementary materials included in this article.