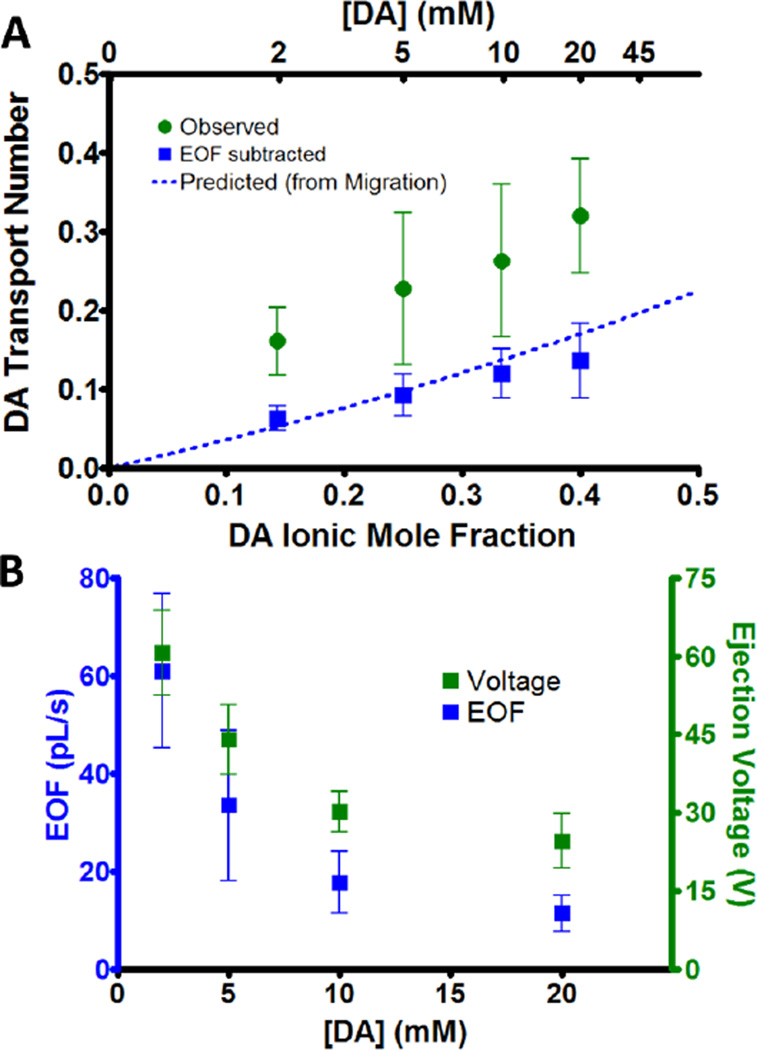
Figure 3.
Effect of ion concentration on transport number and EOF. (A) DA observed transport numbers (green circles) for 120 nA ejections of equimolar DA and HQ in 5 mM NaCl (n=6). The transport numbers were recalculated after subtracting the DA amount ejected due to EOF (blue squares). The predicted transport number (dotted blue line) from Equation 1 is shown for comparison. (B) The iontophoretic pump voltage (green) and EOF (blue) for ejections in part A.

